
What is No-code Data Analysis: An Easy Way for Data Processing
Yulu
Jul 22, 2024
In today's data-driven world, the ability to analyze and interpret data is crucial for making informed business decisions. However, not everyone has the technical skills required to write complex code or use advanced data analysis software. This is where no-code data analysis tools come into play.
These platforms democratize data insights by providing user-friendly interfaces that allow individuals without programming expertise to perform sophisticated analyses. By eliminating the need for coding, no-code tools enable faster, more efficient data processing and empower a broader range of professionals to contribute to data-driven decision-making.Today, we want to try Powerdrill AI--a new AI tool which can complete no-code data analysis perfectly.
Why we need data analysis?
Data analysis is the process of examining, cleaning, transforming, and modeling data to discover useful information, draw conclusions, and support decision-making. It involves various techniques and tools to analyze raw data and extract meaningful insights.
There are many moments that require the use of data analysis , here are some common scenarios :
1. Business Intelligence: Companies use data analytics to make informed business decisions, identify market trends, and improve operational efficiency.
2. Healthcare: Data analytics helps in predicting disease outbreaks, improving patient care, and managing healthcare resources effectively.
3. Finance: Financial institutions use data analytics for risk management, fraud detection, and investment strategies.
4. Marketing: Marketers analyze customer data to understand buying behavior, segment markets, and personalize marketing campaigns.
5. Sports: Teams and coaches use data analytics to evaluate player performance, develop game strategies, and prevent injuries.
6. Government: Governments use data analytics for policy-making, public safety, and managing public resources efficiently.
Why we turn to no-code data analysis?
Traditional data analysis: challenging and demanding
Traditional data analysis often presents several challenges, especially when it comes to the need for coding and technical skills. Here are some of the key difficulties:
Technical Expertise:
Programming Skills: Traditional data analysis often requires knowledge of programming languages such as Python, R, SQL, and sometimes even Java or C++. This can be a significant barrier for individuals who do not have a background in computer science or data science.
Statistical Knowledge: Understanding statistical methods and how to apply them correctly is crucial. This requires a solid foundation in statistics, which not everyone possesses.
Complexity of Tools:
Learning Curve: Tools like Hadoop, Apache Spark, and various machine learning libraries (e.g., TensorFlow, Scikit-learn) have steep learning curves. Mastering these tools requires time and effort, which can be daunting for beginners.
Configuration and Setup: Setting up and configuring these tools often involves complex steps, including installing dependencies, configuring environments, and managing versions.
Data Preparation:
Data Cleaning: Cleaning data involves handling missing values, correcting errors, and dealing with inconsistencies. This process is often labor-intensive and requires custom scripts.
Data Transformation: Transforming data into a suitable format for analysis can be complex. This might involve normalizing data, creating new features, or aggregating data from multiple sources.
ETL Processes: Extract, Transform, Load (ETL) processes are essential for preparing data but can be technically challenging to implement and maintain.
Scalability:
Handling Large Datasets: Analyzing large datasets requires efficient algorithms and optimized code to ensure performance. This often involves parallel processing and distributed computing, which are advanced topics.
Resource Management: Managing computational resources (CPU, memory, storage) effectively is crucial for handling large-scale data analysis. This requires a good understanding of system architecture and performance tuning.
Integration:
Data Integration: Combining data from various sources (databases, APIs, flat files) often requires custom coding to ensure data consistency and accuracy.
Interoperability: Ensuring that different tools and systems can work together seamlessly can be challenging, especially when dealing with legacy systems or proprietary formats.
Visualization and Reporting:
Custom Visualizations: Creating custom visualizations often requires coding skills and familiarity with visualization libraries (e.g., Matplotlib, D3.js).
Interactive Dashboards: Building interactive dashboards that allow users to explore data dynamically can be complex and time-consuming.
Maintenance and Updates:
Code Maintenance: Keeping analysis scripts up-to-date and ensuring they work with new data or changing requirements can be a continuous effort.
Version Control: Managing different versions of data and analysis scripts requires good practices in version control, which can be complex to implement.
No-code data analysis:easy and accessible
Given these challenges, there is a growing trend towards no-code data analysis tools powered by AI. These tools aim to democratize data analysis by making it accessible to a broader audience, regardless of their technical background. Here are some benefits of no-code data analysis tools:
Ease of Use: No-code tools typically feature intuitive drag-and-drop interfaces, making it easier for users to perform complex data analysis tasks without writing code.
Accessibility: These tools lower the barrier to entry, allowing professionals from various fields to leverage data analytics without needing extensive technical training.
Speed: No-code tools can significantly speed up the data analysis process by automating many of the tasks that would traditionally require manual coding.
Collaboration: They often include features that facilitate collaboration among team members, enabling non-technical stakeholders to participate in the data analysis process.
Integration: Many no-code tools offer seamless integration with various data sources and other software, simplifying the data preparation and analysis workflow.
Examples of no-code data analysis tools include Powerdrill AI,Tableau, Power BI, and Google Data Studio, among others. These tools are increasingly being adopted across industries to empower more people to make data-driven decisions.
Why we choose Powerdrill AI to complete no-code data analysis?
Compared to other AI tools, Powerdrill AI stands out in terms of functionality and price: Powerdrill AI is more affordable than Tableau or Qlik Sense, and users can also experience its features for free; compared to Microsoft Power BI or Google Data Studio, Powerdrill AI can perform advanced analytics, ensuring accuracy while supporting larger datasets, and you can build your own knowledge base.
The advantages of Powerdrill AI also include:
Intuitive and user-friendly interface, allowing you to perform no-code operations very intuitively
Wide range of visualization options (line, bar, pie chart, etc.)
Advanced analytics capabilities, completing your serious data work 100x faster
Supports various data formats (excel, pdf, text, website, sql, etc.), and also supports integration with external applications (such as Dropbox)
Absolutely safe, Powerdrill AI adheres to rigorous compliance standards like GDPR, ISO 27001, and SOC2 (in progress)
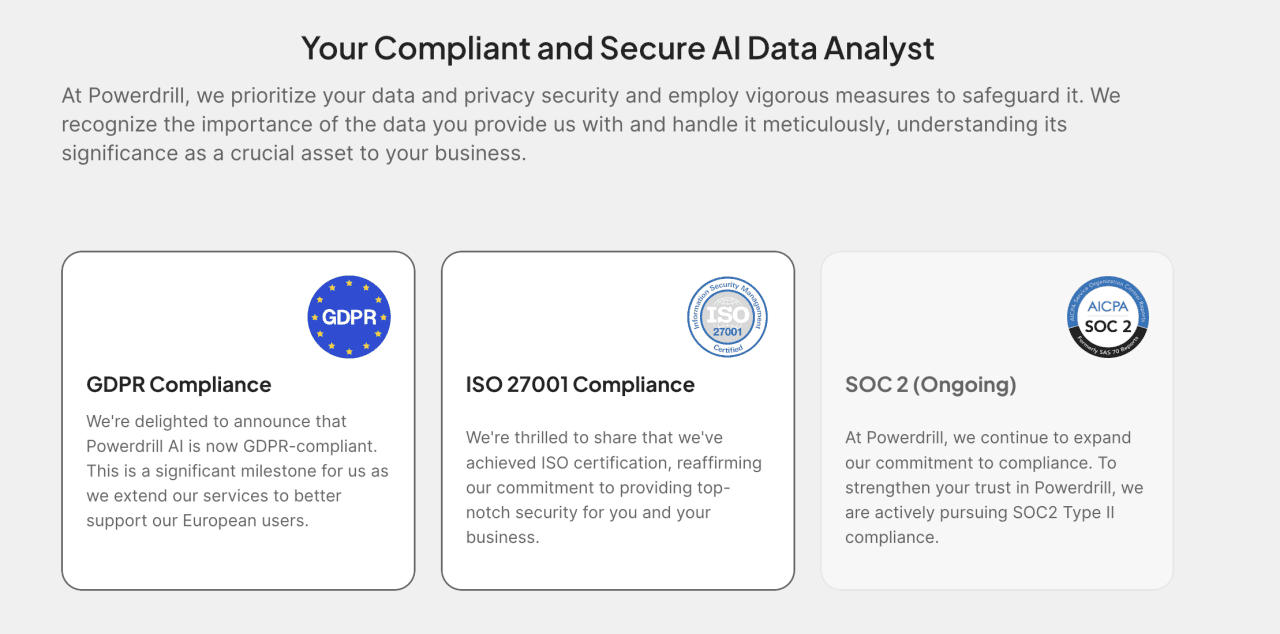
Therefore, we highly recommend new users in data analysis to use Powerdrill AI to reduce work difficulty, and also encourage professional users who have been deeply involved in the field of data analysis for many years to use Powerdrill AI to improve work efficiency, so that professional skills are no longer a limitation to your work. Now, let's see how to operate it specifically!
How to experience no-code data analysis in Powerdrill AI?
Way 1:Use the "Data Analytics" feature, chat with your data easily
First, you can search for powerdrill.ai in the browser and log in.
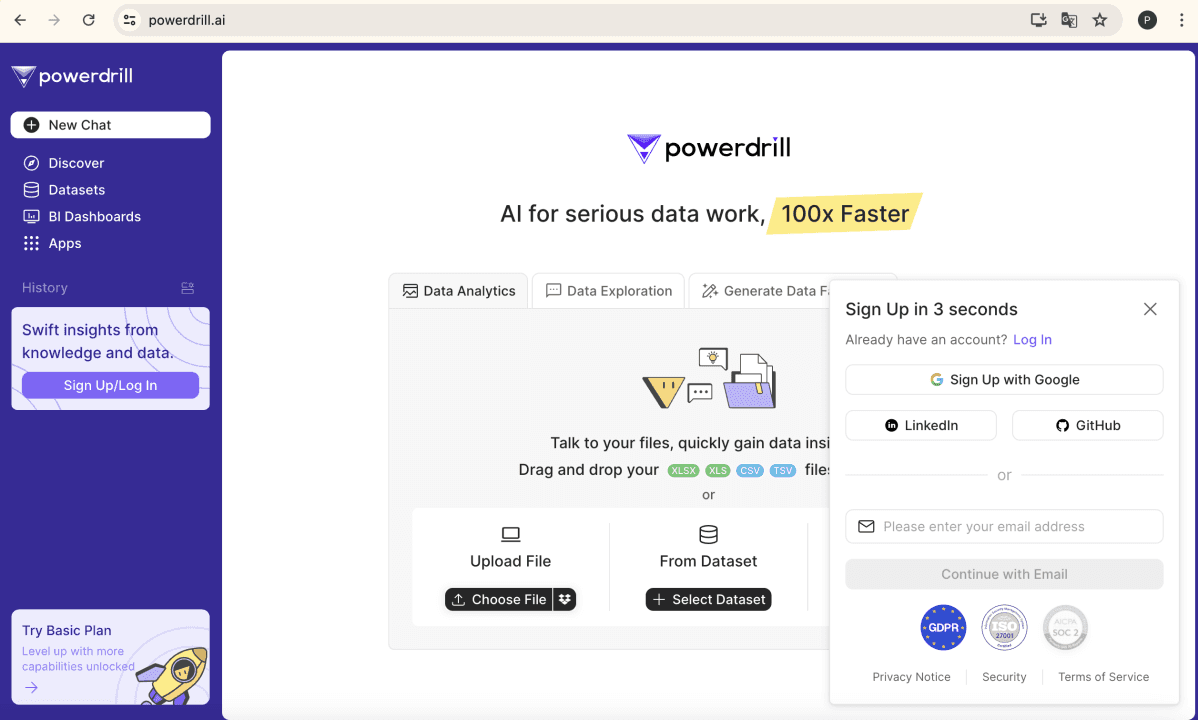
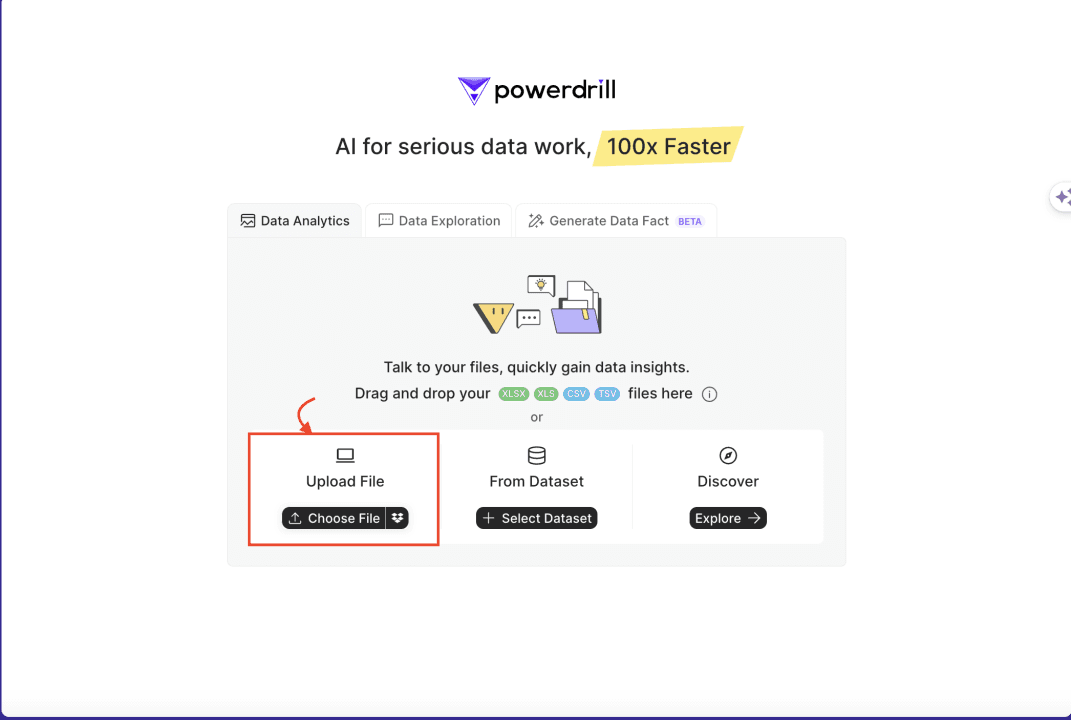
You can see the Data Analytics option, now click Upload File, and you can upload one or more xlsx, xls, csv, tsv files.
It only takes a few seconds, and by the time this page is displayed, your dataset will be uploaded.
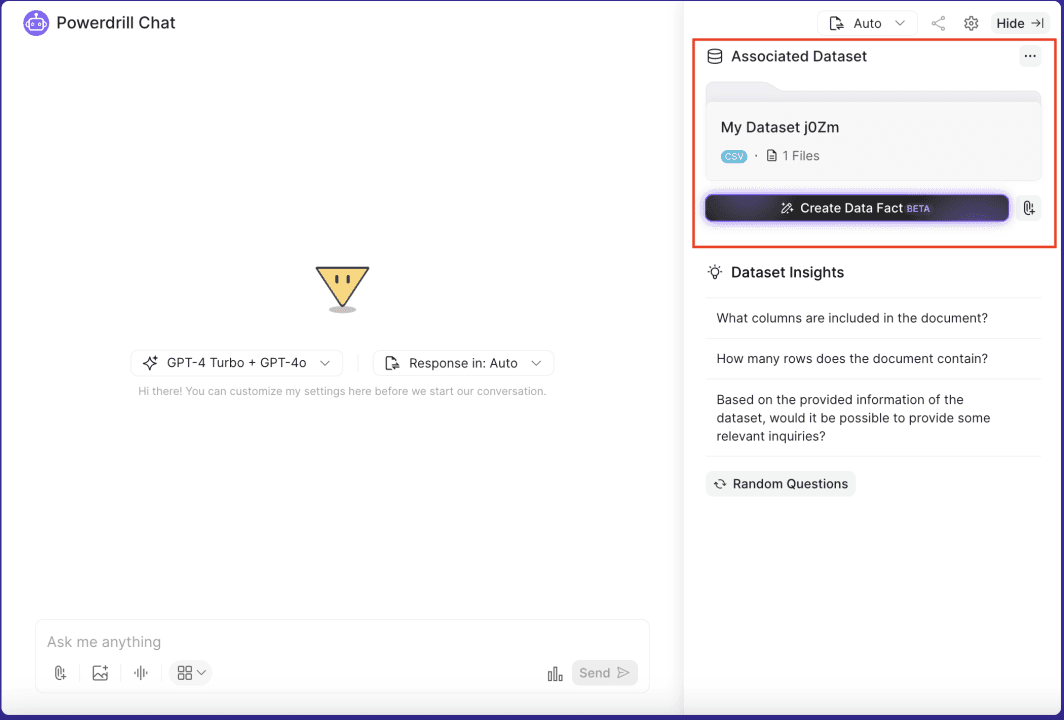
We can choose the LLM and the language to respond in:


Now, let's take a look at the results of no-code data analysis:
We click on "Dataset Insights" on the right side and select "Based on the provided information of the dataset, would it be possible to provide some relevant inquiries?" to have Powerdrill AI generate some perspectives for exploring the dataset.
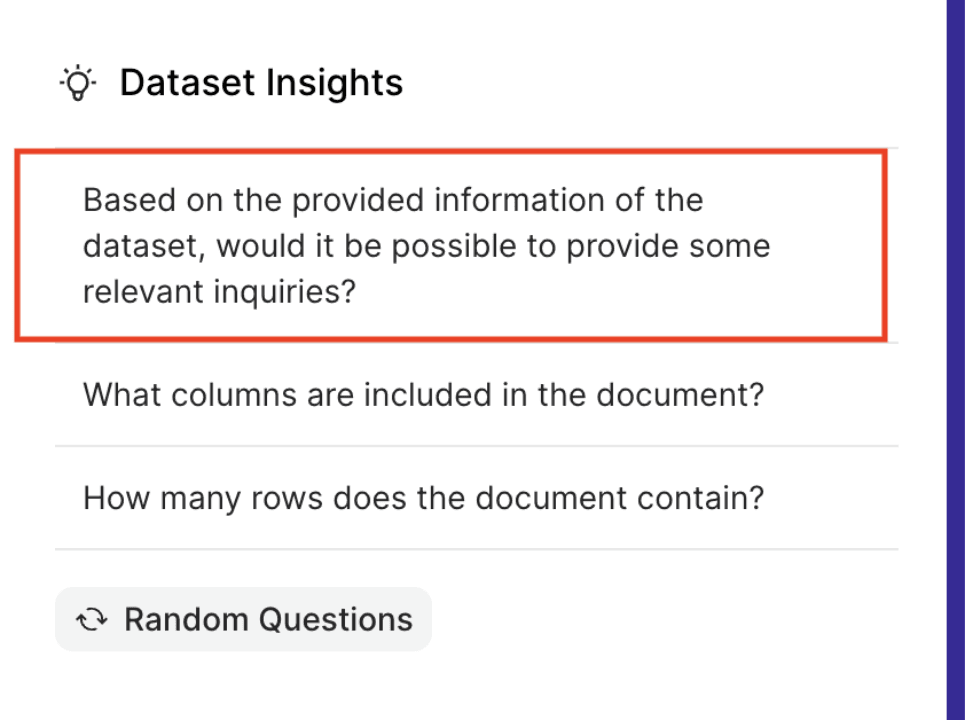
It automatically generated many questions, all of which are highly relevant to our database.
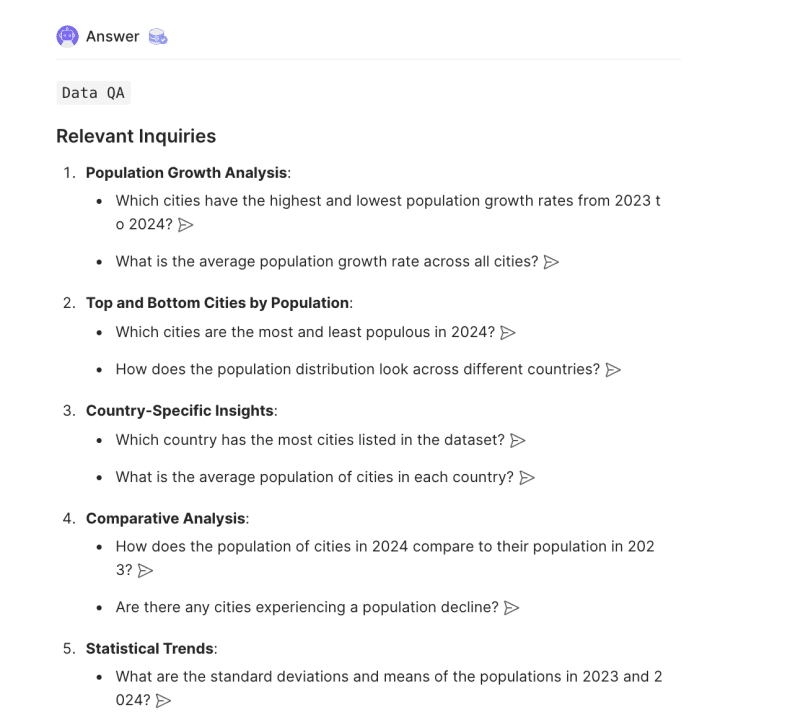
We can choose some comprehensive questions to ask, such as "Which cities have the highest and lowest population growth rates from 2023 to 2024?"

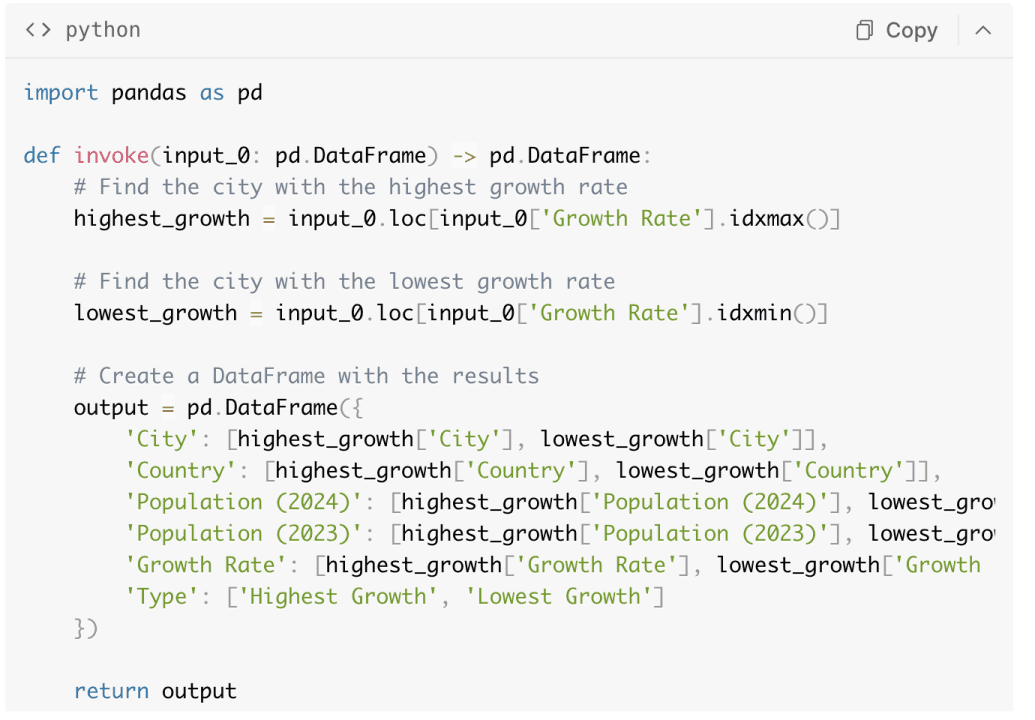
During the process, Powerdrill AI generated the corresponding Python code, which can be copied directly by clicking "Copy.”
Additionally, Powerdrill AI generated a filtered table that we can easily download.
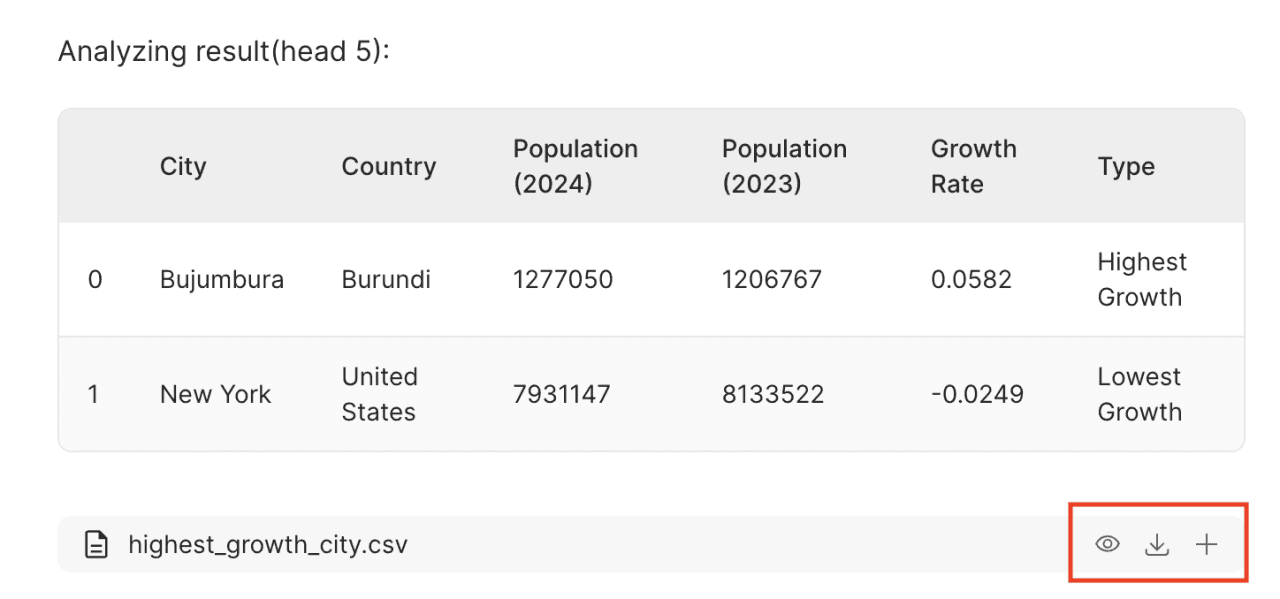
Moreover, Powerdrill AI provides a complete answer to our question in text form, making it clear, fast, and accurate.
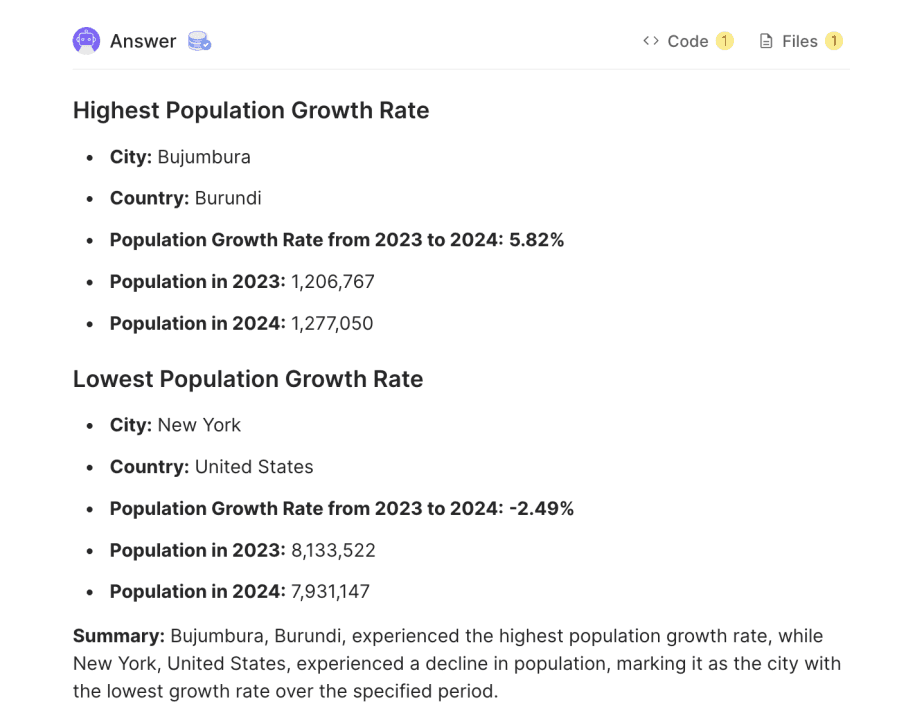
Way 2: Use the "Generate Data Fact" feature, Generate data facts directly from your data files.
On the homepage, you will see a section labeled "Generate Data Fact."
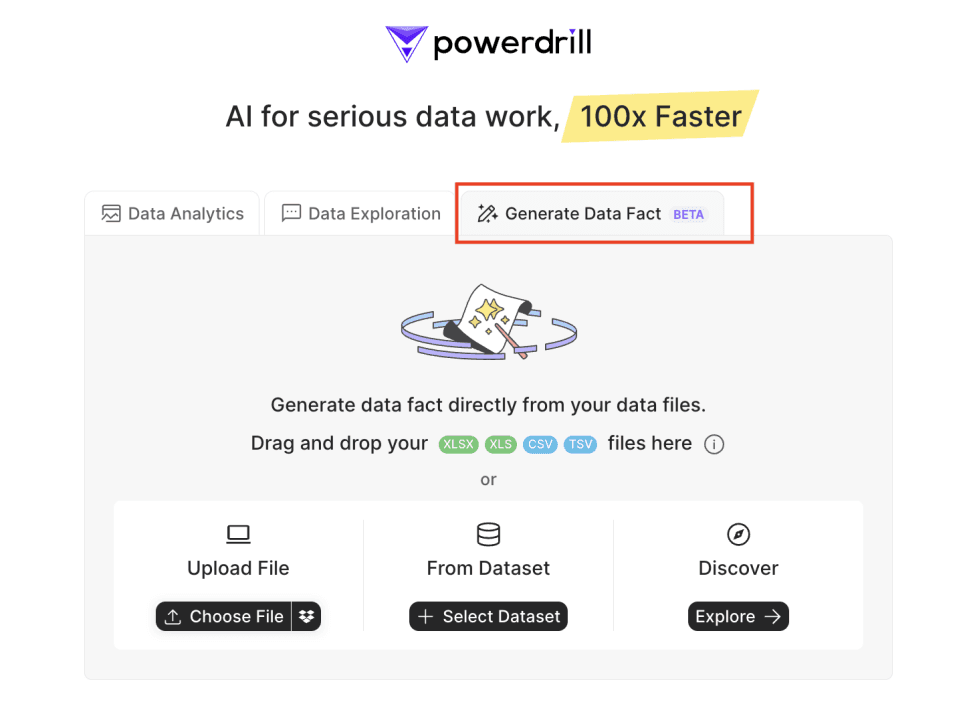
Select "Upload File" and upload one or more xlsx, xls, csv, or tsv files.
The page will directly enter the generation process. It will analyze the dataset, pose relevant questions, and provide answers, resulting in a complete article that includes a title image, outline, detailed content, and relevant charts and graphs.

You don't need to take any action to get this ,no need to possess any coding skills or ask questions. Simply upload your dataset, and you will receive an in-depth analysis of the data.
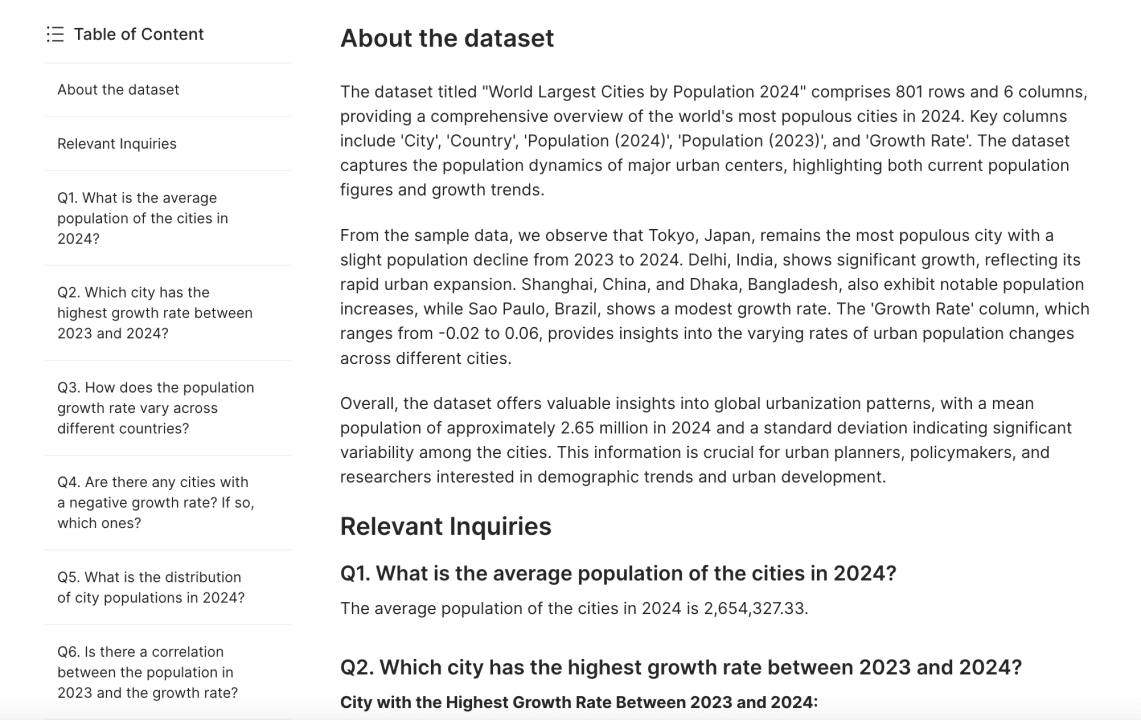
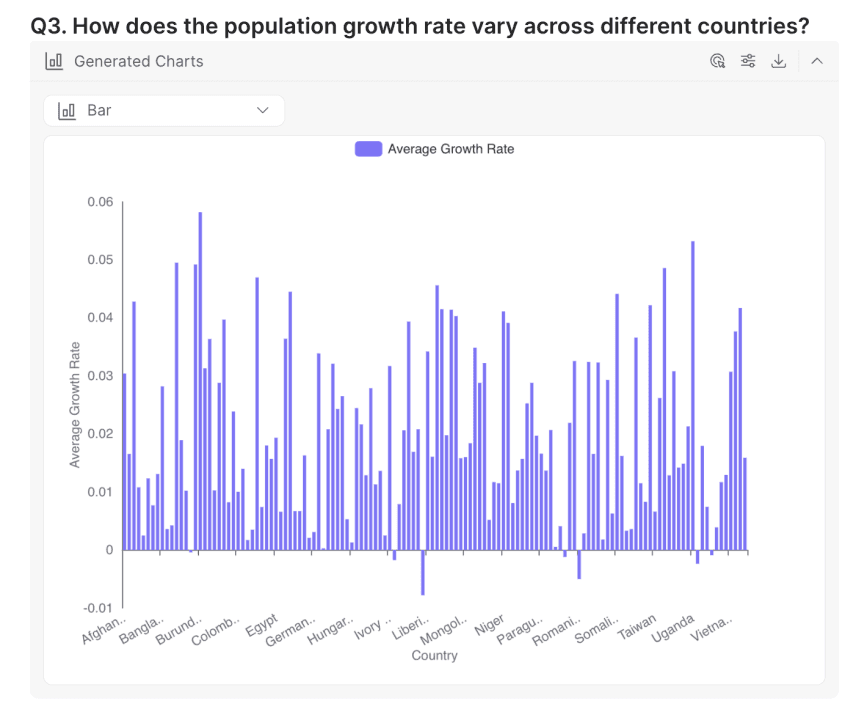
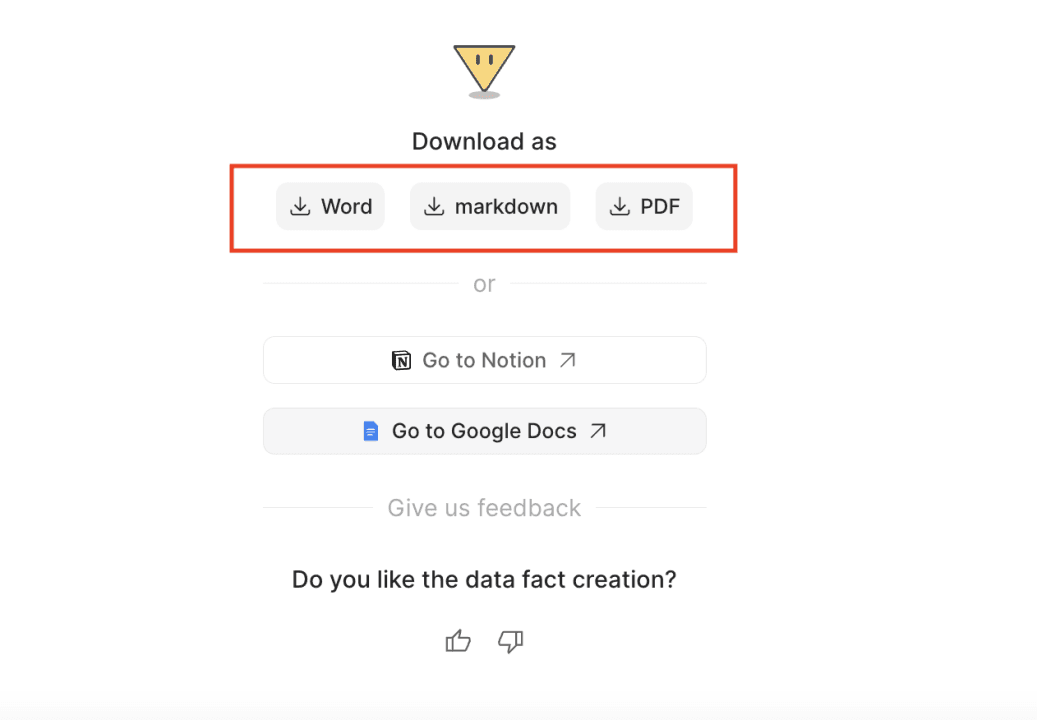
We can export and share this article in formats like Word, Markdown, PDF, which is convenient and fast.
You can see moreData Fact Samples here :Data Facts: IMDB top 250 TV shows, Data Facts: Insights from the World Happiness Report 2024,Data Facts: World Largest Cities by Population 2024
Try it now!
With Powerdrill AI, you can easily complete tedious operations in Excel in a no-code way:
Check how to use Powerdrill AI in following scenarios:
Get more information by reading our blog and feel free to try Powerdrill AI now!


