Data Facts: IMDB top 250 TV shows

This blog provides data facts on IMDb's top 250 TV shows, covering aspects like statistical distributions, time trends, category comparisons, rating-vote count relationships, and the impact of age ratings.
source: kaggle
Given the dataset, Powerdrill detects and analyzes the metadata, then gives these relevant inquiries:
Basic Statistical Analysis
Distribution of IMDb Ratings
Top 5 TV Shows by Vote Counts
Summary Statistics of IMDb Ratings
Time Trend Analysis
Number of TV Shows Released Per Year
Average IMDb Rating by Decade
Trend of Average IMDb Ratings Over the Years
Annual Release Trend of TV Shows
Category Comparison Analysis
Average IMDb Ratings by Category
Total Number of Episodes
Distribution of IMDb Ratings by Category
Relationship Between Ratings and Vote Counts
Correlation Between Ratings and Vote Counts
Scatter Plot of Ratings vs. Vote Counts
Influence of Age Rating
Rating Distribution by Age Rating
Vote Counts by Age Rating
Basic Statistical Analysis
Distribution of IMDb Ratings
Key Observations from Data:
Mean Rating: 8.76
Standard Deviation: 0.23
Minimum Rating: 8.50
Maximum Rating: 9.50
Top Ratings: The highest ratings observed are two instances of 9.5, followed by two instances of 9.4 and one instance of 9.3.
Histogram Analysis:
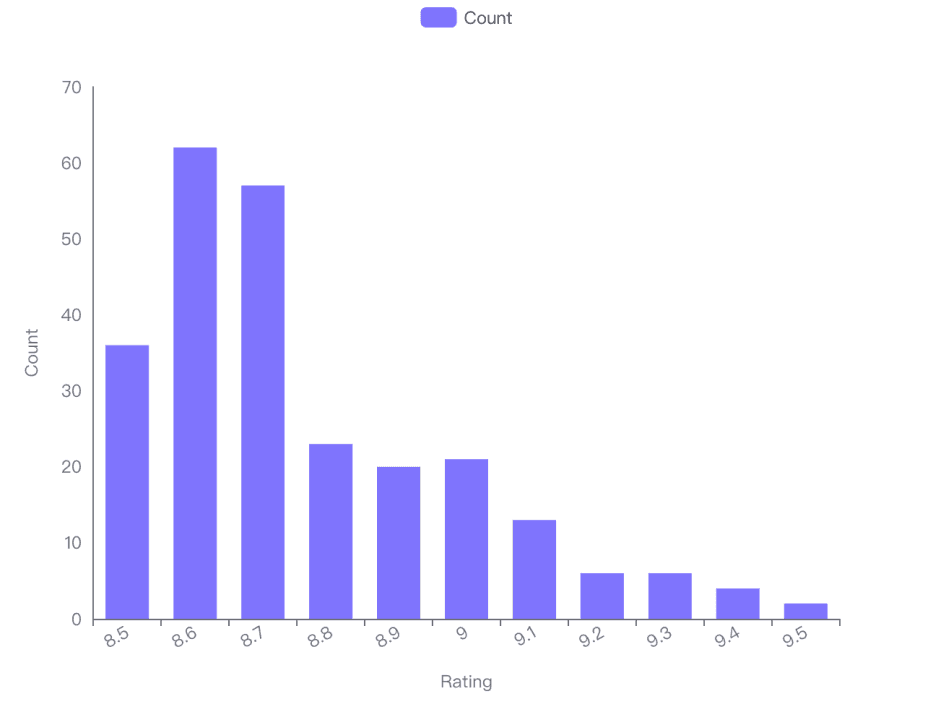
Visual Representation: The histogram provided visualizes the frequency distribution of IMDb ratings among the top 250 TV shows.
Rating Range: The ratings range from 8.5 to 9.5.
Most Common Ratings: The histogram shows a high frequency of ratings between 8.5 and 9.0, indicating that most of the top 250 TV shows are rated within this range.
Lesser Frequency at Higher Ratings: There is a noticeable decrease in frequency as the ratings approach the maximum of 9.5, suggesting that fewer shows achieve these top ratings.
Top 5 TV Shows by Vote Counts
1. Game of Thrones
Vote Count: 2,300,000
Year: 2011–2019
Total Episodes: 74 episodes
Age Rating: 18
Rating: 9.2
Category: TV Series
2. Breaking Bad
Vote Count: 2,200,000
Year: 2008–2013
Total Episodes: 62 episodes
Age Rating: 18
Rating: 9.5
Category: TV Series
3. Stranger Things
Vote Count: 1,400,000
Year: 2016–2025
Total Episodes: 42 episodes
Age Rating: 15
Rating: 8.7
Category: TV Series
4. Friends
Vote Count: 1,100,000
Year: 1994–2004
Total Episodes: 234 episodes
Age Rating: PG
Rating: 8.9
Category: TV Series
5. Sherlock
Vote Count: 1,000,000
Year: 2010–2017
Total Episodes: 15 episodes
Age Rating: 15
Rating: 9.1
Category: TV Series
Summary Statistics of IMDb Ratings
Based on the provided dataset, the summary statistics for IMDb ratings are as follows:
Mean Rating: 8.76
Standard Deviation: 0.23
Minimum Rating: 8.50
Maximum Rating: 9.50
These statistics provide an overview of the distribution of ratings among the top 250 TV shows listed in the dataset.
Time Trend Analysis
Number of TV Shows Released Per Year
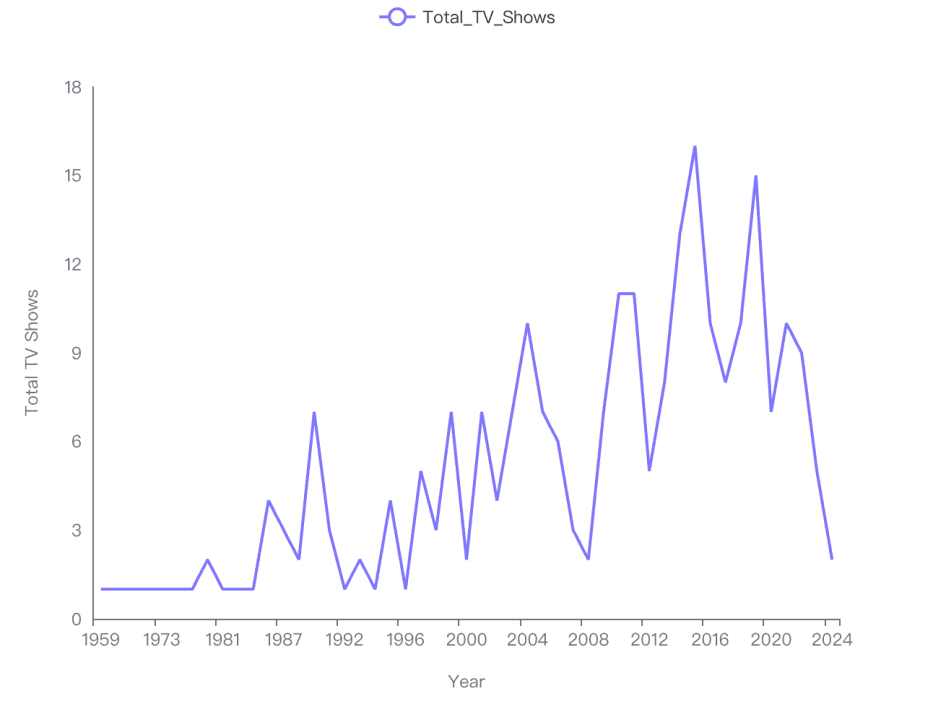
Trend Analysis: The line chart indicates a fluctuating but generally increasing trend in the number of TV shows released annually from 1959 to around 2020. There was a noticeable spike in releases in the early 2000s, followed by a sharp increase peaking around 2020.
Key Observation: The peak around 2020 suggests a significant increase in TV show productions, possibly influenced by the rise of streaming platforms.
Average IMDb Ratings of TV Shows Released Each Decade
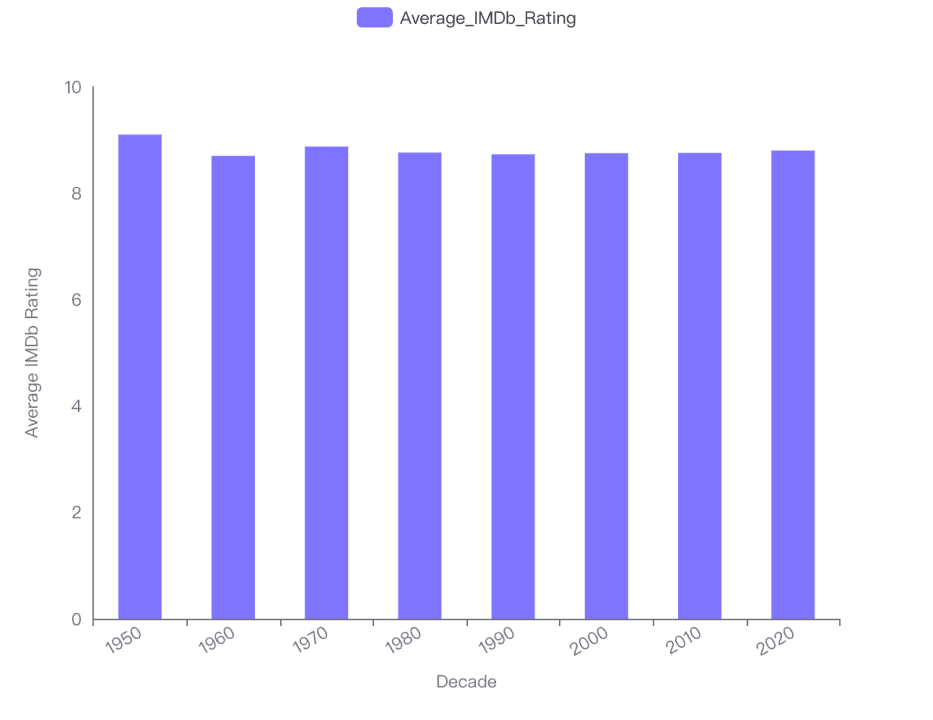
Trend Analysis: The bar chart shows that the average IMDb ratings have remained relatively stable across decades, with slight variations. The 1950s hold the highest average rating, while the 1960s show the lowest.
Key Observation: Despite changes in TV show production and audience preferences over time, the quality, as rated by IMDb, remains consistently high.
Trend of Average IMDb Ratings of Top 250 TV Shows Over the Years
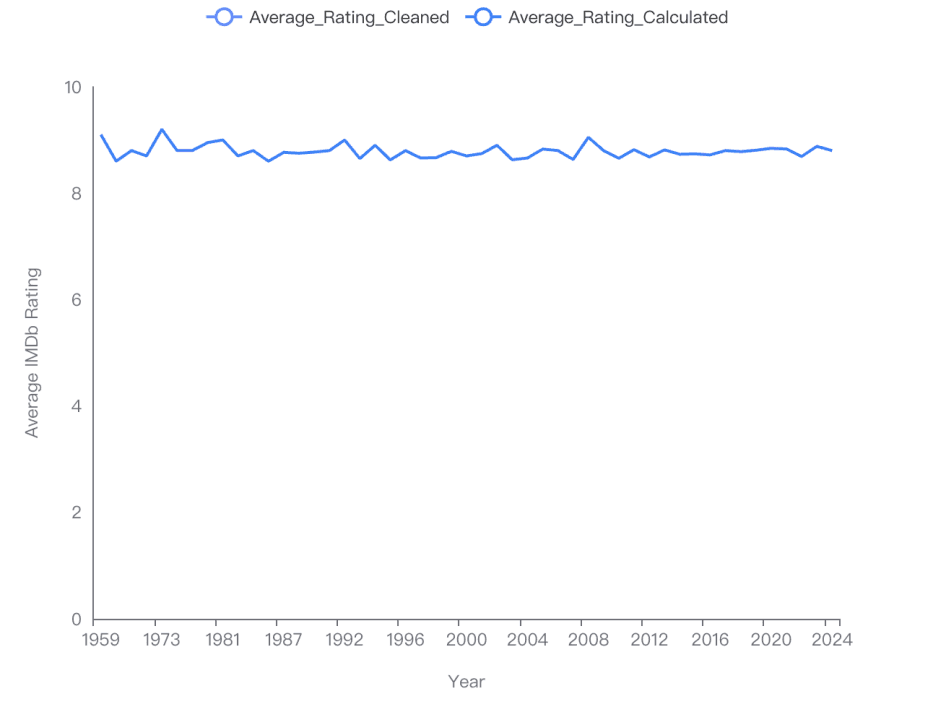
Trend Analysis: The line chart reveals a more volatile trend in the average IMDb ratings of the top 250 TV shows, with noticeable dips and rises. The ratings peaked in the early 1970s and mid-1990s.
Key Observation: The fluctuations might reflect changes in viewer preferences, critical standards, or the impact of particularly influential TV shows during certain periods.
Changes in the Number of TV Shows Released Annually Over Time
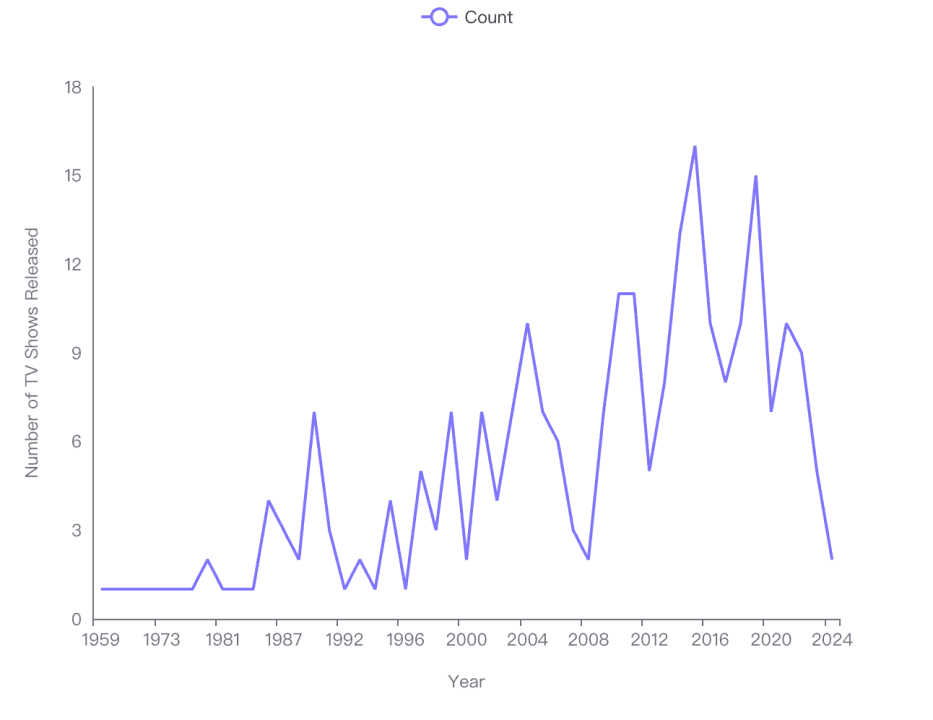
Trend Analysis: The line chart illustrates significant year-to-year variability in the number of TV shows released. There is a general upward trend until a sharp rise leading up to 2020, followed by a sudden drop.
Key Observation: The sharp drop post-2020 could be attributed to global events such as the COVID-19 pandemic impacting production schedules and release plans.
Overall Insights
The entertainment industry, particularly television, has seen significant growth in content production over the last few decades, likely driven by technological advancements and new distribution channels.
Despite the increase in quantity, the quality of top-rated shows has remained high, with average ratings staying relatively stable.
External factors like global events can have a noticeable impact on production and release patterns in the TV industry.
Category Comparison Analysis
Comparison of Average IMDb Ratings
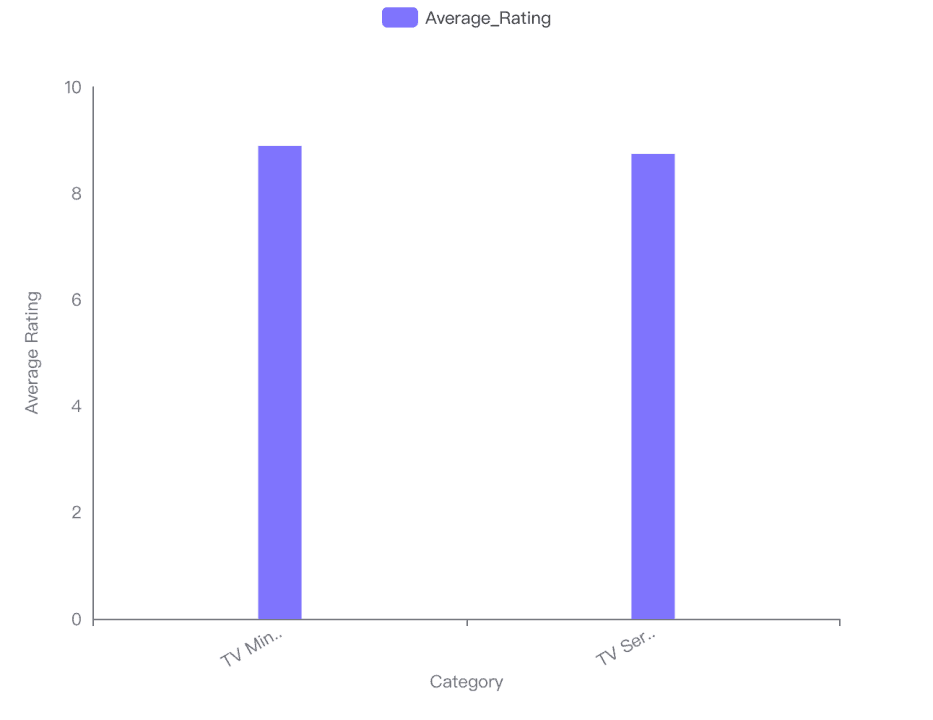
TV Mini Series have a higher average IMDb rating of 8.89 compared to TV Series, which have an average rating of 8.74. This suggests that TV Mini Series tend to be rated more favorably by viewers.
Total Number of Episodes
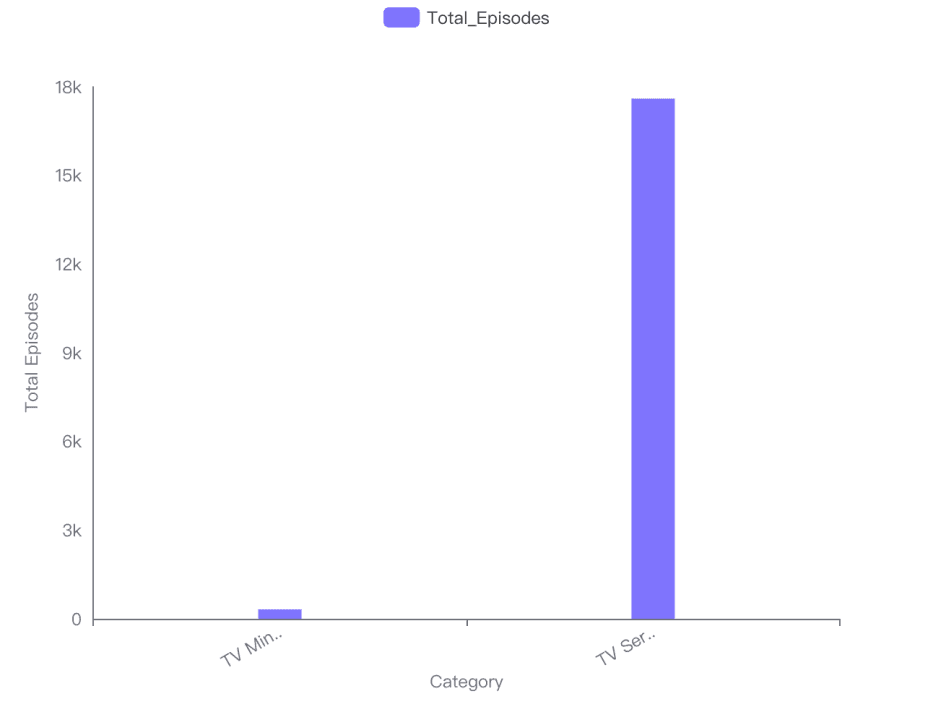
TV Series significantly outnumber TV Mini Series in terms of total episodes, with 17,597 episodes for TV Series compared to only 319 episodes for TV Mini Series. This indicates that TV Series generally have longer runs and more extensive content.
Distribution of IMDb Ratings
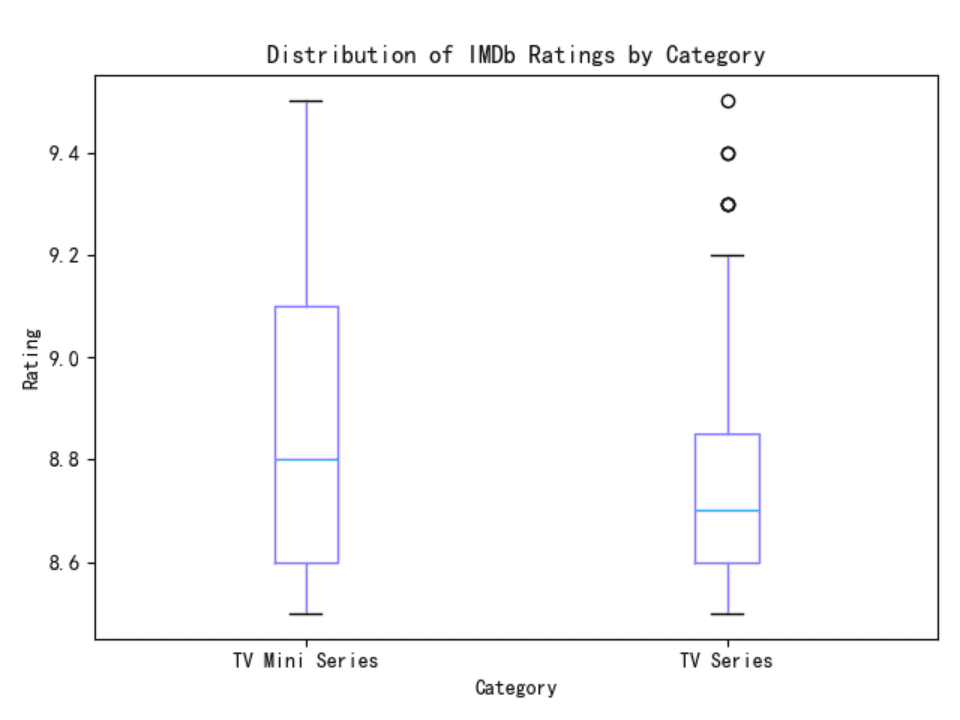
The box plot visualization shows that TV Mini Series tend to have a tighter distribution of high ratings, mostly between 8.8 and 9.4, with outliers extending up to 9.5.
TV Series, on the other hand, show a broader range of ratings from 8.6 to 9.2, with outliers reaching up to 9.5. This wider range suggests more variability in the quality or viewer reception of TV Series.
Relationship Between Ratings and Vote Counts
Correlation Between Ratings and Vote Counts
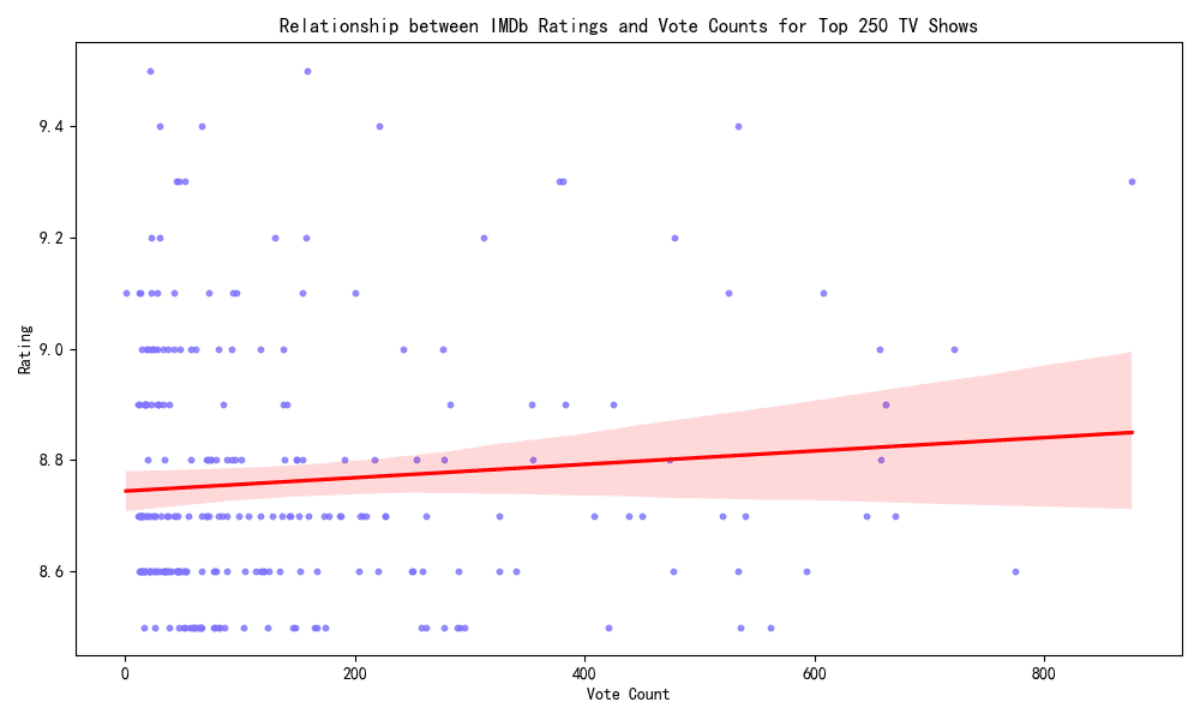
Correlation Coefficient: The correlation coefficient between IMDb ratings and vote counts for the top 250 TV shows is 0.115479. This value indicates a very weak positive correlation between the two variables.
Interpretation
Strength of Relationship: The correlation coefficient close to 0 suggests that there is hardly any linear relationship between the ratings given to TV shows and the number of votes they receive.
Implications: This implies that higher ratings do not necessarily correlate with a higher number of votes, and vice versa. The popularity of a show (as indicated by vote counts) does not strongly influence its rating.
Statistical Details
Rating Statistics: Mean = 8.76, Standard Deviation = 0.23, Minimum = 8.50, Maximum = 9.50
Vote Count Statistics: Mean = 148,360.03, Standard Deviation = 177,781.48, Minimum = 1.10, Maximum = 1,000,000.00
Scatter Plot of Ratings vs. Vote Counts
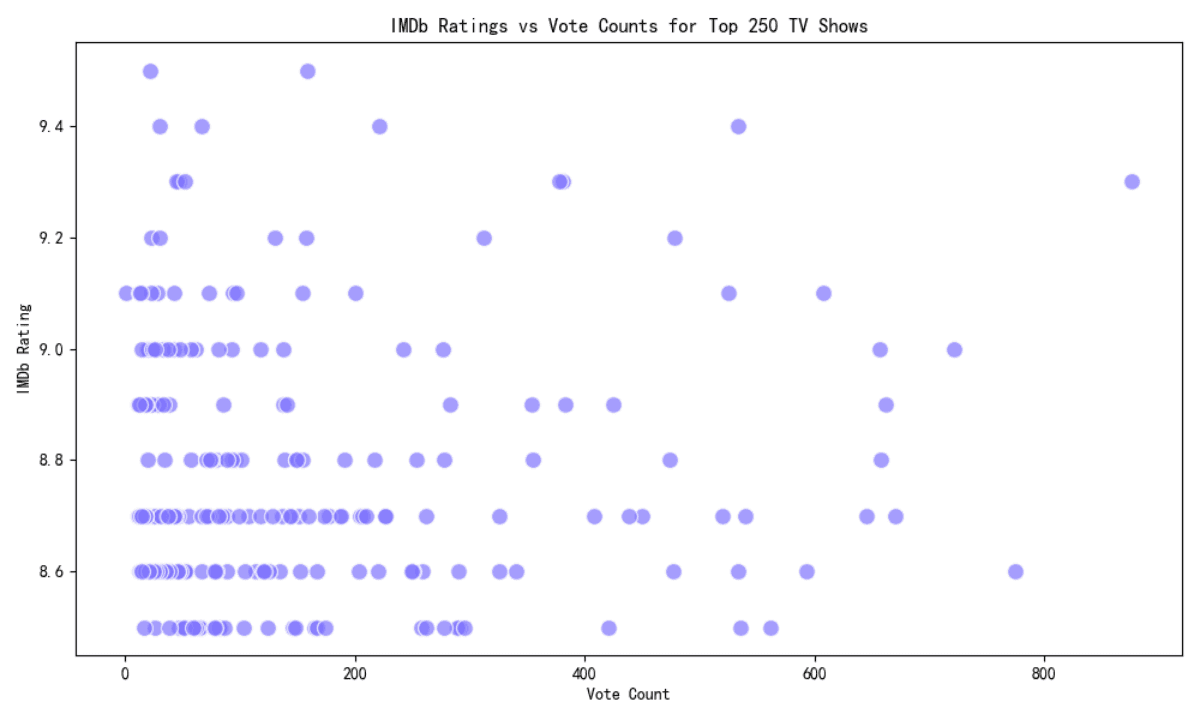
Scatter Plot Overview: The provided scatter plot visually represents the relationship between IMDb ratings and vote counts for the top 250 TV shows. The x-axis represents the vote counts, while the y-axis shows the IMDb ratings.
Key Observations
Distribution of Ratings: The ratings mostly range between 8.6 and 9.5, with a concentration of shows rated around 8.8 to 9.0.
Vote Count Spread: The vote counts vary widely from very few votes to as high as approximately 876 votes.
Density of Data Points: There is a higher density of data points with lower vote counts, indicating that most of the top 250 TV shows have fewer votes but still maintain high ratings.
Correlation Insight: There does not appear to be a strong linear correlation between the number of votes a show receives and its IMDb rating. High-rated shows can have both low and high vote counts.
Influence of Age Rating
Rating Distribution by Age Rating
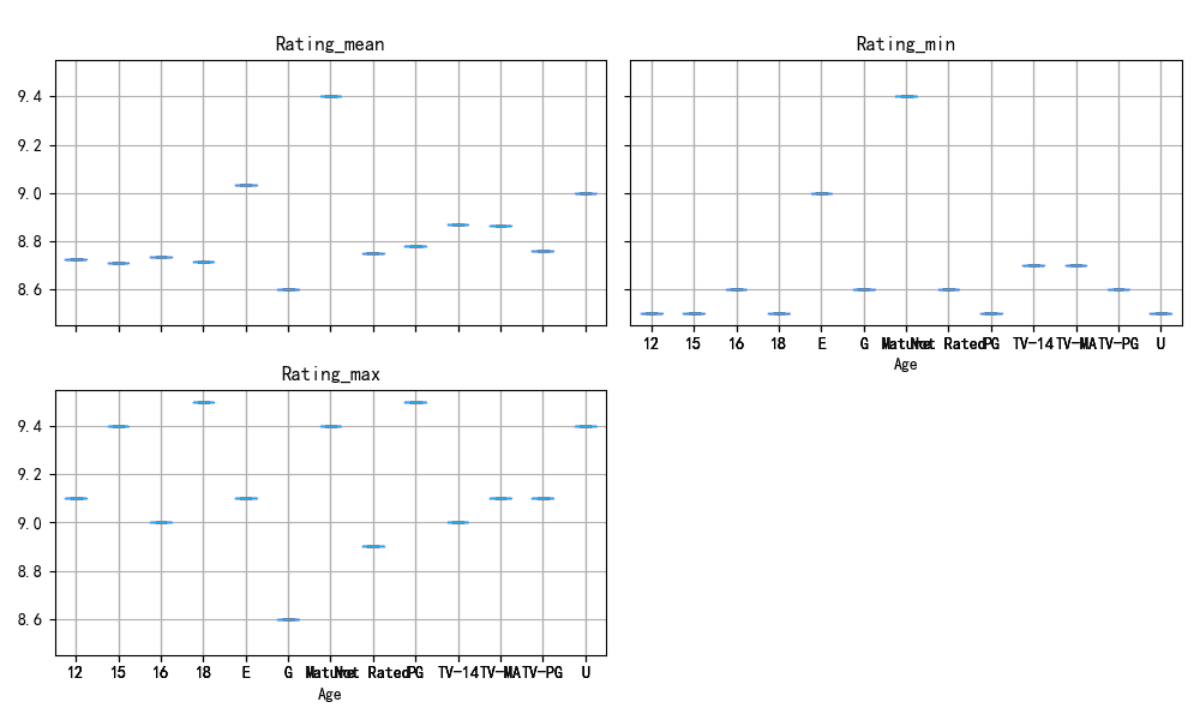
Mean Ratings: Shows rated 'E' (Everyone) have the highest average IMDb rating at approximately 9.03, indicating a generally favorable reception. Other categories like '12', '15', '16', and '18' have mean ratings ranging from 8.71 to 8.73, showcasing consistently high quality across these age groups.
Rating Variability: The standard deviation of ratings for 'E' rated shows is notably lower (around 0.06), suggesting more consistent ratings within this category. Other categories exhibit slightly higher variability, with standard deviations around 0.20 to 0.24.
Range of Ratings: The maximum ratings for shows are consistently high across all categories, often reaching 9.0 or above, with '18' rated shows reaching up to 9.5. The minimum ratings are also relatively high, rarely dropping below 8.5.
Vote Counts by Age Rating
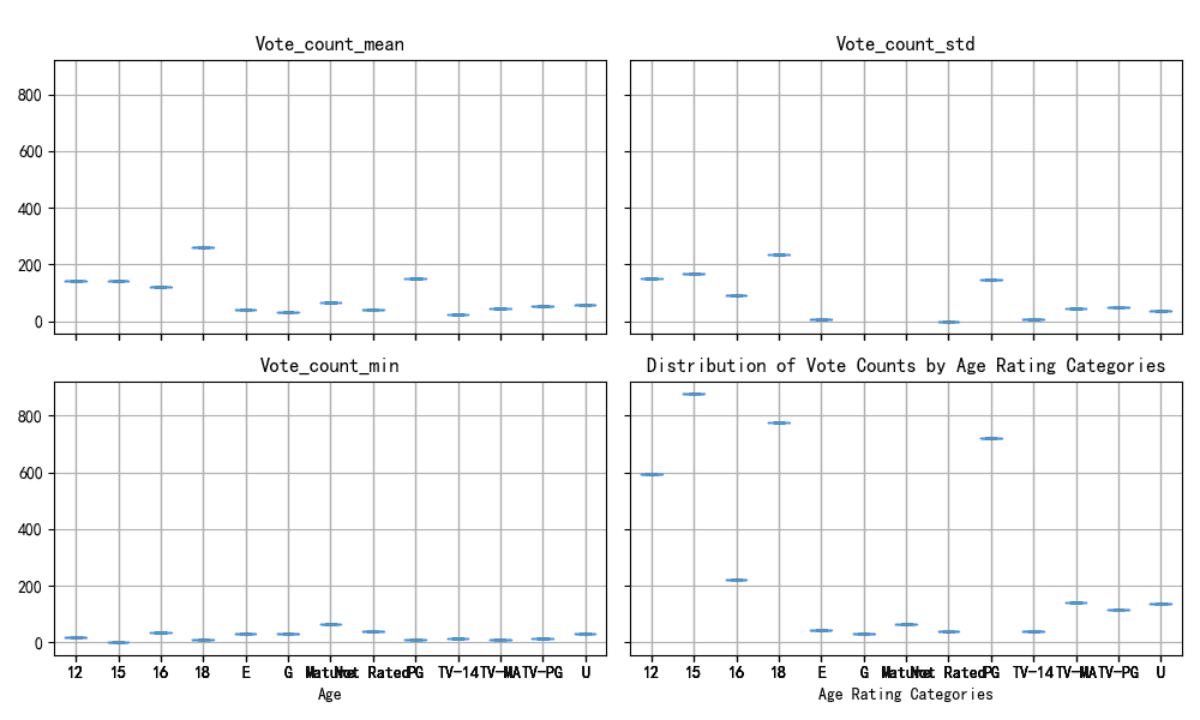
Average Vote Counts: Shows with an '18' age rating have the highest average vote count, around 260.85, which may indicate higher viewer engagement or popularity. In contrast, 'E' rated shows have the lowest average vote count, around 39.67, possibly due to a narrower audience.
Variability in Vote Counts: The standard deviation for vote counts is highest in the '18' category (around 237.04), indicating significant variation in popularity within this category. Other categories also show considerable variability in vote counts.
Range of Vote Counts: The maximum vote count observed is 876 for the '15' category, suggesting particular shows in this category have achieved exceptional popularity. The minimum vote counts across categories are generally low, with some categories having shows with as few as 1 vote.
Try Now
Try Powerdrill AI now, explore more interesting data stories in an effective way!