Data Facts: World Largest Cities by Population 2024

About the dataset
Name:World Largest Cities by Population 2024
Source: Kaggle
AI Data Analysis powered by Powerdrill AI
This dataset provides a comprehensive overview of the population statistics for 800 largest cities in the world, detailing the population estimates for the years 2023 and 2024. Additionally, it includes the calculated growth rate for each city over this period. To understand the dataset better, we use Powerdrill AI to analyze it.
Relevant Inquiries Based on the Dataset
Top Cities by Population in 2024: Which cities have the highest population in 2024?
Country-wise Population Distribution: How is the population distributed among different countries in 2024?
Comparative Population Study: How does the population of cities in 2024 compare to their population in 2023?
Growth Rate Trends: What are the trends in population growth rates across different cities?
Regional Population Insights: Are there specific regions or countries that dominate the list of the largest cities by population?
Population Density: What is the average population size of the cities listed, and how does it vary?
Urbanization Patterns: What insights can be drawn about urbanization trends from the population data of 2024?
Demographic Shifts: Are there any significant demographic shifts indicated by the changes in population from 2023 to 2024?
These inquiries can help in understanding various aspects of urban population dynamics globally.
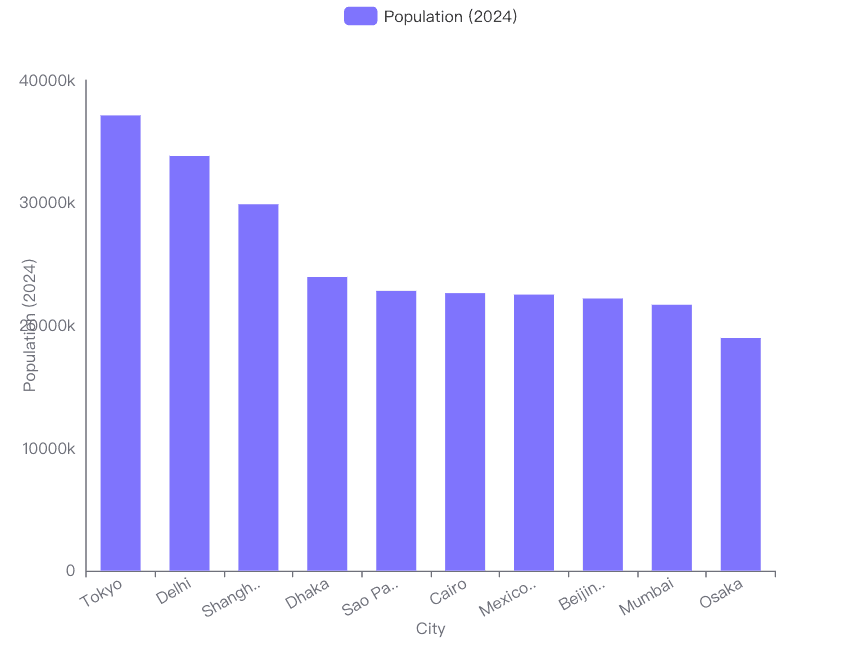
Top Cities by Population in 2024
Based on the analysis of the 'Population (2024)' column from the dataset provided, the cities with the highest populations in 2024 are:
Tokyo, Japan - 37,115,035 people
Delhi, India - 33,807,403 people
Shanghai, China - 29,867,918 people
Dhaka, Bangladesh - 23,935,652 people
Sao Paulo, Brazil - 22,806,704 people
These figures indicate that Tokyo remains the most populated city in 2024, despite a slight decrease in population compared to 2023. Delhi and Shanghai also show significant population sizes with robust growth rates, highlighting their continued urban expansion. Dhaka and Sao Paulo round out the top five, showcasing the prominence of these cities in their respective regions.
Country-wise Population Distribution
Conclusion on Population Distribution by Country in 2024
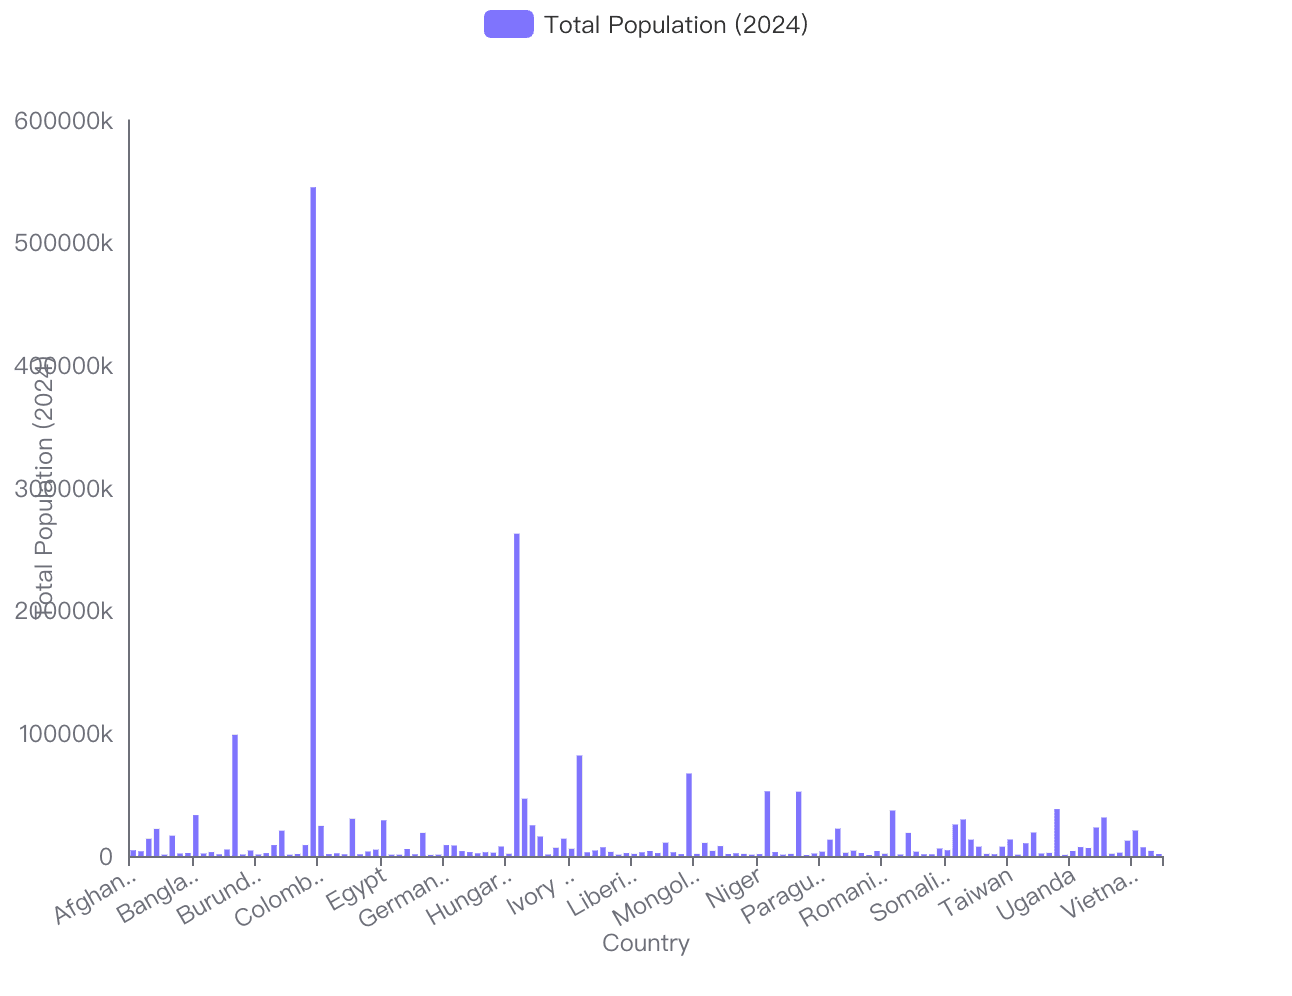
Key Observations from Data and Visualization
Population Range: The population data for 2024 shows a wide range of values across different countries. The mean population is approximately 16,106,940, with a standard deviation of 53,641,495. This indicates a significant variation in population sizes among countries.
Population Extremes:
Minimum Population: The smallest population recorded is 800,636.
Maximum Population: The largest population recorded is 545,170,848.
Visualization Insights:
The bar chart visualizes the population distribution among countries in 2024. It clearly shows that most countries have relatively small populations compared to a few countries with extremely high populations.
The chart highlights a few peaks which represent countries with significantly larger populations compared to others.
Conclusion
The population distribution among countries in 2024 is highly uneven, with a few countries having very large populations while many others have much smaller numbers. This disparity is visually represented in the bar chart, which shows a few high bars among many low ones, indicating countries with large populations stand out significantly among the global population distribution.
Comparative Population Study
Conclusion on Population Changes from 2023 to 2024
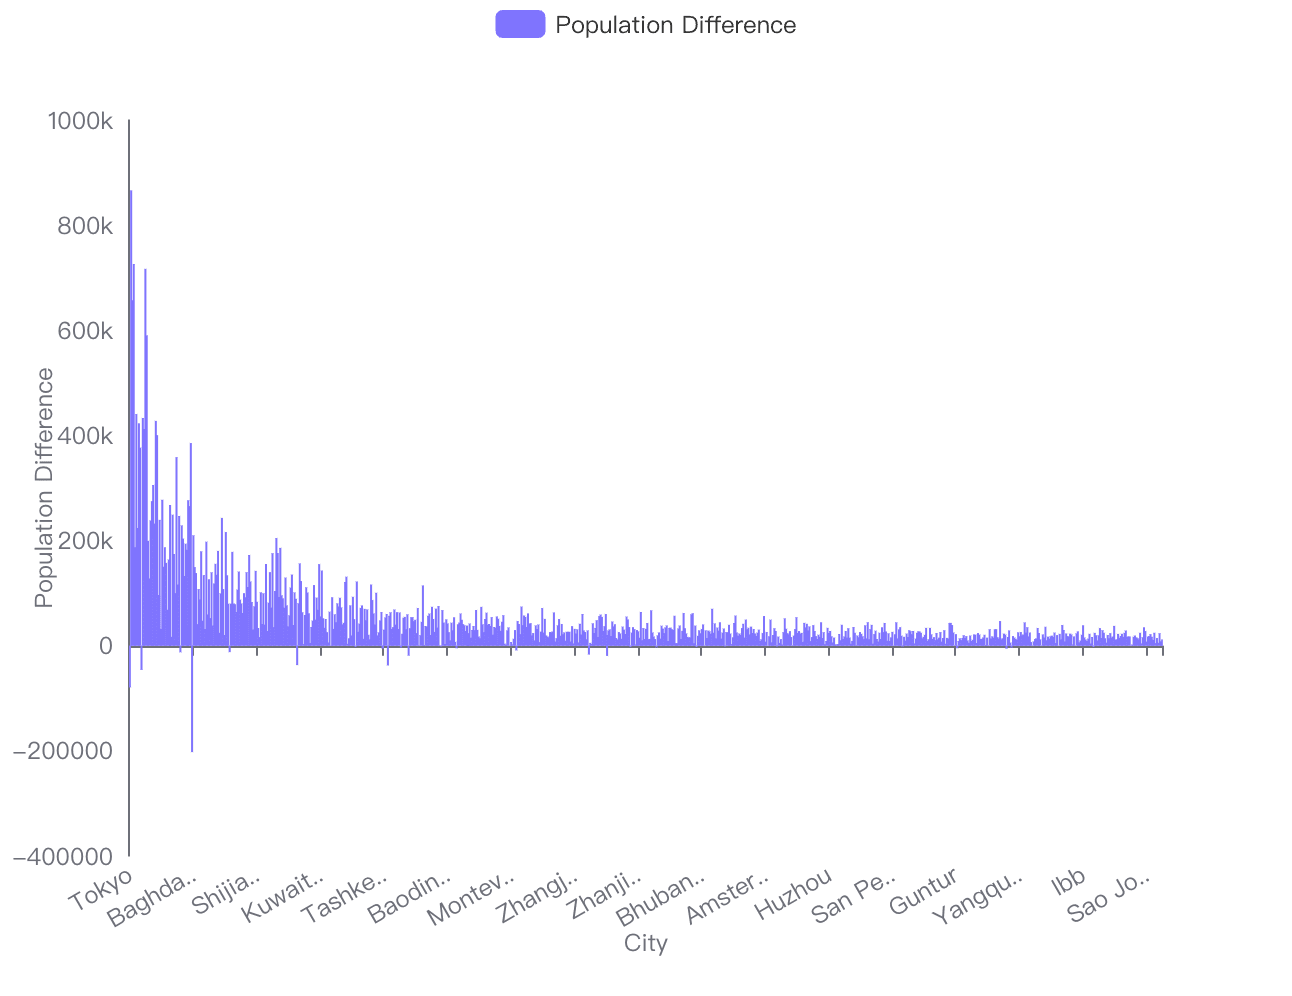
Overview
The analysis focuses on comparing the population of various cities in 2024 to their respective populations in 2023. This comparison helps in understanding the demographic trends and growth patterns across different regions.
Key Findings from Data Analysis
Average Population Growth: The average population difference across the cities is 49,866. This indicates a general trend of population increase.
Variability in Population Change: The standard deviation in population difference is 81,773, suggesting significant variability in how populations are changing across different cities.
Significant Increases and Decreases:
Delhi, India saw the largest increase in population with 866,094 more people in 2024 compared to 2023.
Tokyo, Japan experienced the largest decrease, with a reduction of 79,070 people.
Visual Analysis from Bar Chart
The bar chart visually represents the population changes from 2023 to 2024 for each city.
Positive Changes: Most cities show a positive bar indicating an increase in population.
Negative Changes: A few cities, like Tokyo, display a negative bar, indicating a decrease in population.
High Variance: The chart highlights the high variance in population changes, with some cities experiencing significant increases while others face decreases.
Conclusion
The population of most cities is increasing from 2023 to 2024, with notable exceptions where some cities are experiencing declines. The data and visual representation together provide a comprehensive overview of the demographic shifts occurring across these cities, reflecting various socio-economic factors influencing these changes.
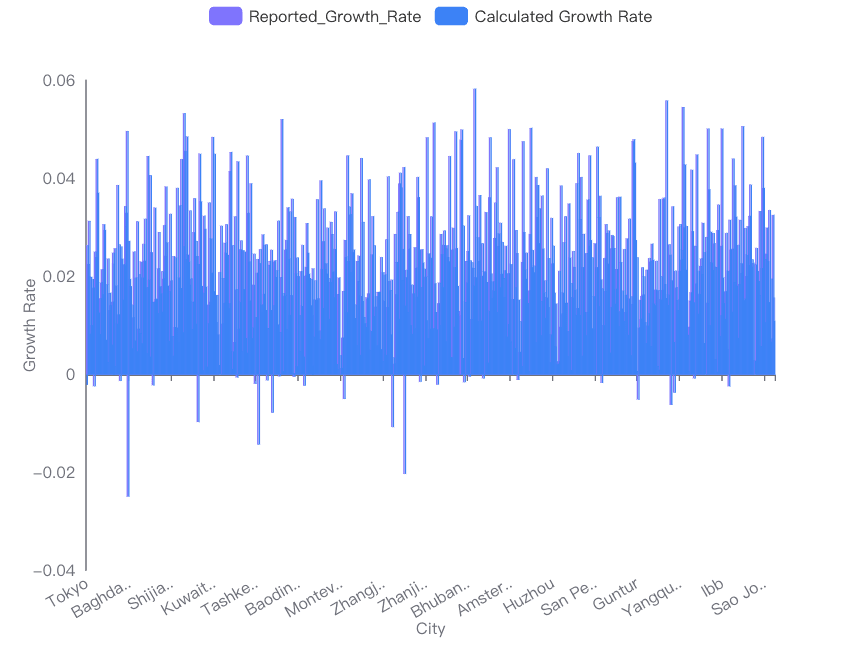
Growth Rate Trends
Conclusion on Trends in Population Growth Rates Across Different Cities
Key Observations from Data Analysis:
Mean Growth Rate: The mean growth rate across different cities is 0.0200513.
Standard Deviation: The standard deviation of the growth rates is 0.0121801, indicating a moderate variability in growth rates among the cities.
Implications:
Policy and Planning: Understanding these trends is crucial for urban planning and resource allocation. Cities with higher growth rates may need more infrastructure and services to accommodate growing populations.
Economic Impact: Cities with higher growth rates might experience more dynamic economic development, attracting more businesses and investments.
Recommendations:
Further Research: It would be beneficial to investigate the factors contributing to the higher growth rates in some cities, such as economic policies, geographic location, or quality of life.
Targeted Development: Policymakers should consider tailored development strategies for cities based on their specific growth rate categories to maximize efficiency and effectiveness in urban development.
By analyzing the growth rate trends, stakeholders can make informed decisions to foster sustainable development and improve the quality of life in urban areas.
Regional Population Insights
Dominant Countries in the List of Largest Cities by Population
China and India are the two countries that dominate the list of the largest cities by population. Here are the key findings based on the analysis of the 'Country' column from the dataset:
China leads with a significant margin, having 225 cities listed among the largest by population.
India follows with 84 cities making it to the list, which is significantly higher than other countries but still less than three times the number China has.
Other notable mentions include Brazil and Mexico, each with 28 cities listed.
Nigeria also shows a considerable number of large cities, with 23 cities included in the list.
Summary: The data clearly shows that China and India are the most prominent countries in terms of the number of large cities. This dominance can be attributed to their large populations and rapid urbanization.
Population Density
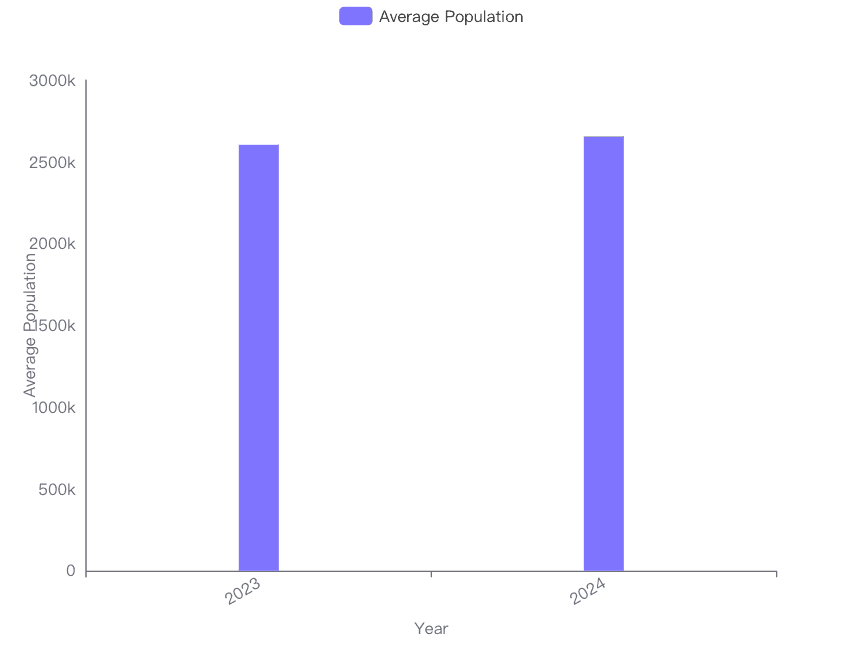
Conclusion on Average Population Size Variation (2023-2024)
Key Information:
2023 Average Population: 2,604,461
2024 Average Population: 2,654,327
Analysis:
Increase in Population: There is an increase in the average population size from the year 2023 to 2024.
Percentage Increase: The average population has increased by approximately 1.91%.
Visual Representation:
The provided bar chart visually represents the increase in average population size from 2023 to 2024. The height of the bar for 2024 is visibly higher than that for 2023, indicating a growth in population.
Summary:
The data and visual analysis indicate a growth in the average population size of the cities listed from the year 2023 to 2024, with an approximate increase of 1.91%. This suggests a moderate growth trend in the population of these cities over the specified period.
Urbanization Patterns
Insights on Urbanization Trends from 2024 Population Data
1. Population Distribution
The population distribution data indicates a significant variance in city populations. The mean population is approximately 2.65 million, but the standard deviation is quite high at about 3.72 million, suggesting a wide disparity in city sizes.
The minimum city population is 750,036, while the maximum reaches up to 37,115,035, highlighting extreme differences in urban scales.
2. Growth Rates
The growth rate data reveals that cities are experiencing varying rates of population change. The mean growth rate is 0.02, but it ranges from a decrease of 0.02 to an increase of 0.06.
Notably, cities like Tokyo and Sao Paulo show minimal growth or slight declines, whereas cities like Delhi and Dhaka exhibit higher growth rates, indicating more rapid urbanization.
3. Top 10 Largest Cities
The largest cities in 2024 are predominantly in Asia and include Tokyo, Delhi, and Shanghai, with populations exceeding 20 million. This suggests that urbanization trends are particularly strong in Asia.
The presence of cities like Cairo and Mexico City in the top 10 list also points to significant urban growth in other regions such as Africa and Latin America.
4. Visual Analysis
Histograms and bar charts visually underscore the concentration of very large populations in a few cities, while many others remain significantly smaller.
The bar chart of growth rates illustrates that while some cities are shrinking slightly, others are growing at a faster pace, which may be driven by factors like economic opportunities, migration, and regional development policies.
Conclusion
The population data from 2024 provides a clear picture of ongoing urbanization trends, with significant growth concentrated in certain cities, especially in developing regions. The wide range of city sizes and growth rates indicates diverse urban development paths, which could have implications for regional planning, infrastructure development, and resource allocation. These trends underscore the importance of tailored urban policies to manage the challenges and opportunities of urban growth effectively.
Demographic Shifts
Ultimate Conclusion: Significant Demographic Shifts from 2023 to 2024
Cities with the Most Significant Population Increase
Delhi, India
Population Increase: 866,094
Population in 2023: 32,941,309
Population in 2024: 33,807,403
Observation: Delhi experienced the highest population increase among the cities analyzed, indicating a strong demographic growth.
Shanghai, China
Population Increase: 657,110
Population in 2023: 29,210,808
Population in 2024: 29,867,918
Observation: Shanghai also showed a significant increase, reinforcing its status as a major urban center in China.
Dhaka, Bangladesh
Population Increase: 726,036
Population in 2023: 23,209,616
Population in 2024: 23,935,652
Observation: Dhaka's substantial population growth reflects ongoing urbanization trends in Bangladesh.
Cities with the Most Significant Population Decrease
Tokyo, Japan
Population Decrease: -79,070
Population in 2023: 37,194,105
Population in 2024: 37,115,035
Observation: Tokyo experienced a population decrease, possibly due to factors like aging demographics or economic shifts.
New York, United States
Population Decrease: -202,375
Population in 2023: 8,133,522
Population in 2024: 7,931,147
Observation: New York saw the most significant population decrease, which could be influenced by migration patterns or changes in housing affordability.
Overall Insights
Growth Trends: The cities with the largest increases are primarily in Asia, highlighting the region's dynamic demographic changes.
Decline Trends: Cities experiencing population declines are in developed countries, possibly reflecting broader socio-economic trends such as urban to suburban migration or lower birth rates.
Implications for Urban Planning: These shifts necessitate adjustments in urban planning and resource allocation to accommodate growing populations or manage shrinking ones effectively.
Conclusion: The data reveals critical insights into global demographic trends, with significant increases in Asian cities and notable decreases in some major Western cities. These trends have profound implications for urban development, economic strategies, and social services.
Try Now
Try Powerdrill AI now, explore more interesting data stories in an effective way!