Powerdrill AI: a Complete Guide + Common Use Cases

Artificial Intelligence (AI) is revolutionizing how we understand and use data. It's not just about crunching numbers—it's about making things simpler, more accurate, and giving us quick insights that help businesses stay ahead of the curve.
That’s where Powerdrill AI comes in. It's a powerful tool that takes the complexity out of data analysis. With Powerdrill AI, anyone can build AI-powered knowledge bases without needing any coding skills. Just connect your data sources, ask a question, and let the AI do the rest—providing you with clear, precise answers in no time.
In this guide, we’ll explore the key features of Powerdrill AI, how to make the most of it, and what makes it stand out from the competition.
Ready to dive in? Let’s get started!
How to use Powerdrill AI
1. Sign up with Powerdrill AI
Before you start your journey on Powerdrill, you need to first sign up to Powerdrill.

If you already have a Google, LinkedIn, or GitHub account, you can sign up with just a few clicks! Or, if you prefer, simply enter your email address, and we’ll send you a verification code to get started.
2. User interface overview
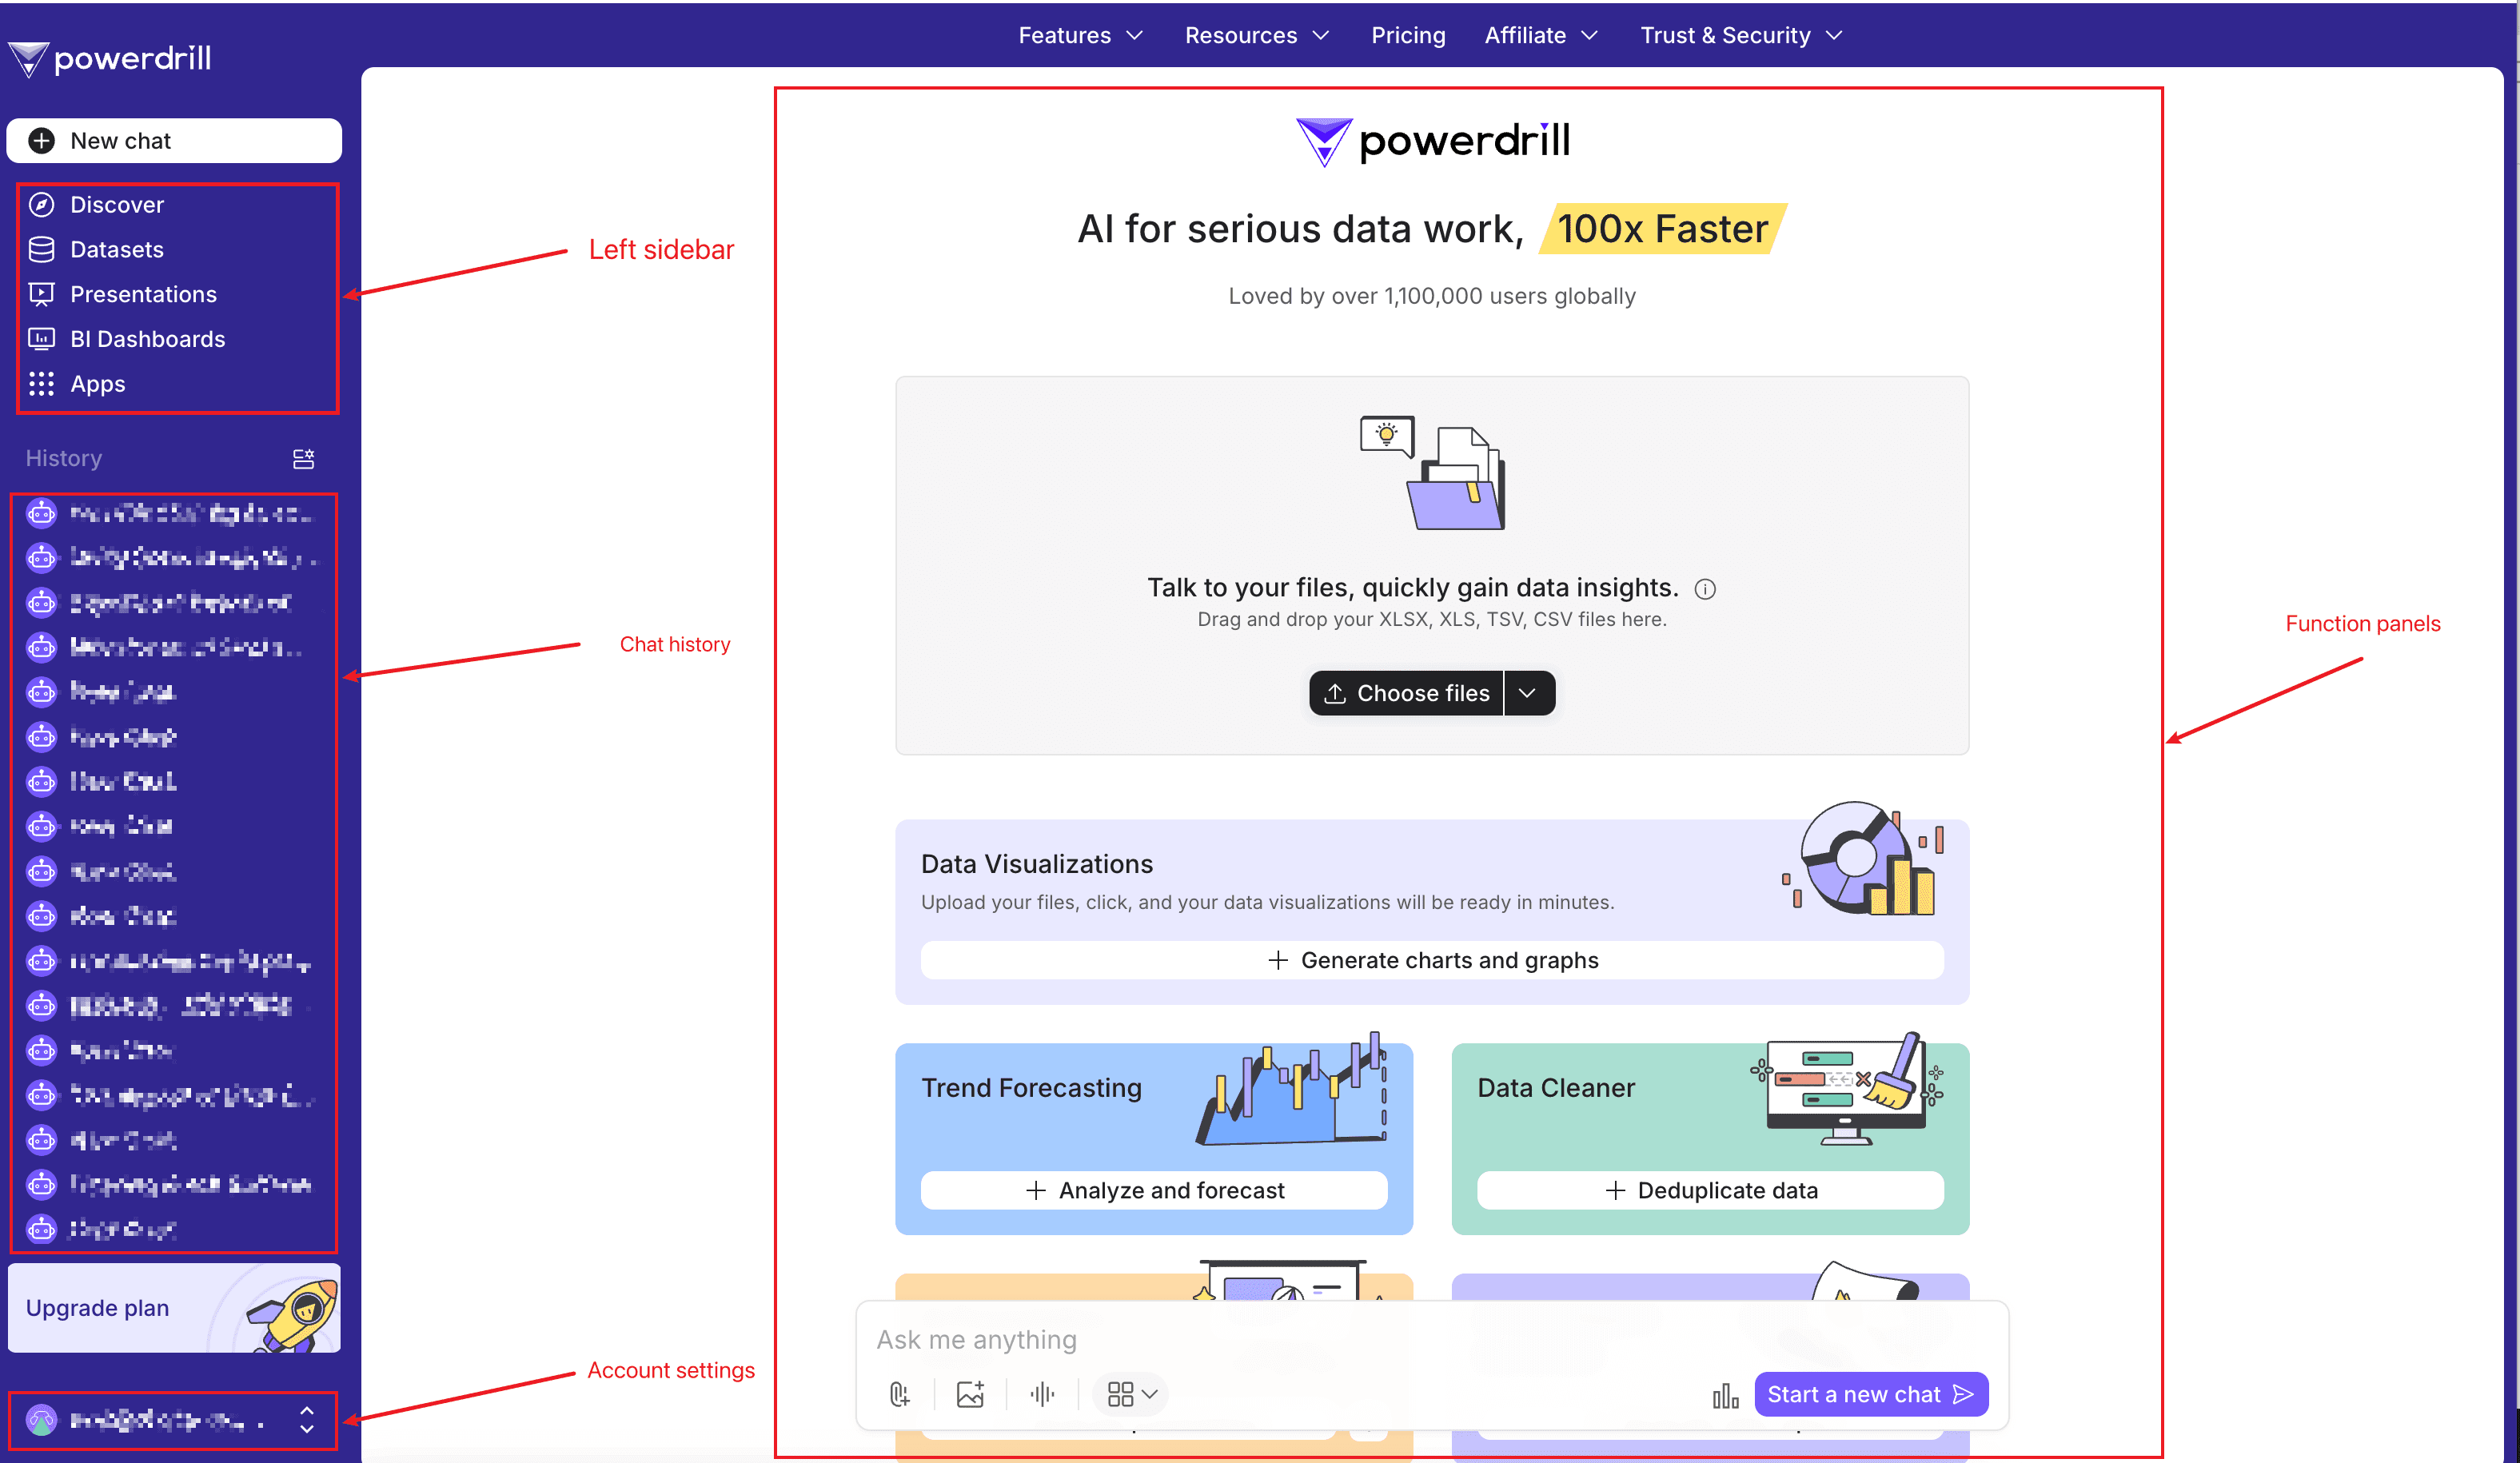
Once you're logged in, you’ll land on the main dashboard. Let’s take a quick tour of the key sections:
Left Sidebar: Easily navigate to the features and tools you need.
Chat History: View your most recent chat sessions at a glance.
Function Panels: Explore the AI tools offered by Powerdrill and start your data journey.
Account Settings: Personalize your account settings and preferences.
3. Start analyzing your data
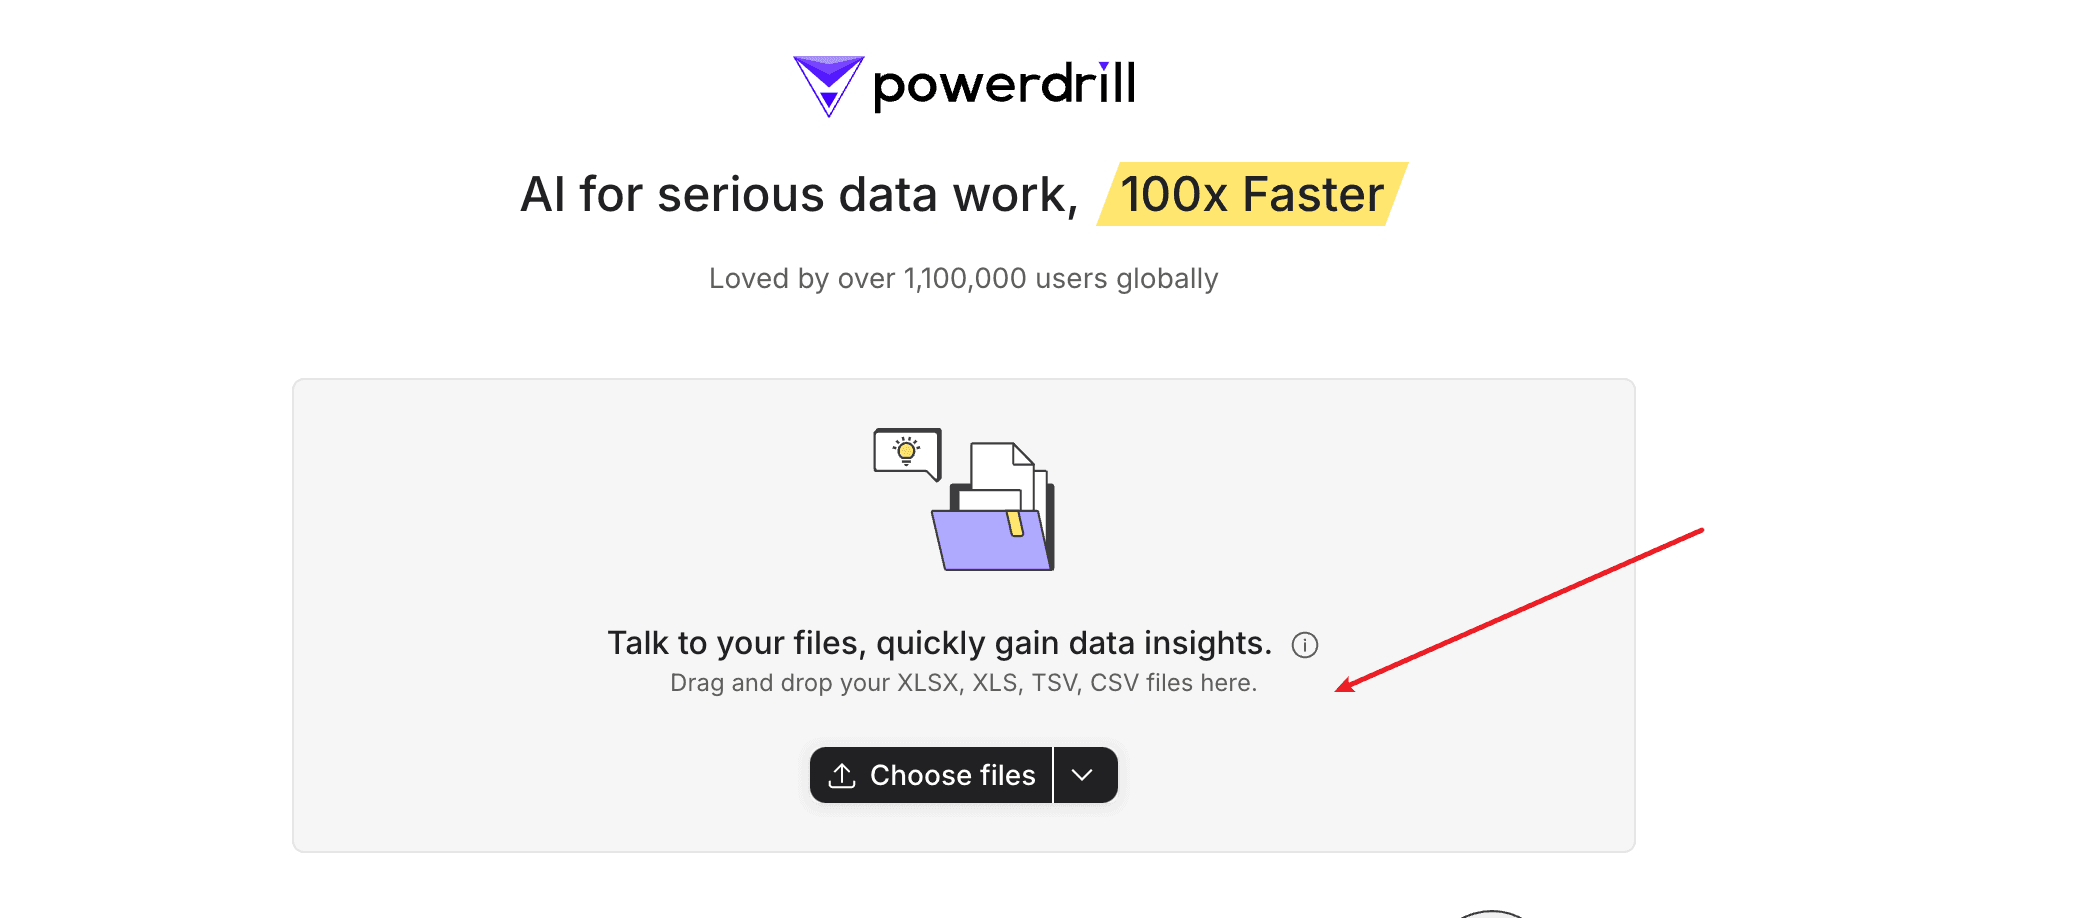
First, click the Choose files button, and select the files you want to analyze. Alternatively, you can drag and drop your files into the drop zone.
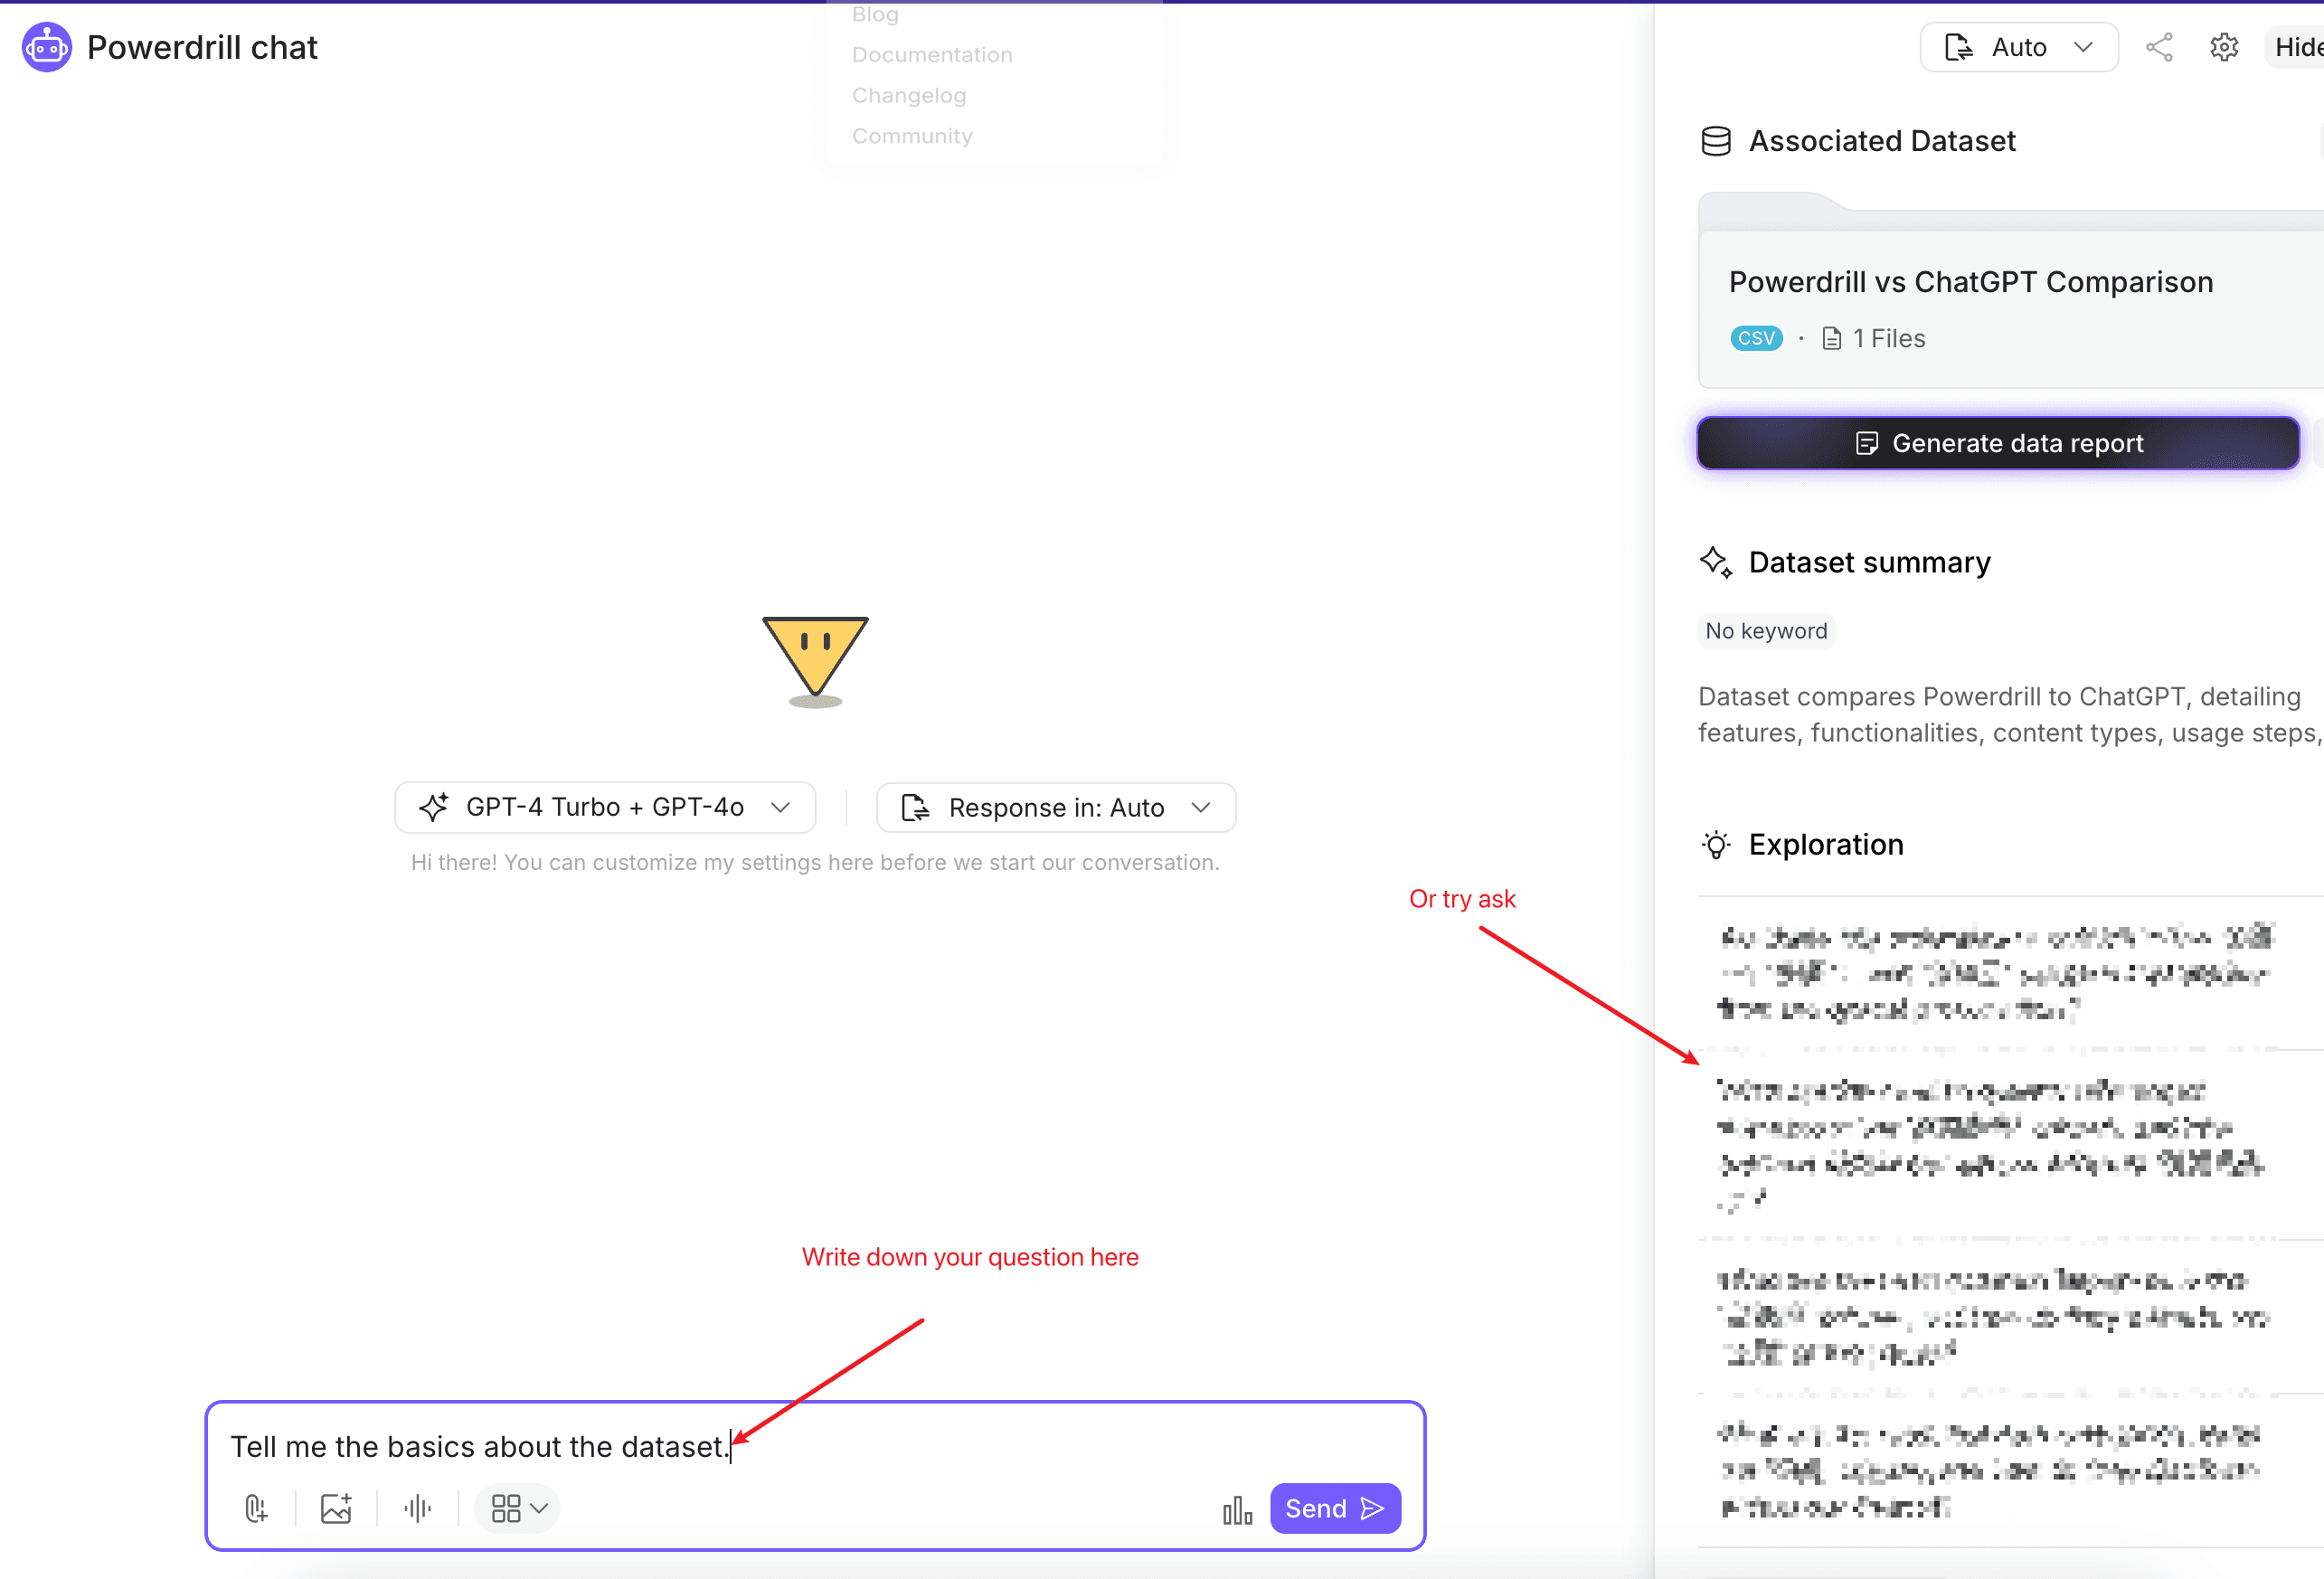
Then, ask your questions about the files. Alternatively, you can try the suggested questions on the Exploration section.
Next, let's go through the common use cases of Powerdrill.
Common use cases
After your files are uploaded, you can start exploring the following use cases.
Understand your files
Make visualizations
Create presentations
Process your spreadsheets
Create data reports
In this chapter, we’ll be using the demo dataset called "Billionaires Statistics" as our example. This dataset is accessible to everyone using Powerdrill, so feel free to follow along!
1. Understand your files
If your file is large, packed with lots of information, or you're just not very familiar with its content, you can ask the AI anything you'd like to know!
For example, you could ask:
"Who are the top 5 richest billionaires according to the latest rankings, and what industries are they associated with?"

As you can see, it not only shows the top 5 richest billionaires but also highlights that technology is a major industry among them, with Jeff Bezos and Larry Ellison representing this sector.
Let's try another question:
"Which cities globally house the most billionaires, and what industries primarily thrive in these locations?"
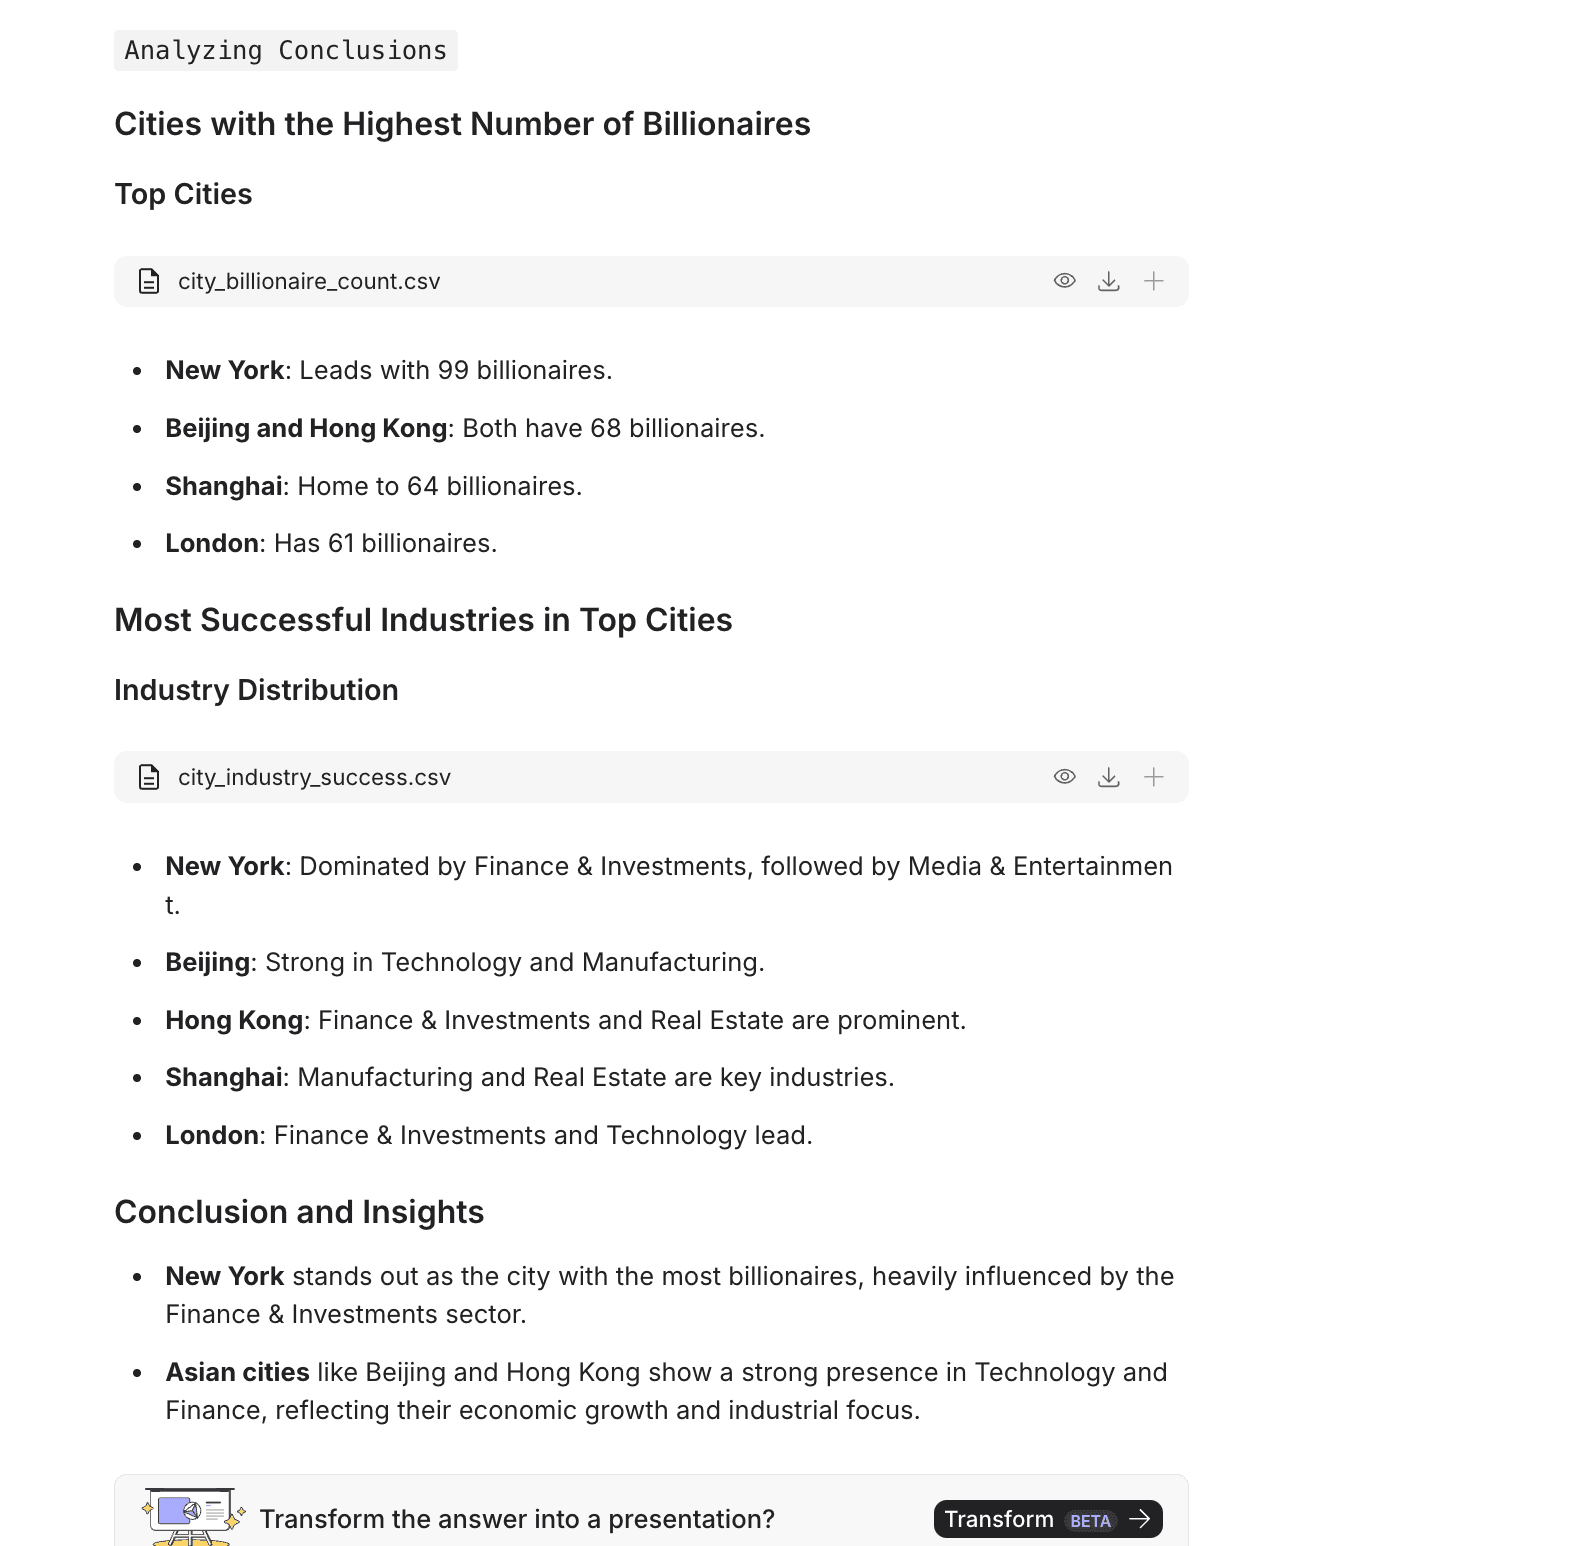
From the answer, we can see that the top cities with the highest number of billionaires are New York, Beijing, Hong Kong, Shanghai, and London.
In addition to the answer, Powerdrill provides a spreadsheet called "city_billionaire_count," which you can download if needed.
Plus, it offers some extra insights:
New York stands out as the city with the most billionaires, largely due to its strong Finance & Investments sector.
Beijing and Hong Kong show a solid presence in Technology and Finance, reflecting their rapid economic growth and industrial focus in recent years.
2. Make visualizations
Powerdrill is an amazing AI-powered tool for creating graphs in just a few minutes. Whether you're a data analyst or a data steward, making visualizations is a breeze—no special skills needed, as long as you know what questions to ask!
For example, we can build on our previous query by asking:
"Visualize the distribution of billionaires by city."
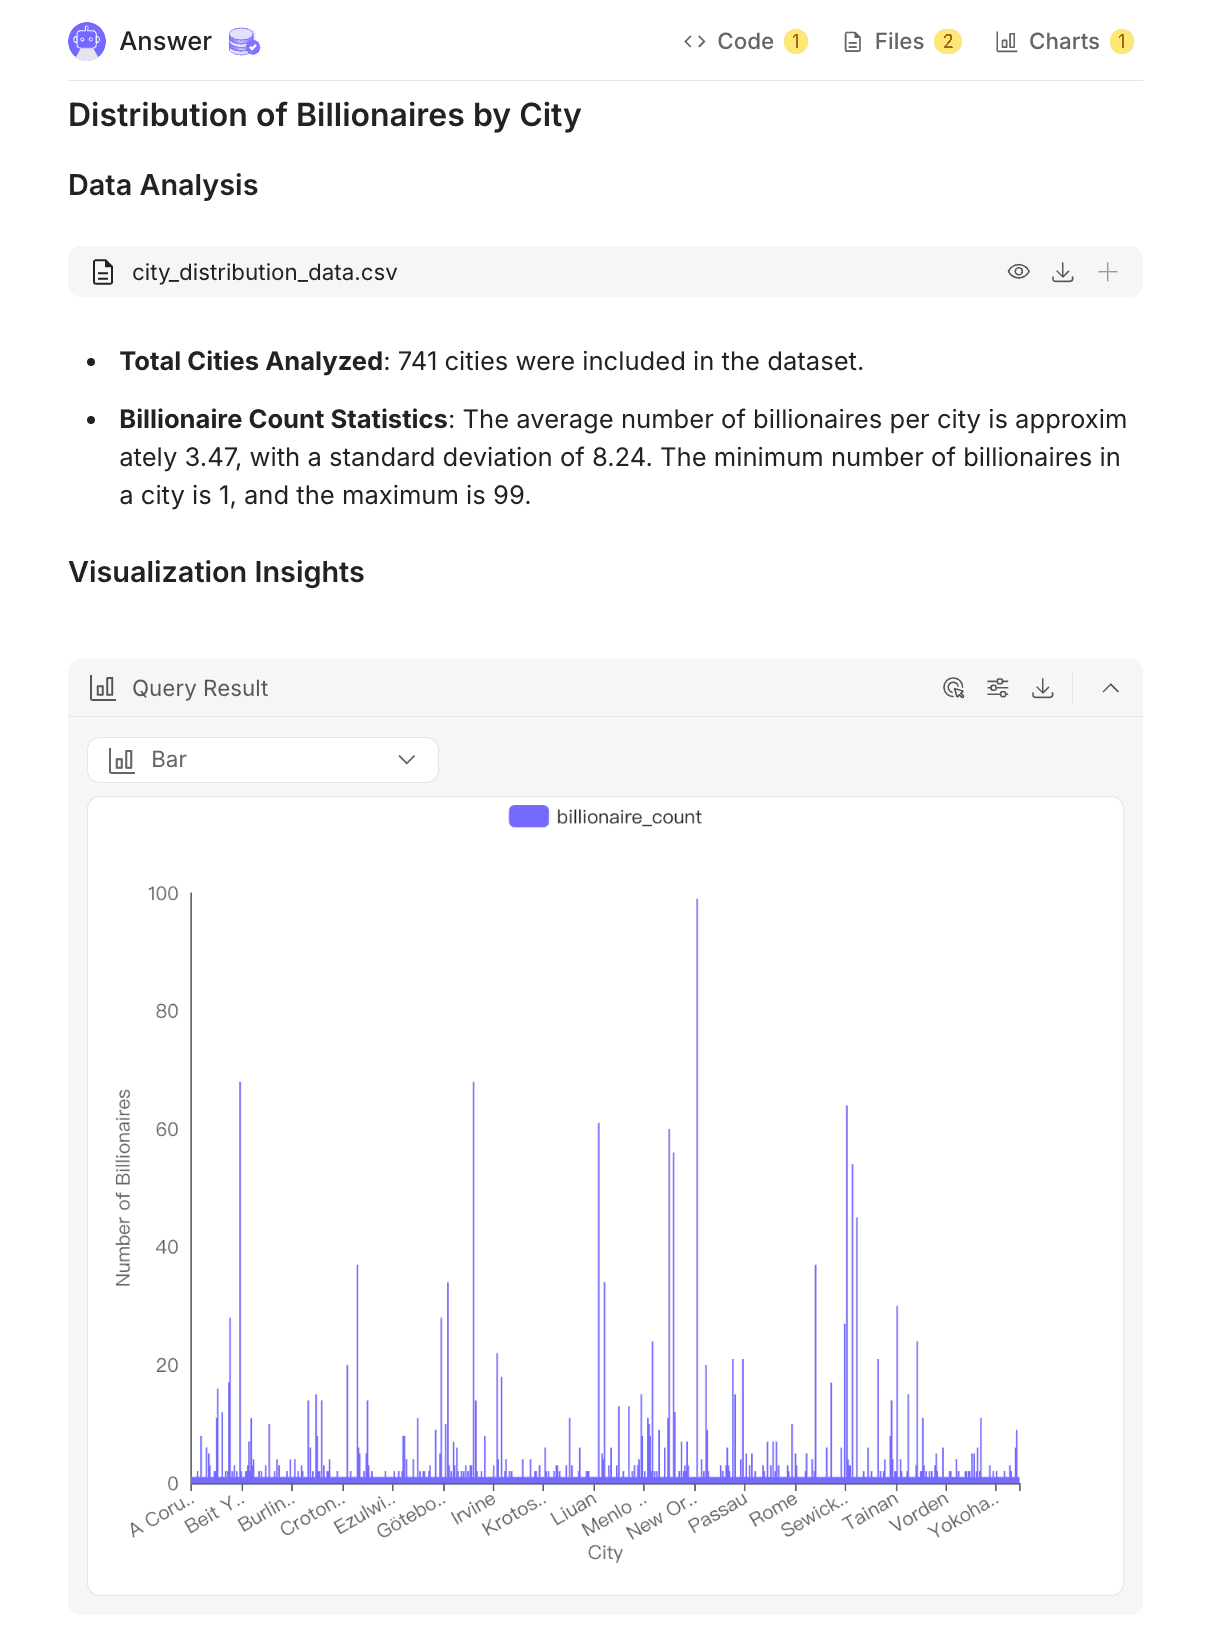
The generated bar chart can be customized to fit your needs, and along with the chart, Powerdrill provides explanations to help you interpret the data.
Let's try something more complex:
"Show the spread of billionaire wealth by country, highlighting the median, quartiles, and outliers."
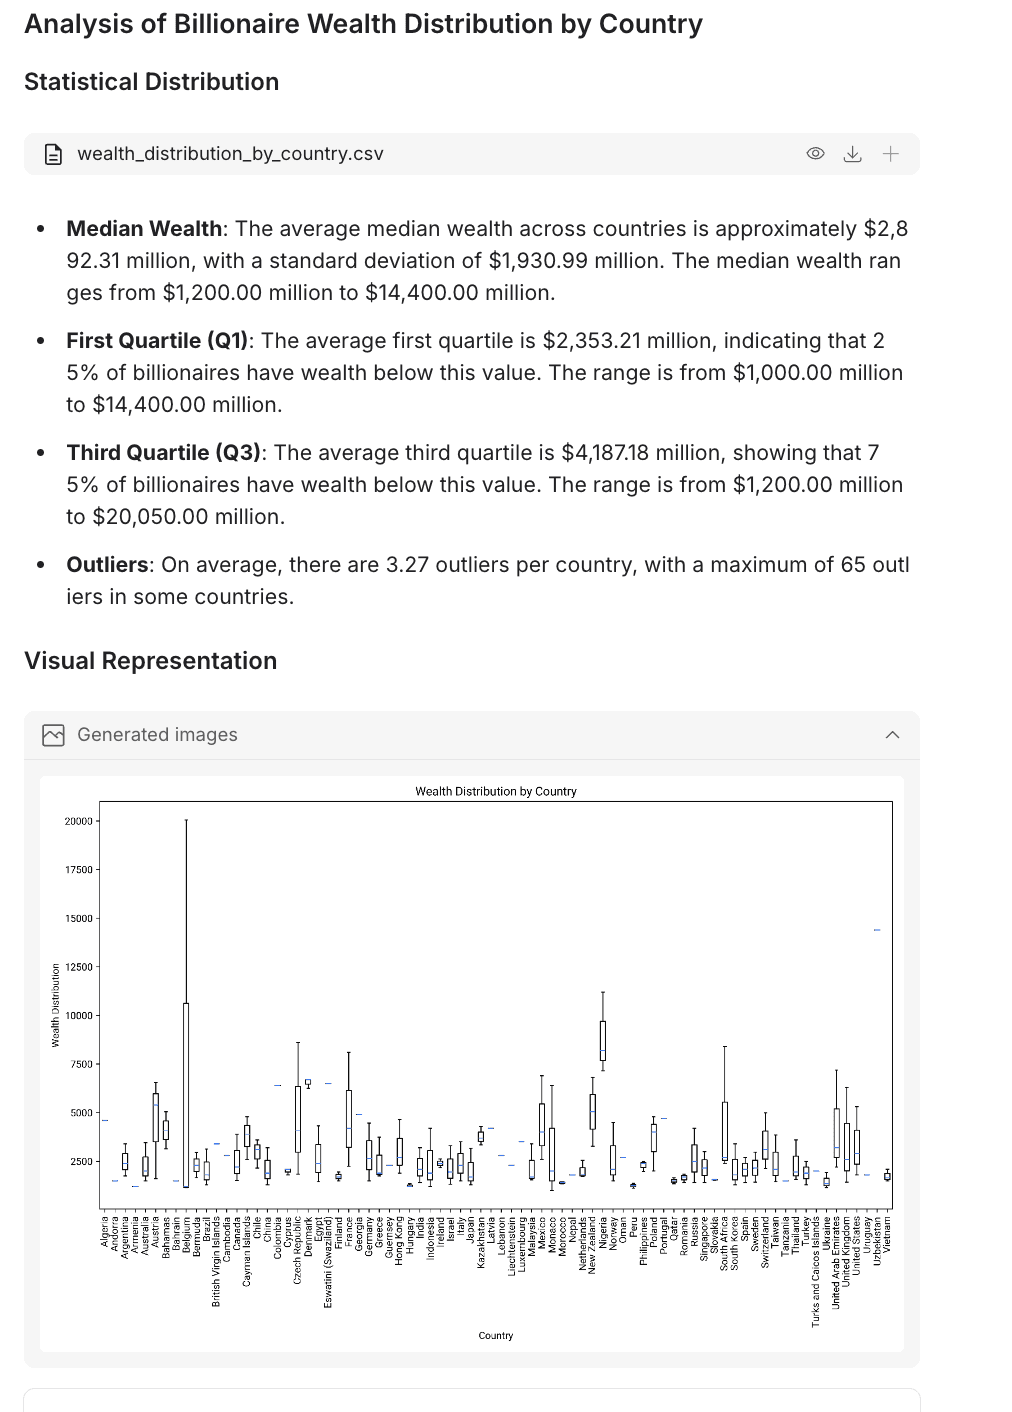
In this example, Powerdrill not only displays the quartiles and outliers but also provides detailed insights:
Median Wealth: The average median wealth across countries is approximately $2,892.31 million, with a standard deviation of $1,930.99 million. The median wealth ranges from $1,200.00 million to $14,400.00 million.
First Quartile (Q1): The average first quartile is $2,353.21 million, indicating that 25% of billionaires have wealth below this value. The range is from $1,000.00 million to $14,400.00 million.
Third Quartile (Q3): The average third quartile is $4,187.18 million, showing that 75% of billionaires have wealth below this value. The range is from $1,200.00 million to $20,050.00 million.
Outliers: On average, there are 3.27 outliers per country, with a maximum of 65 outliers in some countries.
Then, it gives a box plot to analyze wealth distribution by country.
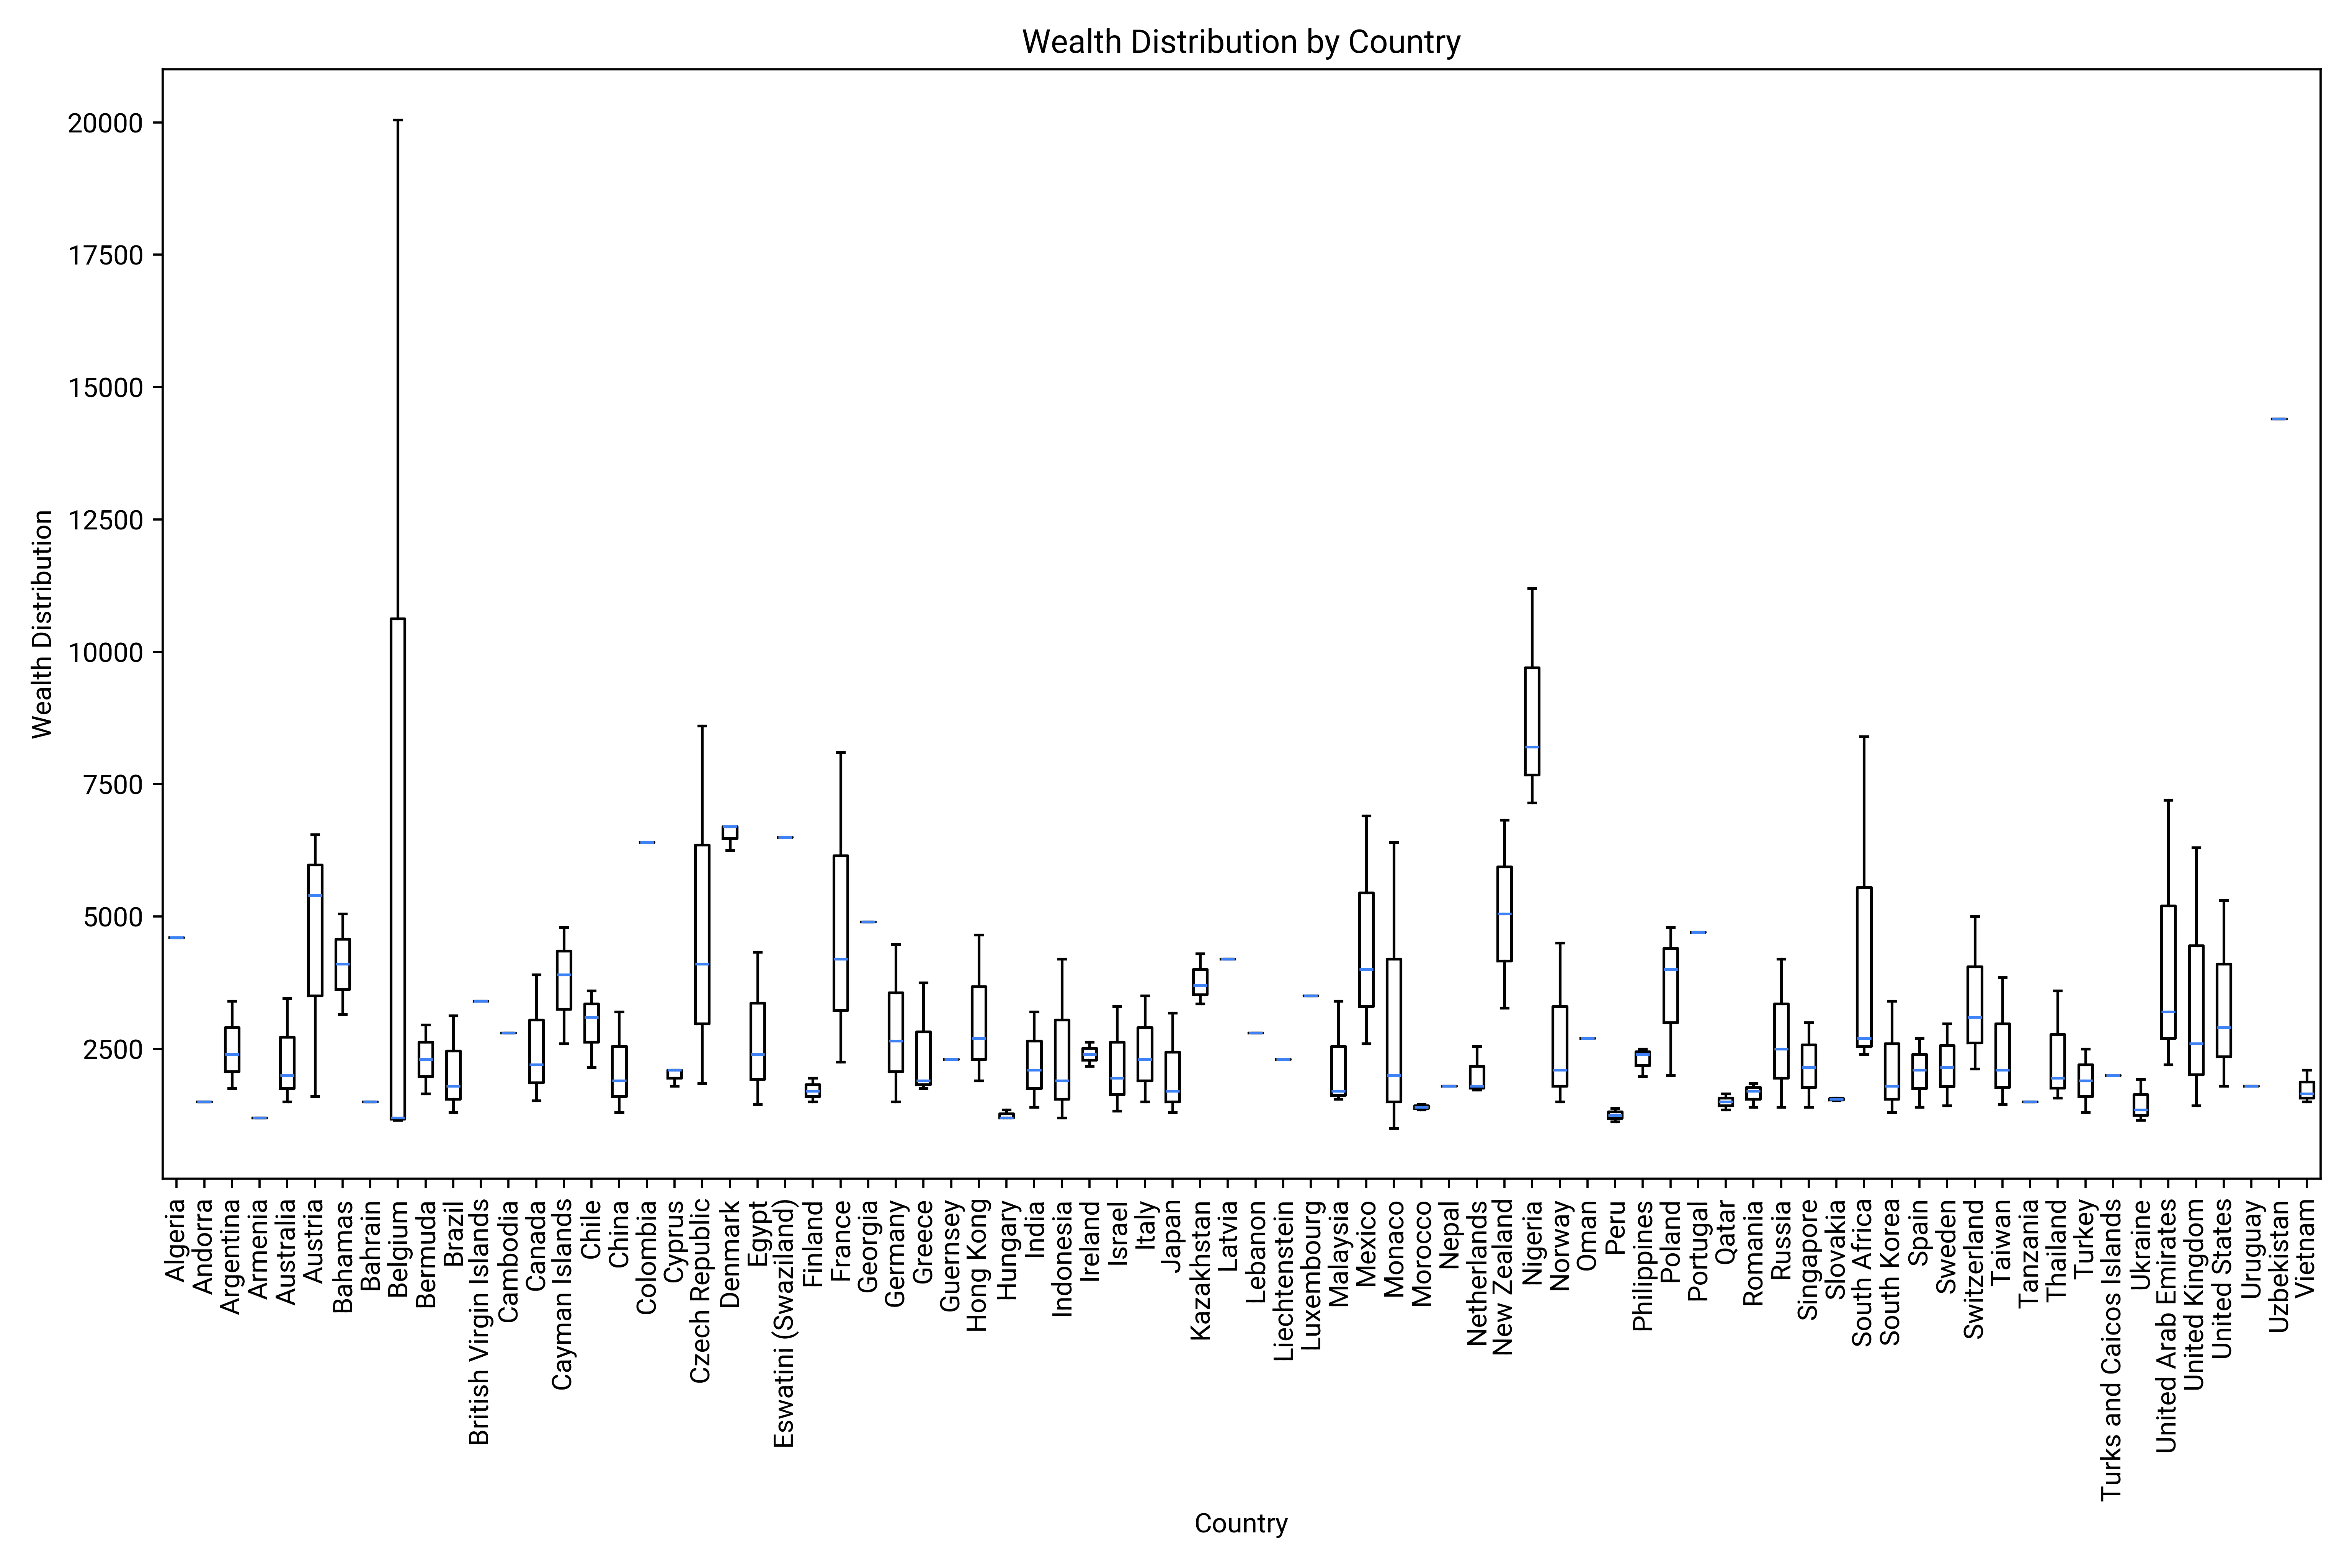
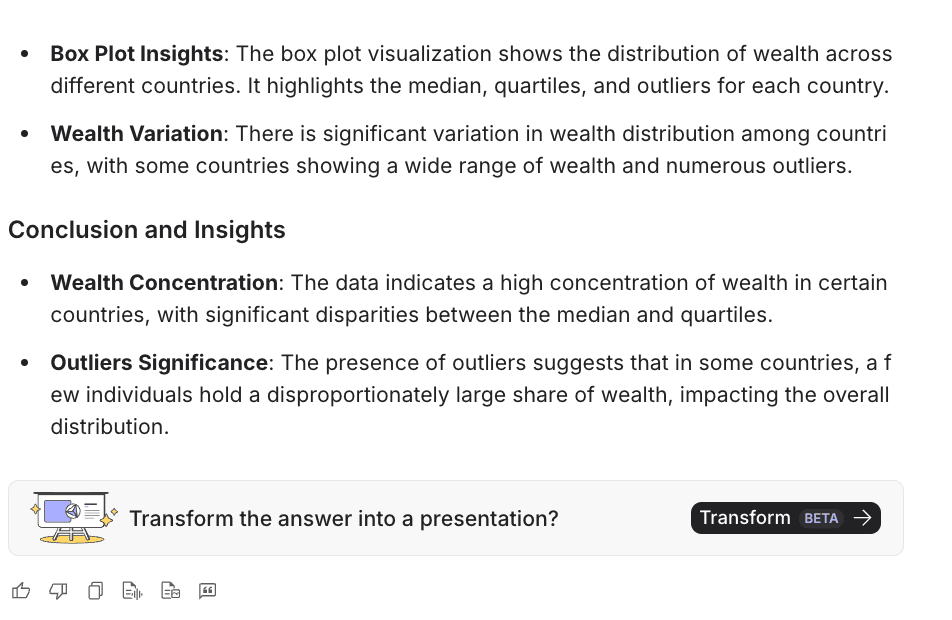
Box Plot Insights: The box plot visualization shows the distribution of wealth across different countries. It highlights the median, quartiles, and outliers for each country.
Wealth Variation: There is significant variation in wealth distribution among countries, with some countries showing a wide range of wealth and numerous outliers.
3. Process your spreadsheets
Powerdrill makes it easy to work with your CSV, TSV, and Excel files.
Once your files are uploaded, you can ask Powerdrill to handle various tasks for you:
To merge files, simply ask: "Merge the files into one."
To analyze spreadsheets with multiple tabs, check out the guide: How to Use Powerdrill AI to Analyze Spreadsheets with Multiple Tabs.
To remove duplicates, try the Data Cleaner AI agent—another powerful feature offered by Powerdrill. You can find it right on the homepage.

Click Deduplicate data, then upload your file and click Run.
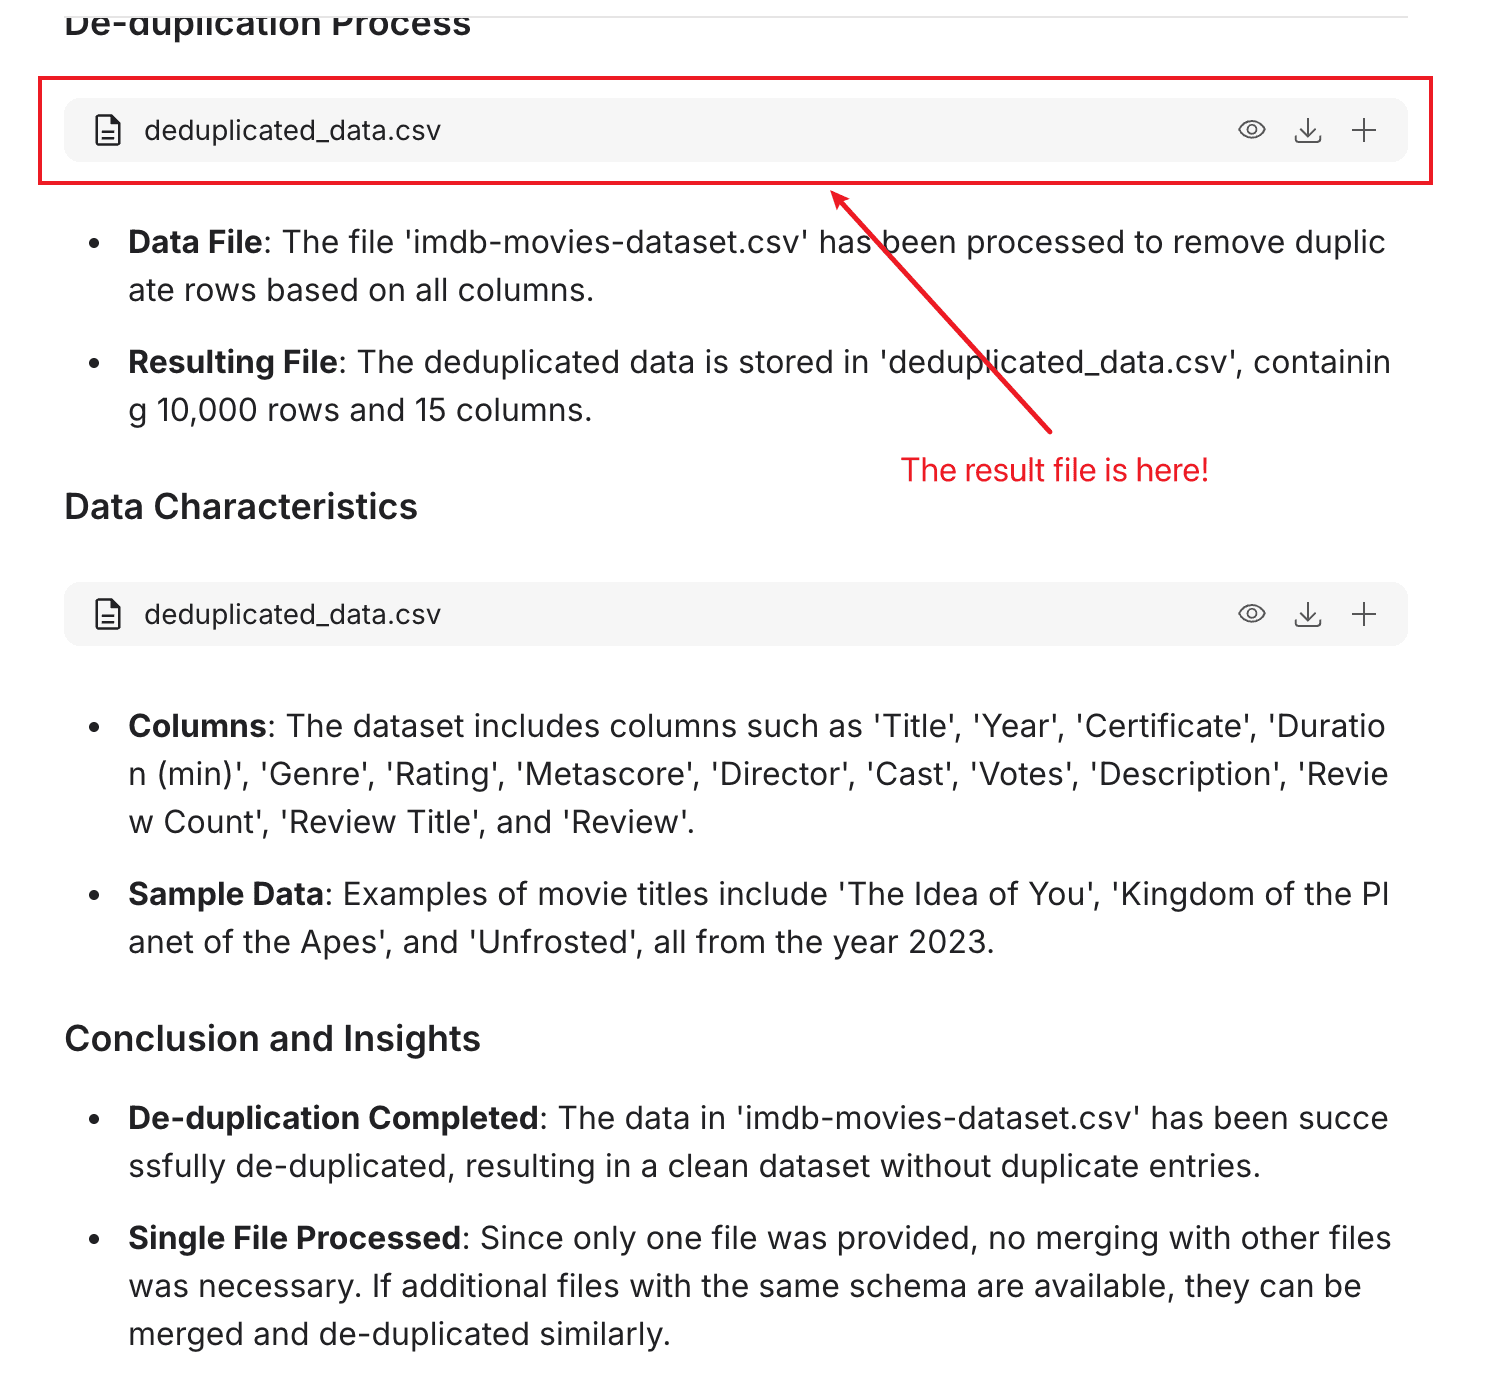
In addition to the deduplicated file, Powerdrill also provides a detailed report on the cleanup process, so you can easily see what’s been removed. It’s all about making data management simple and transparent!
4. Create data reports
Powerdrill can transform your raw data into a beautiful and insightful data report with just one click!
For example, check out this sample data report:
Data Facts: IMDB Top 250 TV Shows
Read the full report here.
Let's walk through it step-by-step:
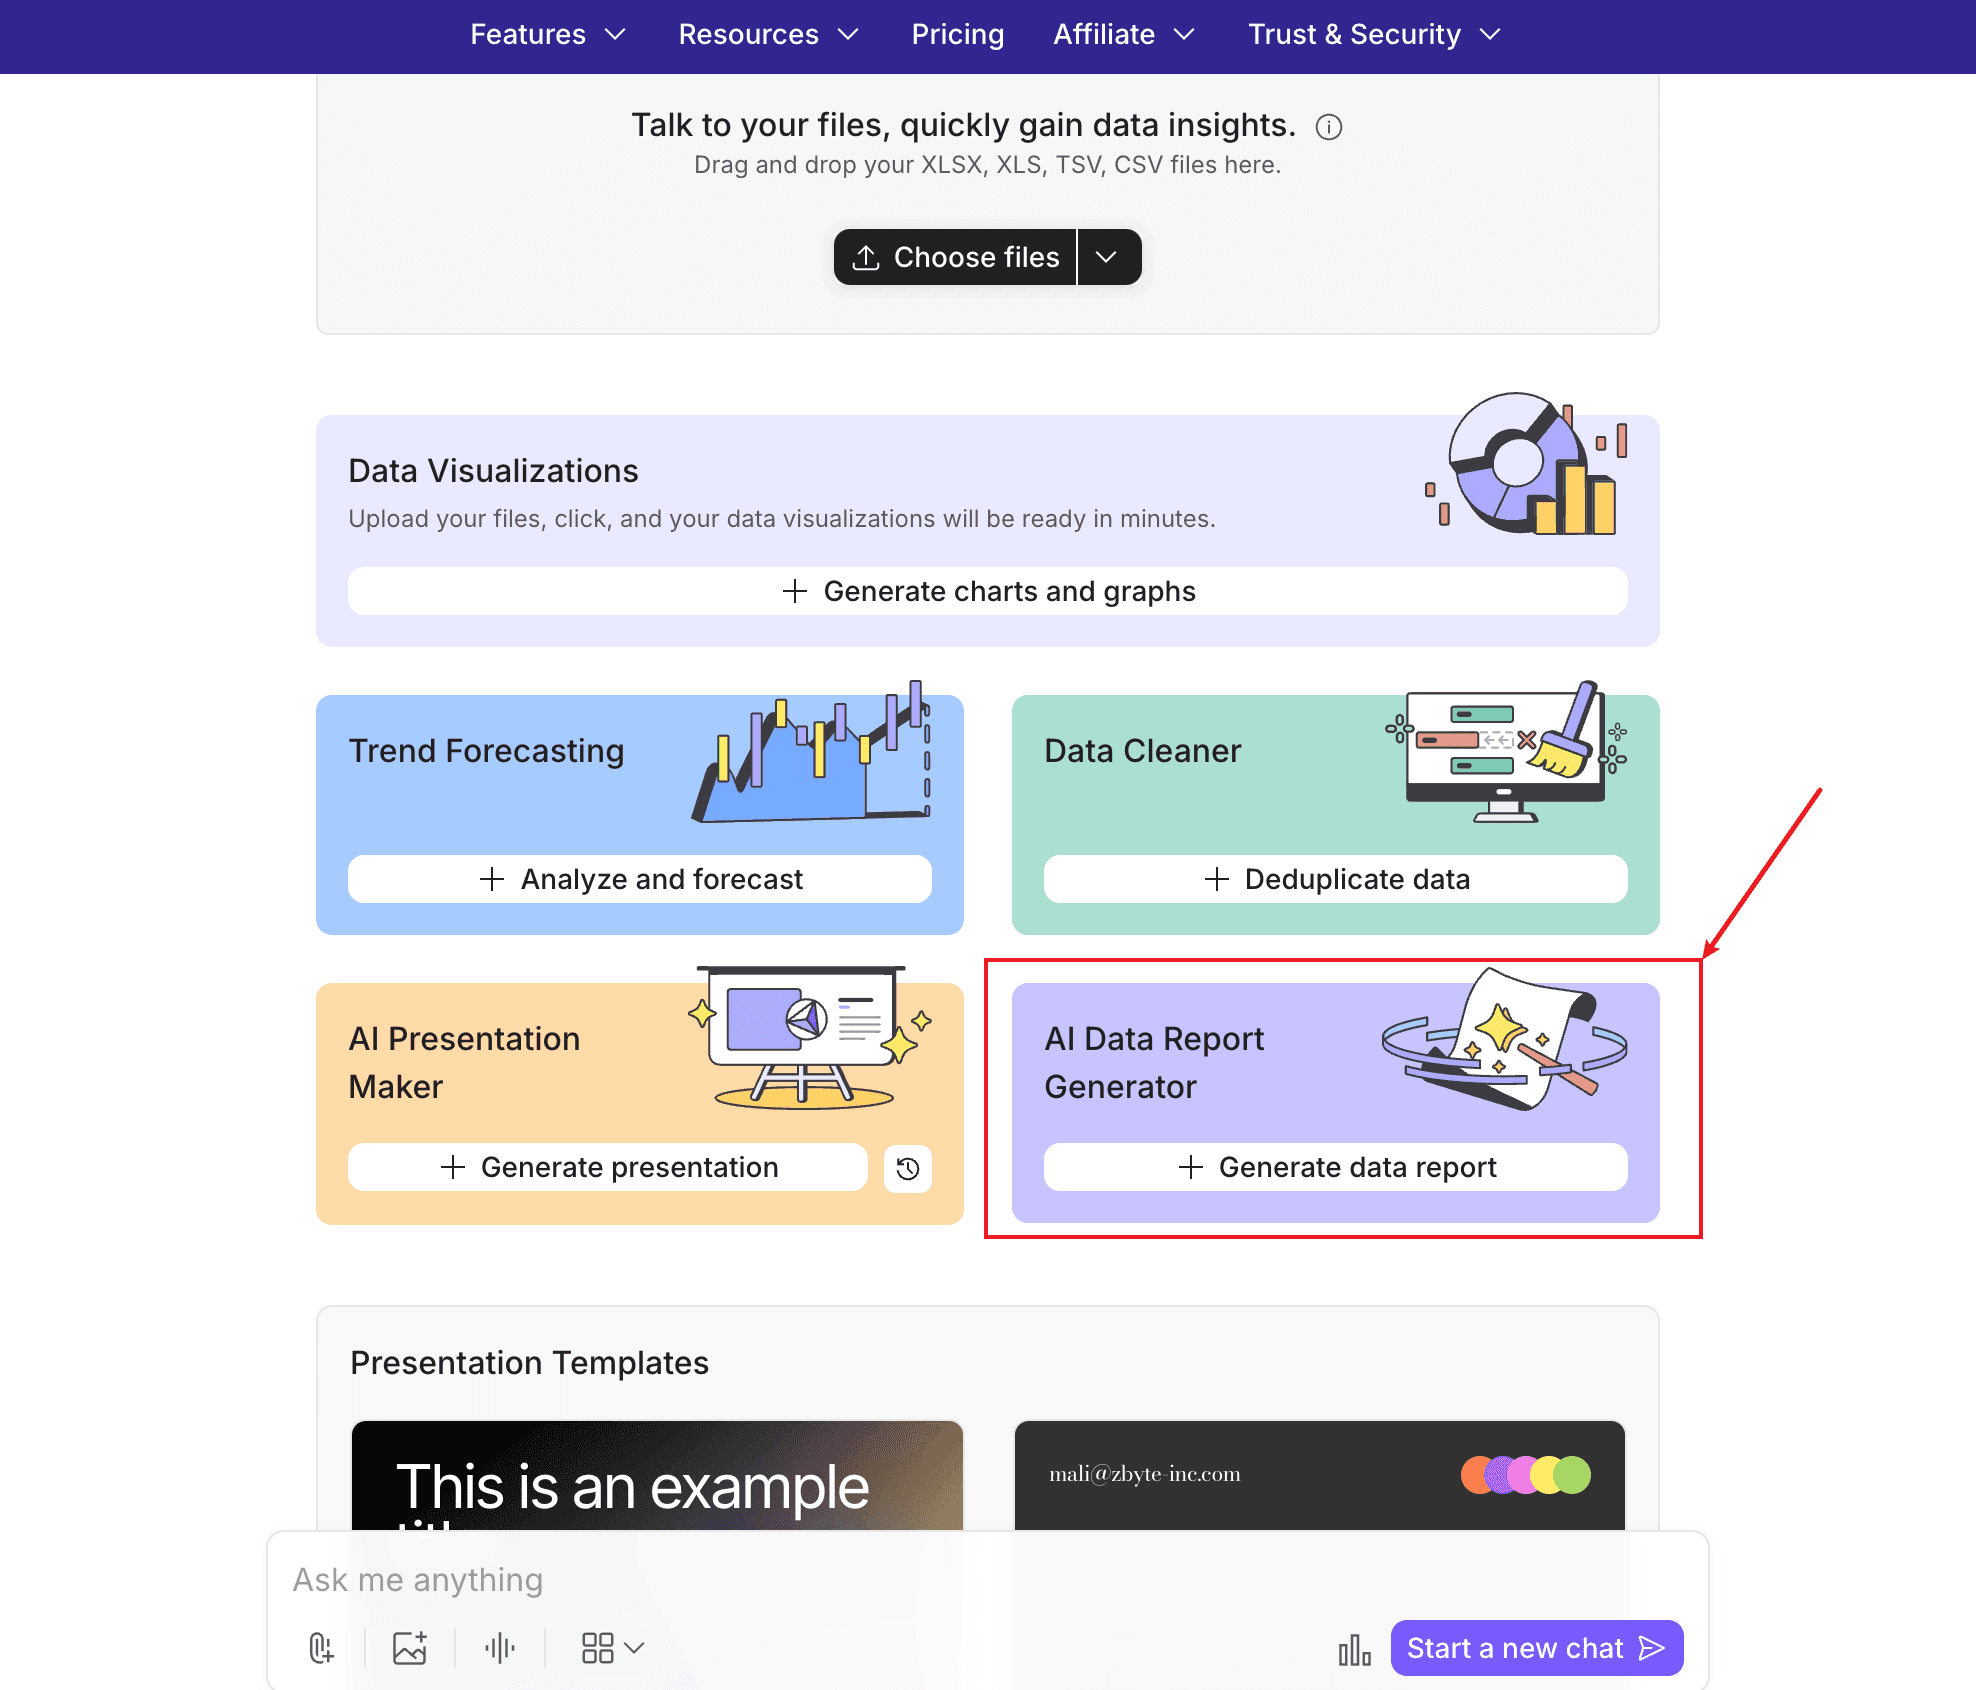
Click the Generate data report button.
Upload your files.
Then, just sit back and relax!
In less than a minute, you'll have a polished, well-organized data report ready to impress your audience.
Here's a sneak peek of a data report generated using the same wholesale-prices-in-india.csv dataset:
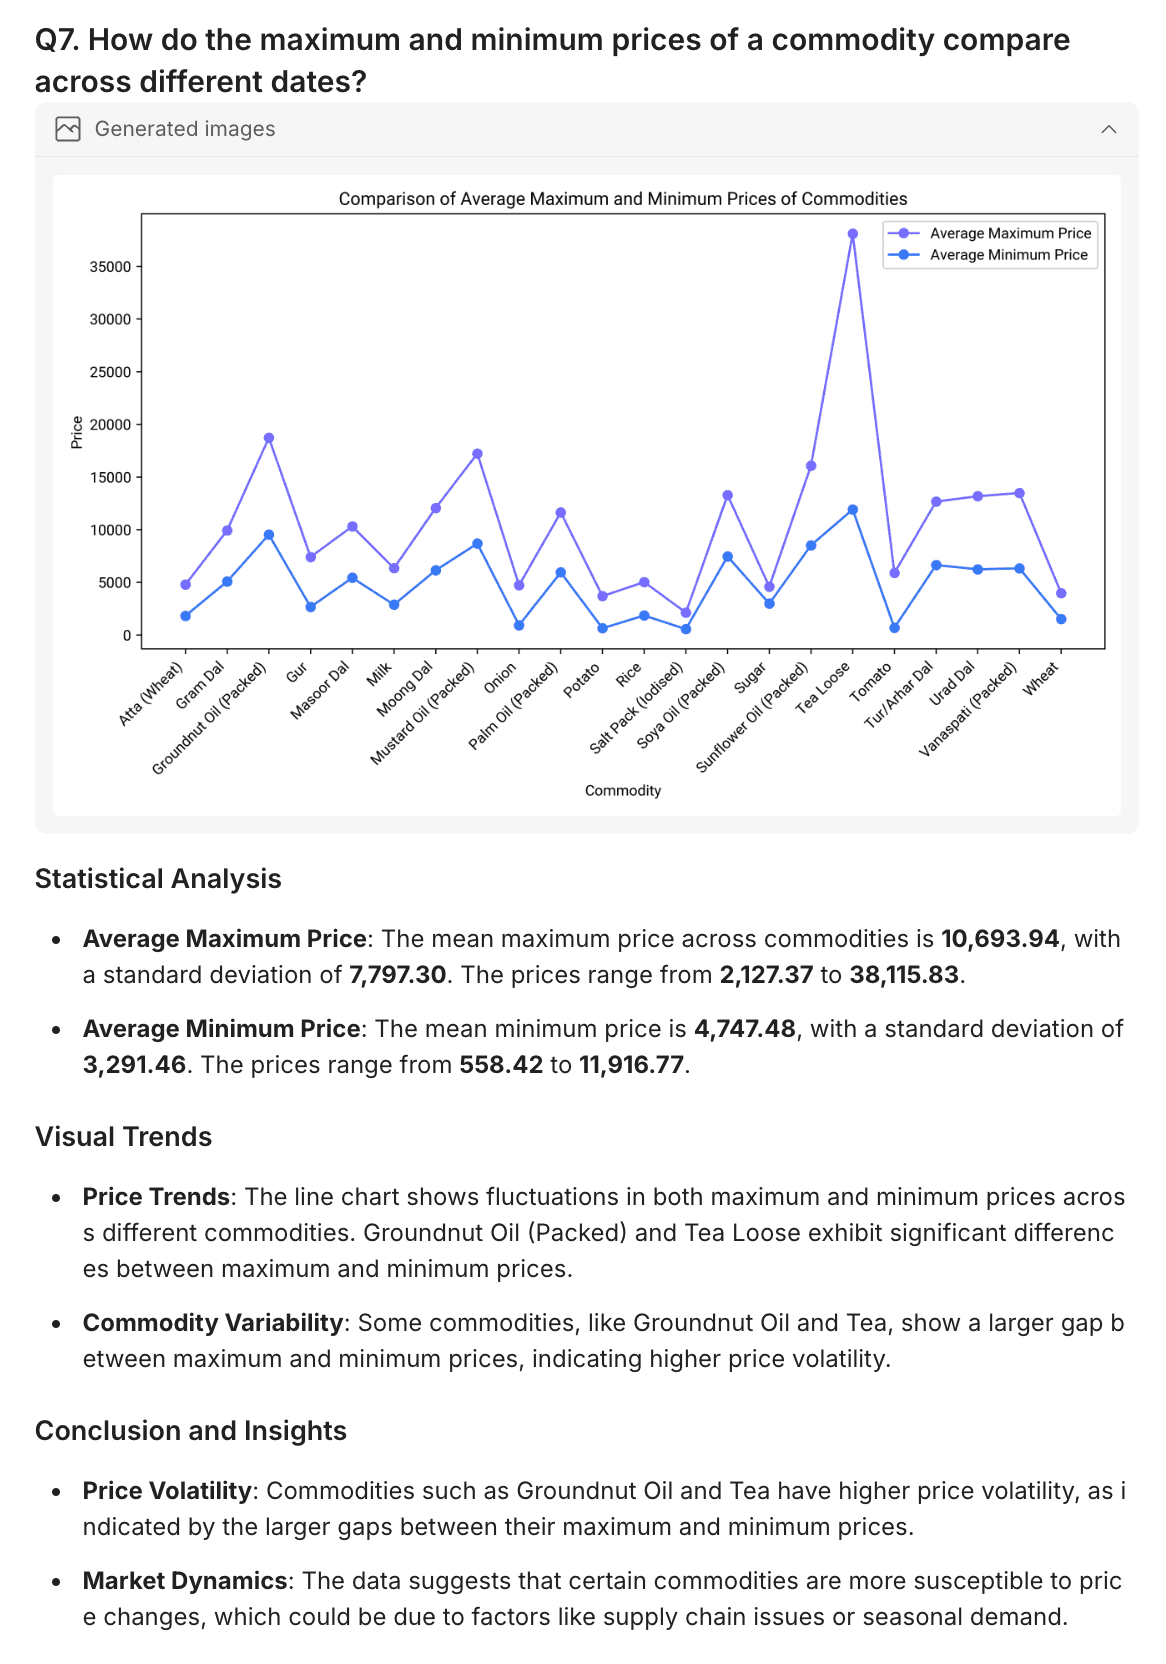
With Powerdrill, creating professional data reports has never been easier!
Discover More About Powerdrill: an AI Tool for Accurate Analysis
Powerdrill AI is a powerful tool that helps you make data-driven decisions in no time. By harnessing the power of artificial intelligence, it simplifies the analysis of large datasets, making it easy to uncover valuable insights.
With cutting-edge technology, Powerdrill quickly delivers insights, automates data processing and visualization, and identifies trends and patterns—without the need for manual coding. This means you can spend less time on data handling and more time understanding the results!
Ready to see what Powerdrill can do? Start exploring today and unlock a whole new world of possibilities!