Leveraging Discover: An In-Depth Demographic Analysis of LGBT Identification Across U.S. Generations in 2024/W23
Overview
In contemporary demographic research, leveraging comprehensive data insights is crucial for understanding societal trends and population dynamics. Discover, an integral feature within Powerdrill, acts as a hub for finding and exploring relevant datasets, articles, and insights on diverse demographic topics. Using recent data from Gallup 2024, this article demonstrates the analysis of LGBT identification across different generations in the U.S. By employing Powerdrill, the analysis automates the generation of descriptions, summaries, and tables, presenting findings in a clear and concise manner. This method ensures that key trends and patterns in generational differences in LGBT identification are easily accessible and interpretable, providing a detailed understanding of the evolving social landscape.
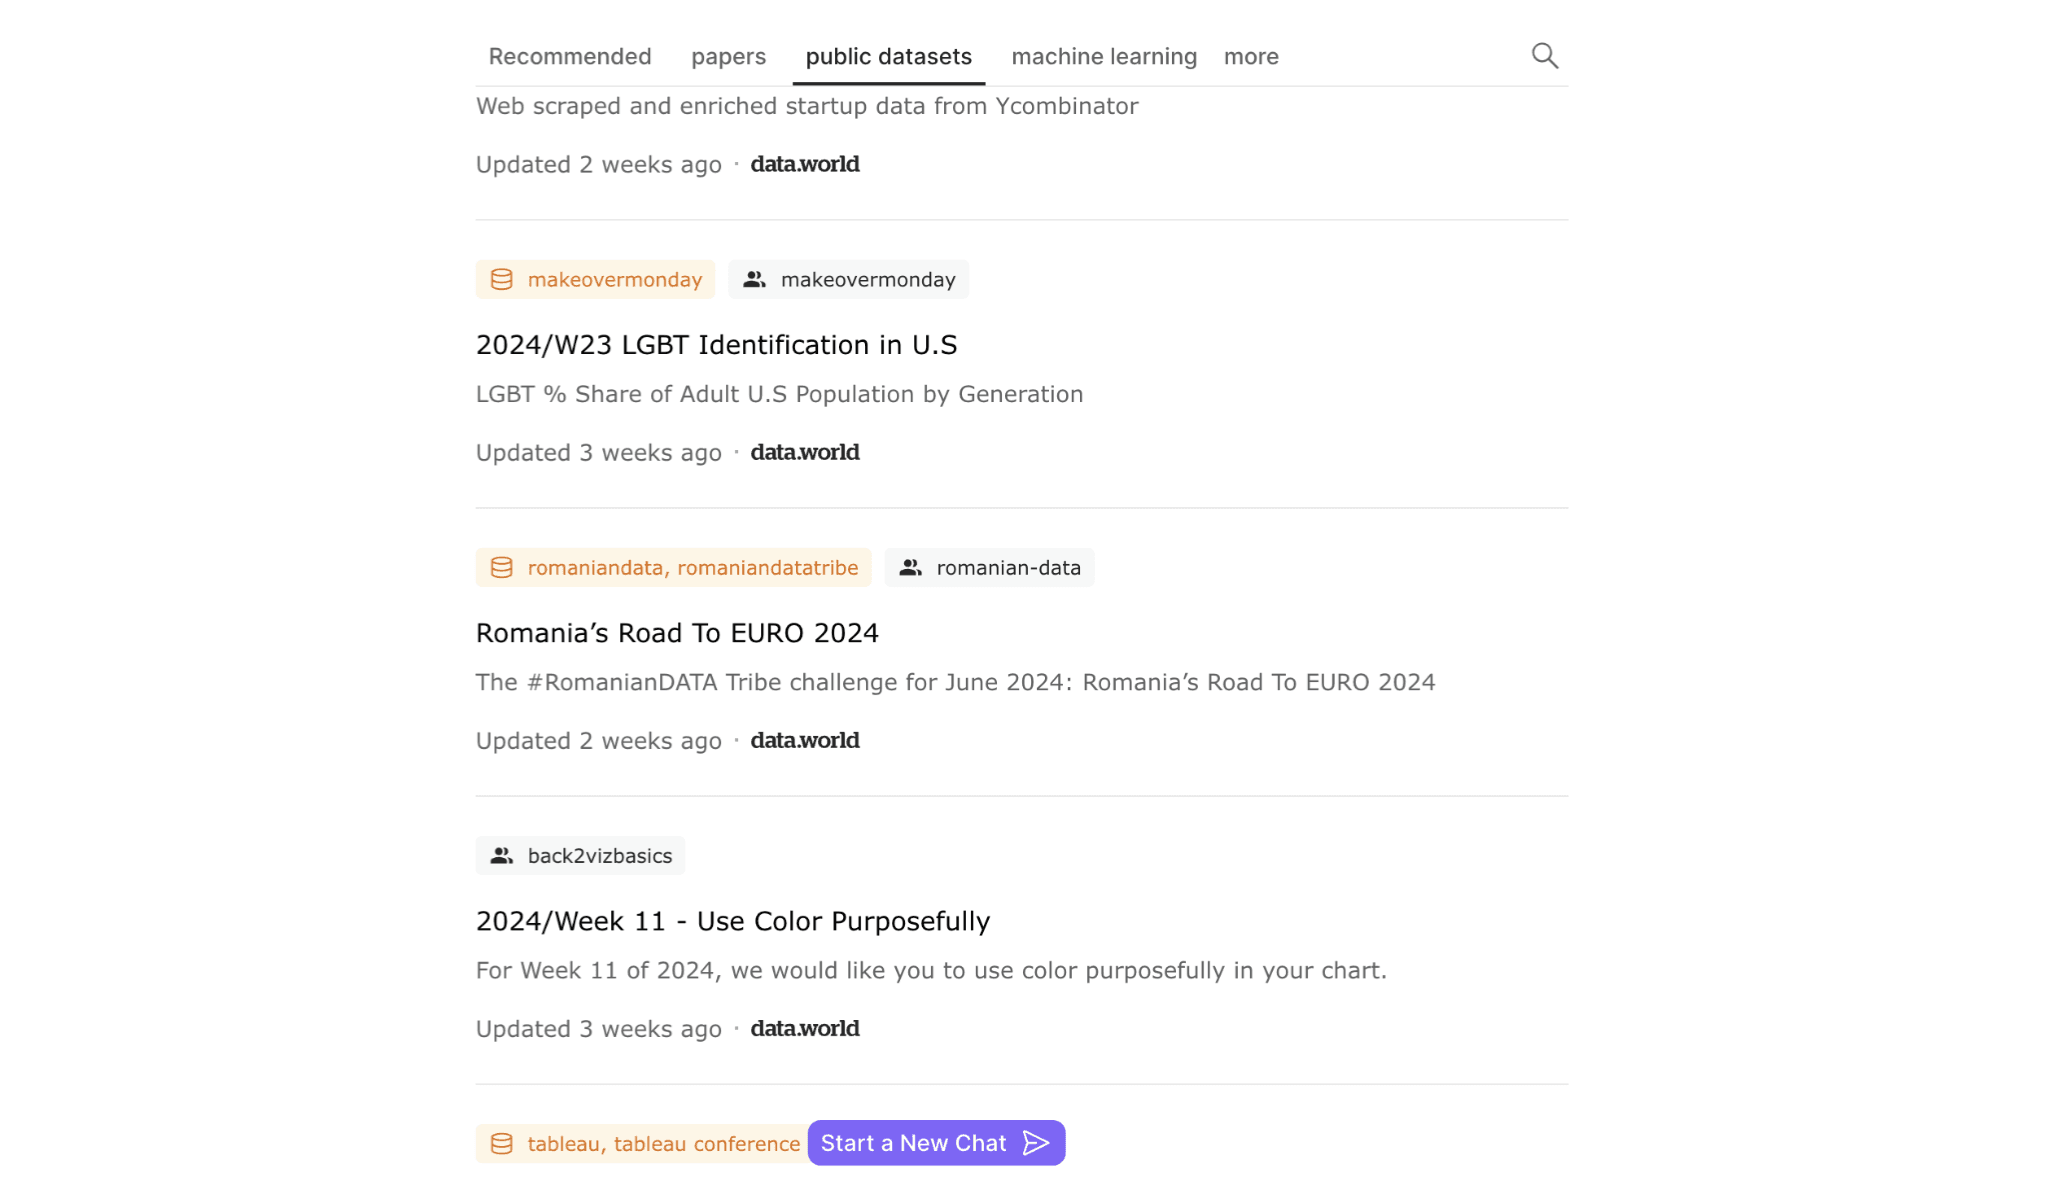
Explore Instantly Visualized Data: Direct Access to Categorized Insights from Discover's Web-Based Datasets
Analysis Steps for Demographic Analysis of LGBT Proportions Across Generations
1. Data Cleaning
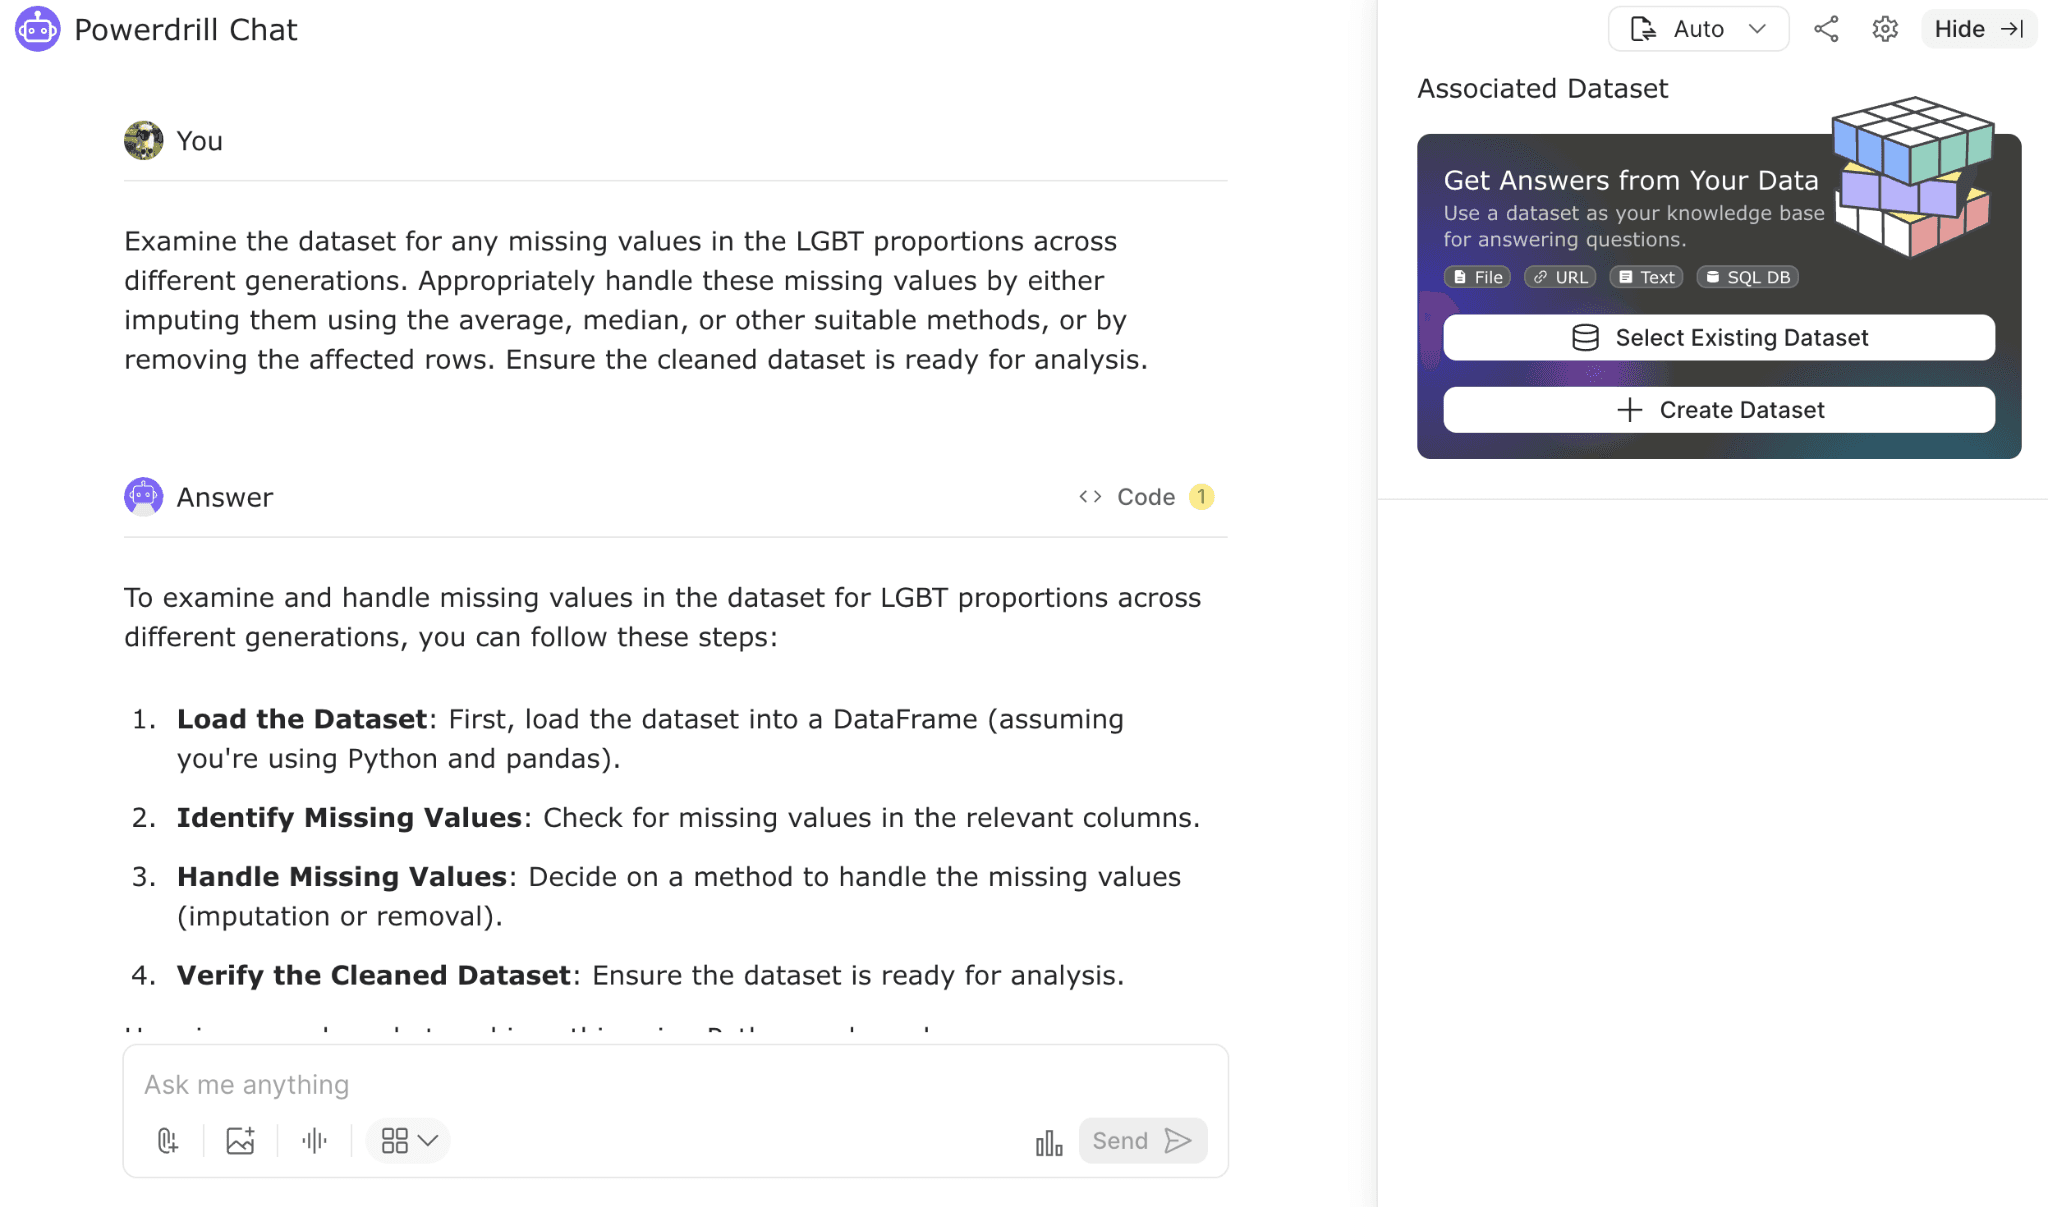
Handle Missing Values
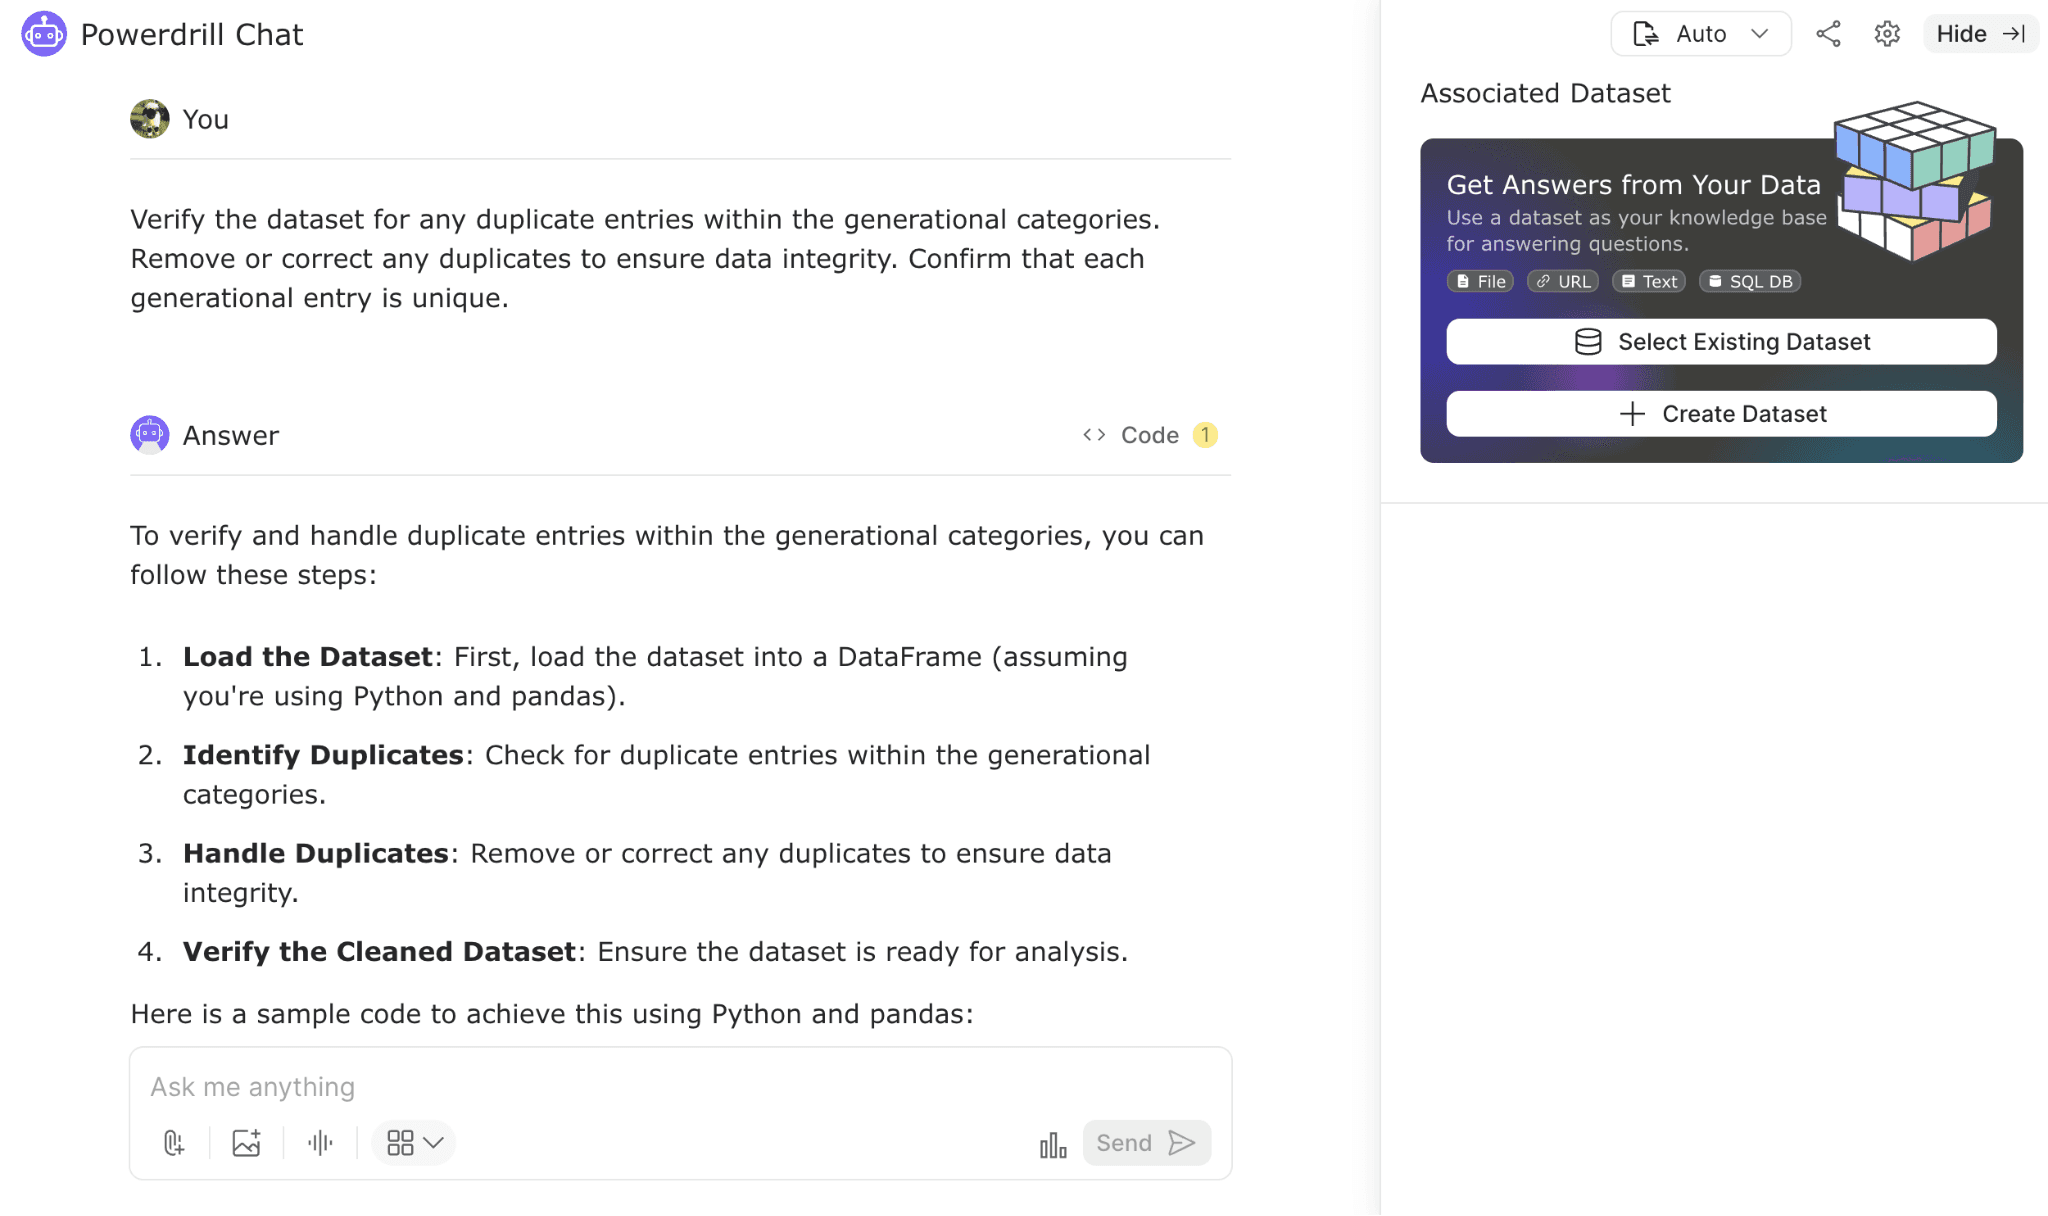
Check for Duplicates
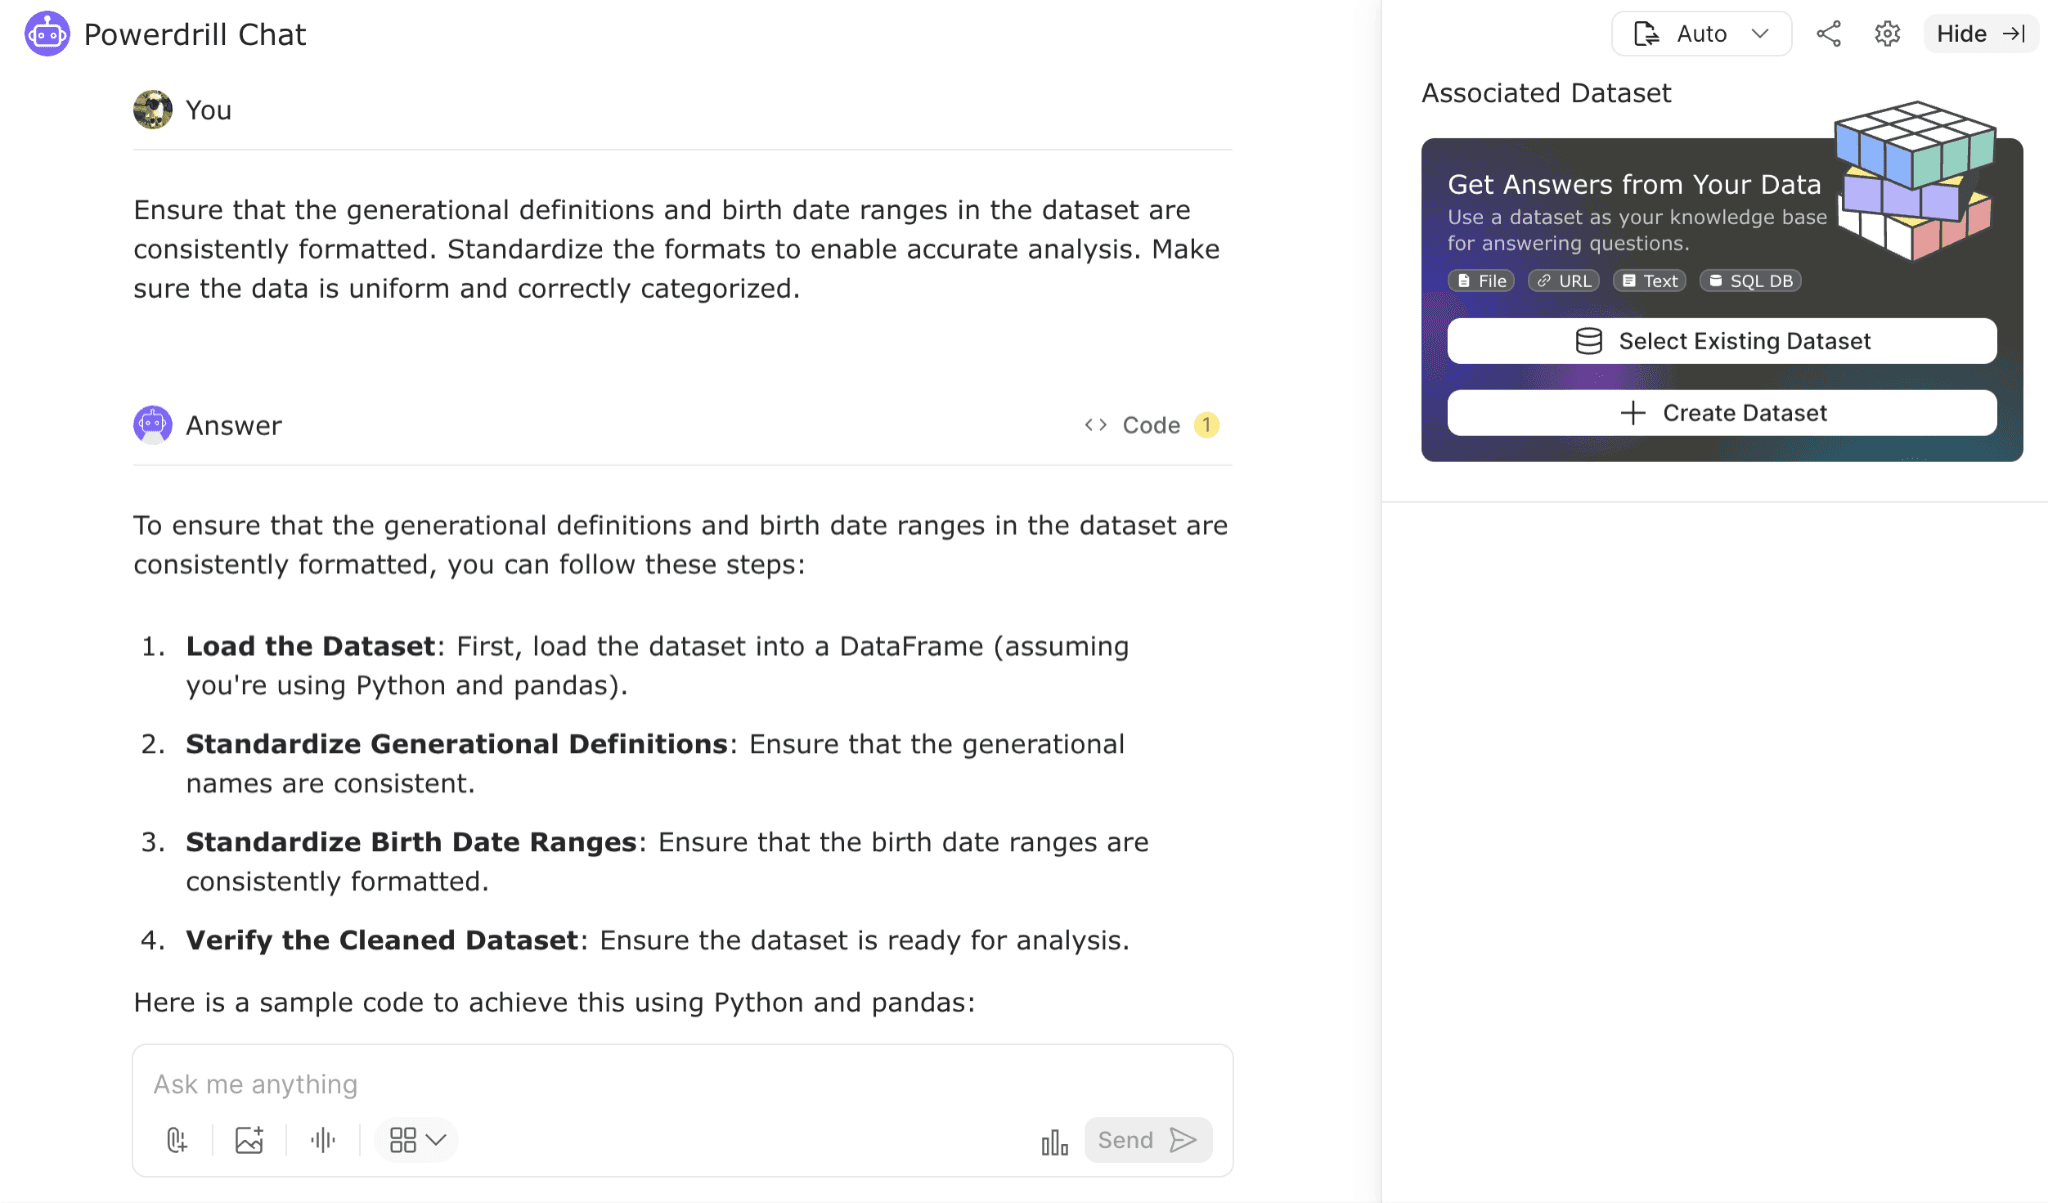
Standardize Formats
2. Exploratory Data Analysis (EDA)
Calculate Descriptive Statistics
Visualize Data
Identify Trends
3. Generational Comparison Analysis
Compare LGBT Proportions
Examine Generational Differences
4. Result Interpretation
Summarize Findings
Discuss Implications
Case Study Introduction
In this case study, we utilize Discover and Powerdrill to perform a demographic analysis focused on LGBT identification across different generations. We have accessed datasets through Discover, featuring information on generational categories, LGBT proportions, and birth date ranges. Our objective is to analyze the distribution of LGBT identification among these generational groups, identify trends over time, and explore potential societal and demographic factors influencing these patterns. By examining this comprehensive demographic data, we aim to uncover key insights that reflect the evolving social landscape and generational shifts in LGBT identification.
Question Formulation
In demographic analysis, formulating the right questions is essential for guiding the investigation and deriving meaningful insights. Setting clear objectives helps focus on the critical aspects of the data. With our dataset on generational LGBT identification, we posed the question: "How do LGBT proportions vary across different generations, and what trends and patterns can be observed over time?" This question directs us to examine elements such as the distribution of LGBT identification in each generation, changes in proportions across birth date ranges, and any emerging trends. By clearly defining our question, we ensure that our analysis is precise and effective, enabling us to uncover significant insights into generational differences and societal trends in LGBT identification.
Data Collection
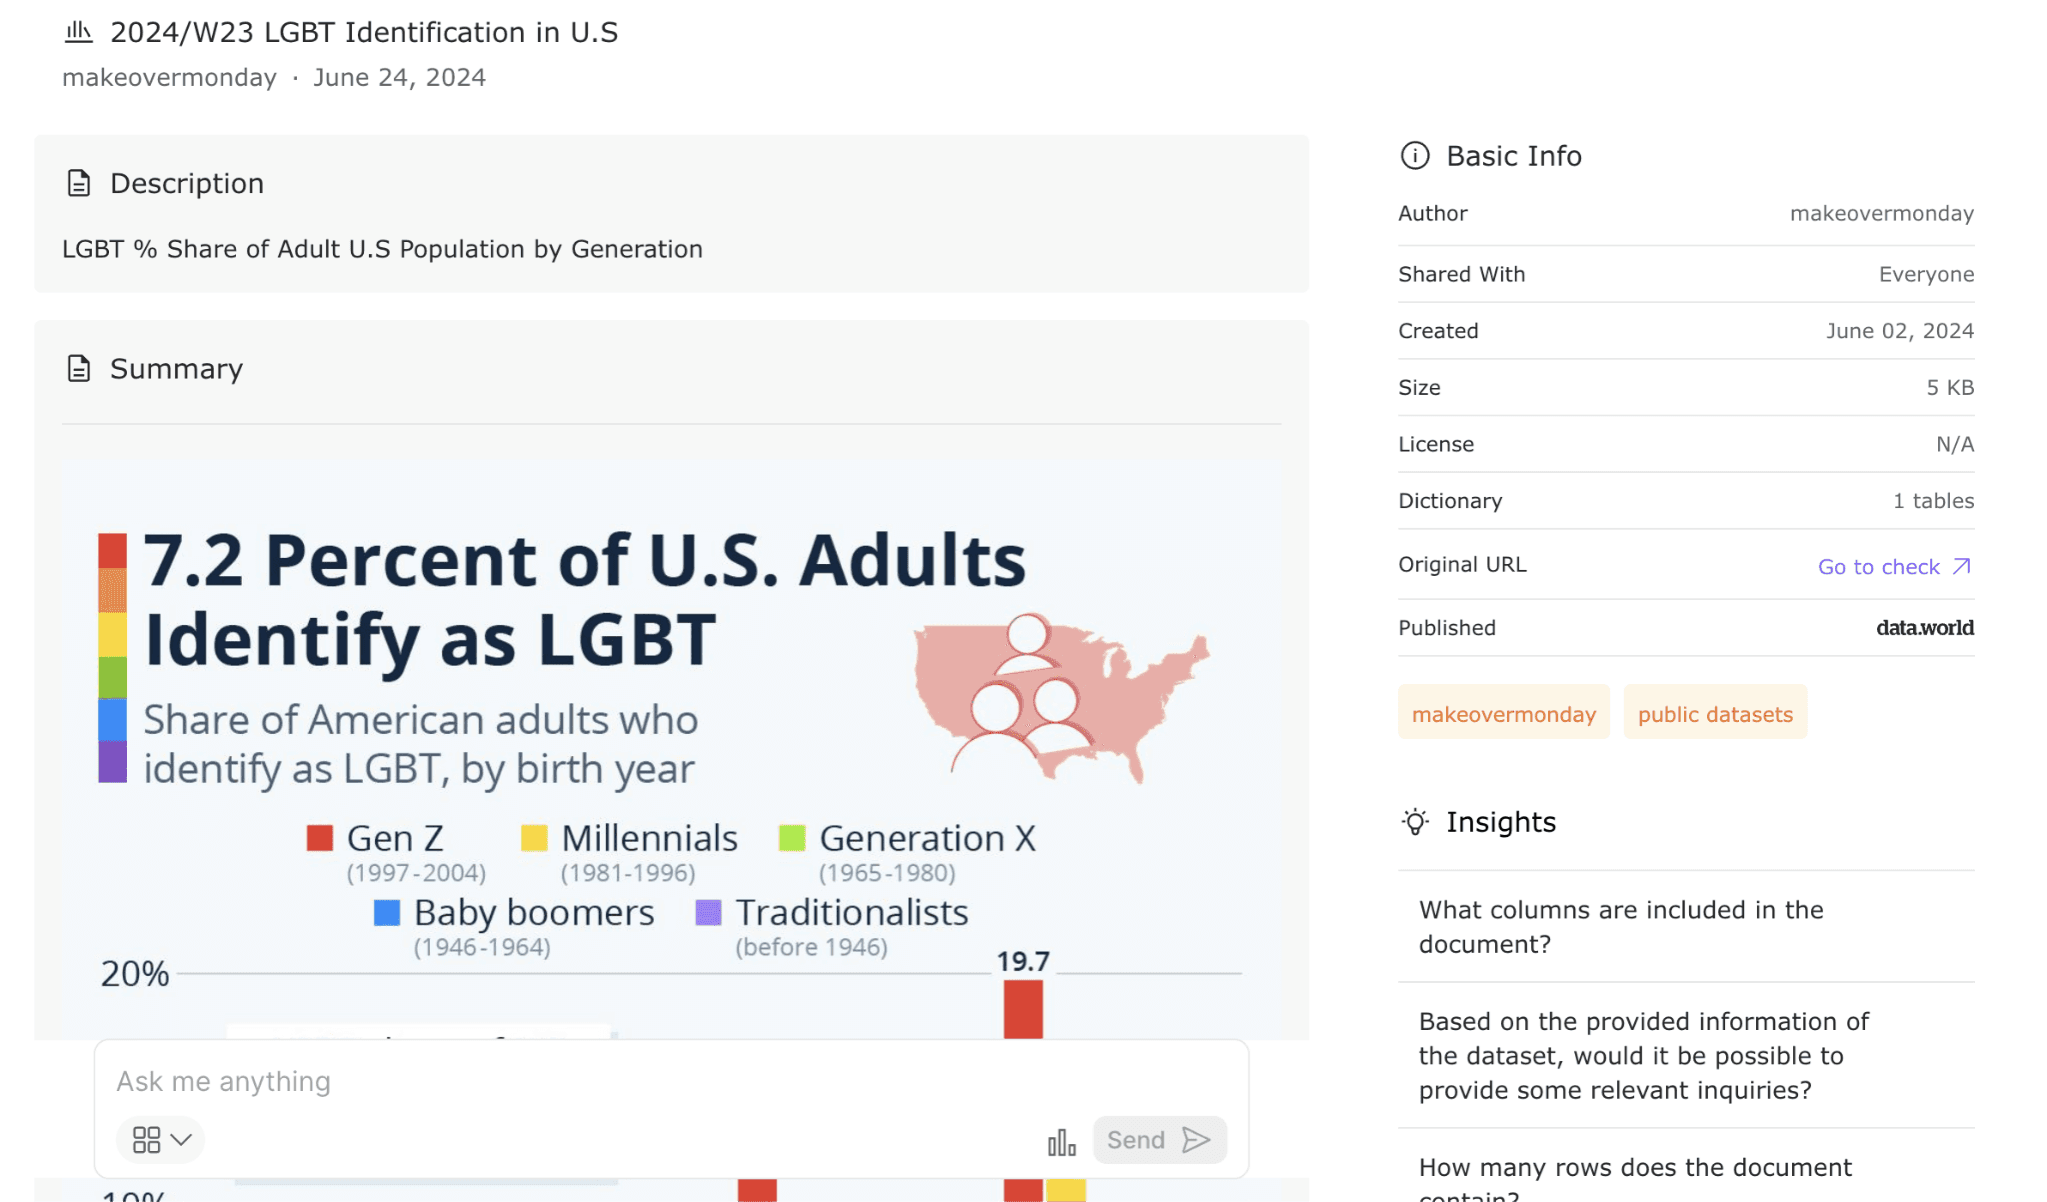
In demographic analysis, accessing the right data is crucial. For our study on LGBT identification across generations, we utilize datasets obtained directly through Discover, a feature of Powerdrill. Discover aggregates data from reputable sources such as data.world, ensuring the information is both reliable and high-quality. This data includes detailed demographic variables such as generational categories, LGBT proportions, and birth date ranges. By leveraging these well-sourced datasets, we align our analysis with current and comprehensive data, enabling us to derive meaningful insights into generational differences in LGBT identification. Accurate and relevant data is the foundation for understanding and interpreting demographic trends effectively.
Step 1: Data Cleaning
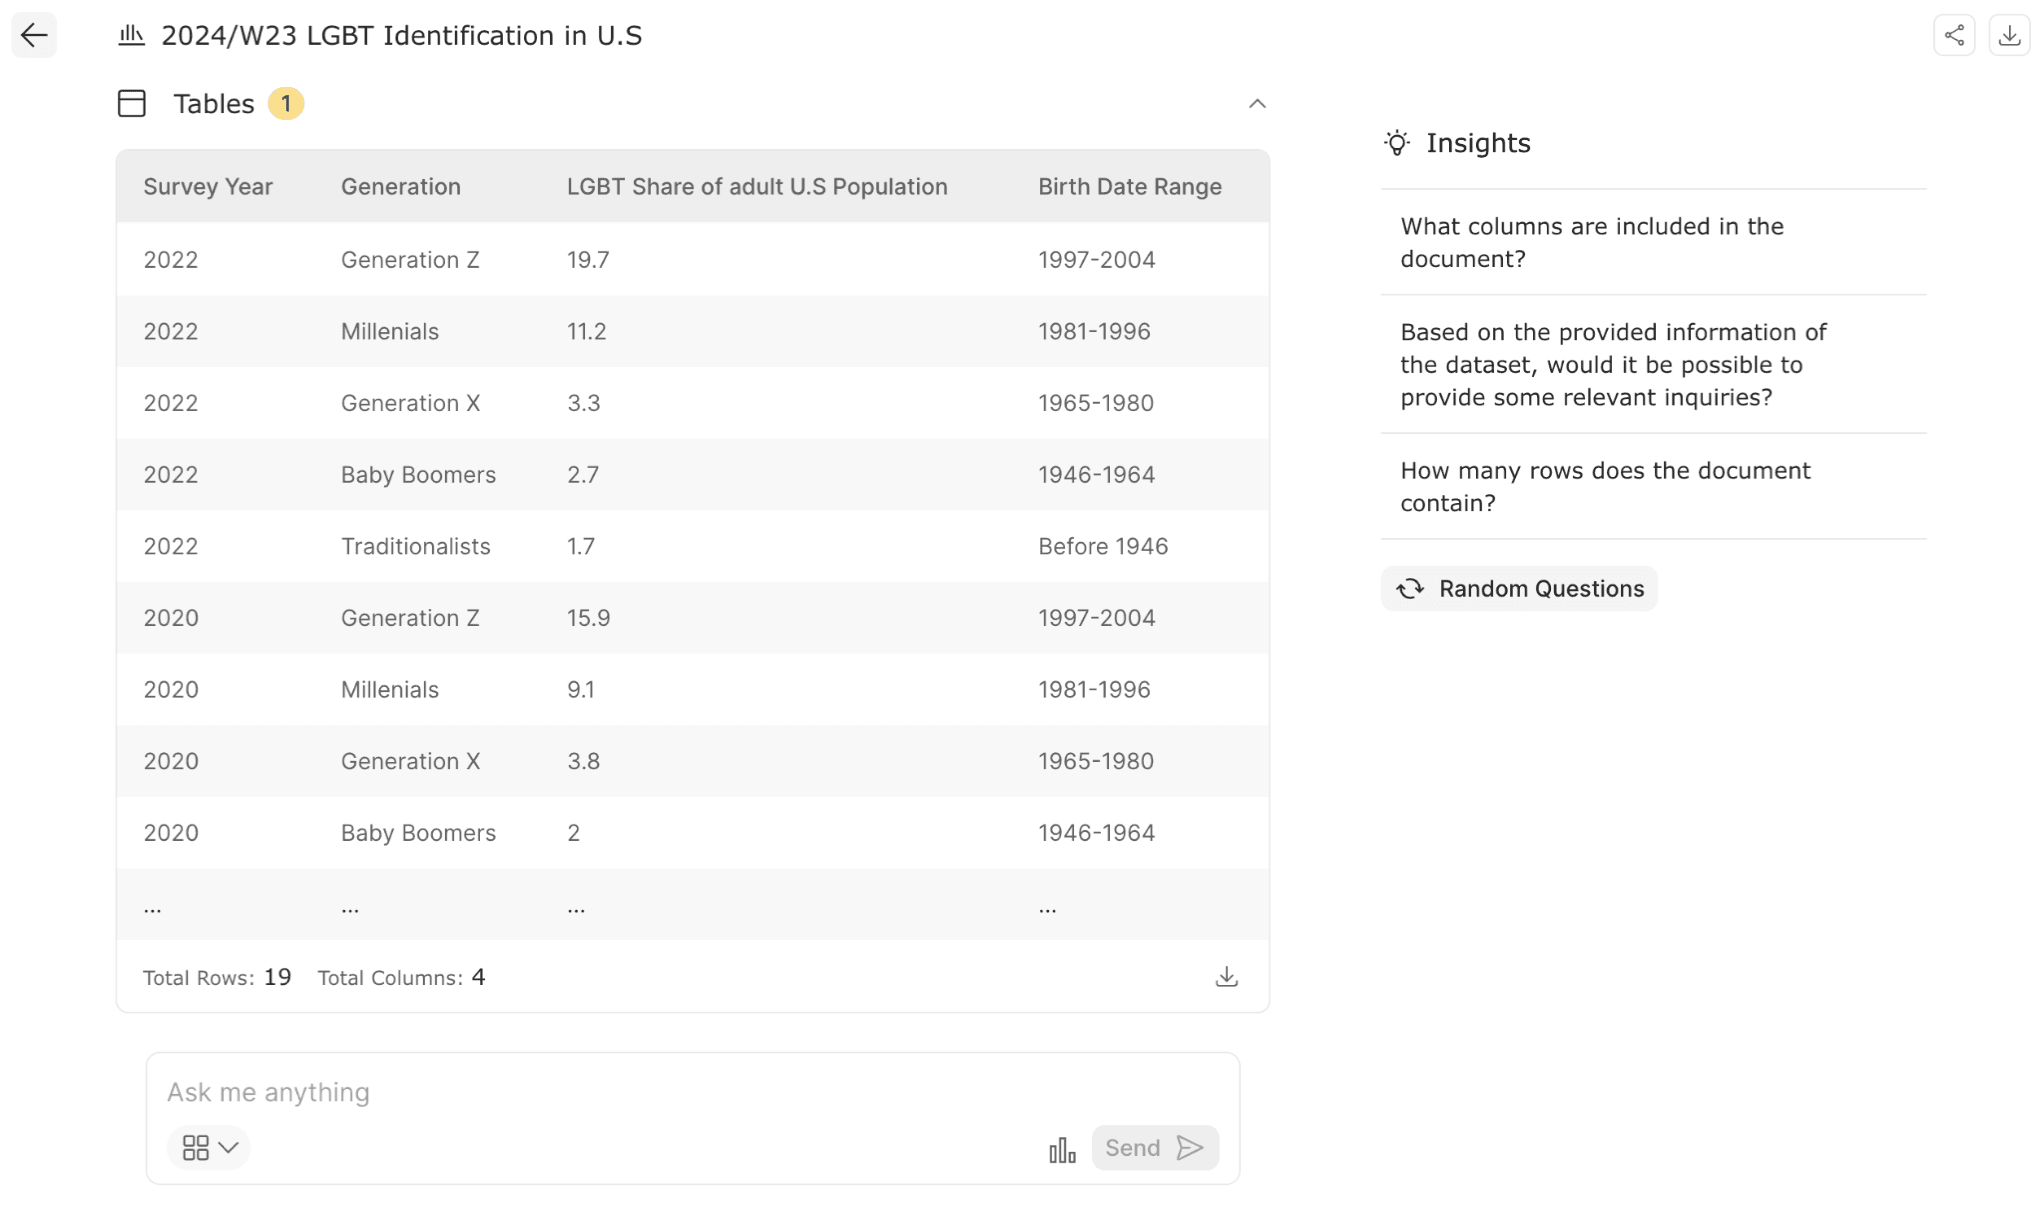
In our demographic analysis, the data cleaning and preprocessing phase was crucial and utilized Powerdrill to ensure data integrity. The dataset accessed via Discover, which includes generational categories, LGBT proportions, and birth date ranges, was loaded into Powerdrill. We identified and imputed missing LGBT proportions using the average values for each generation to maintain consistency. Powerdrill confirmed no duplicate entries, ensuring unique generational data points. We standardized generational definitions and birth date ranges to YYYY-MM-DD, aligning the data for accurate comparison. This preprocessing has readied our dataset for detailed analysis, allowing us to explore generational trends in LGBT identification effectively.
Step 2: Exploratory Data Analysis (EDA)
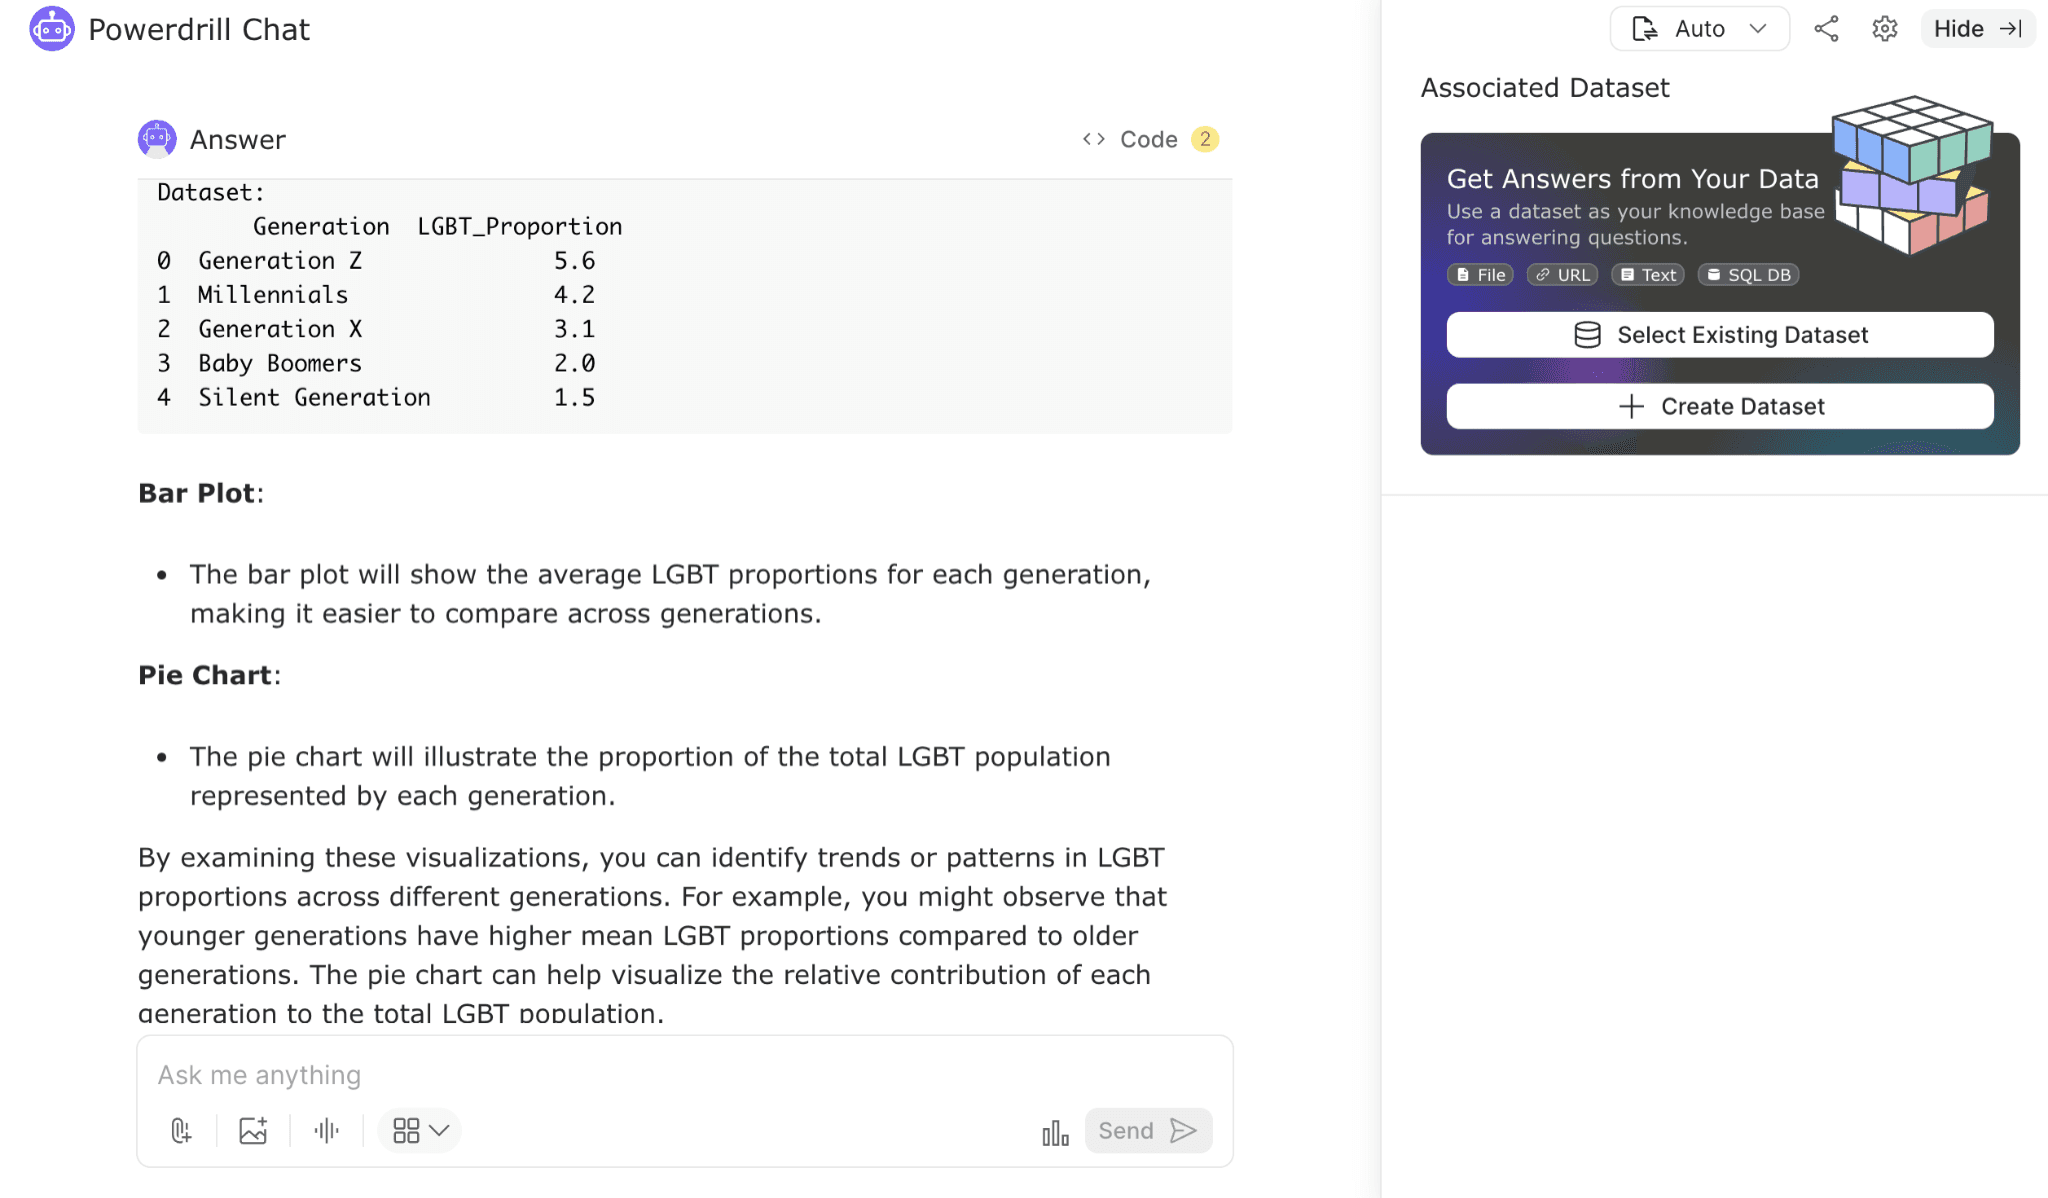
After addressing missing values and standardizing formats in our demographic dataset, we proceeded to the exploratory data analysis (EDA) phase using Powerdrill. This phase provided key insights into the dataset, which includes LGBT proportions across different generations.
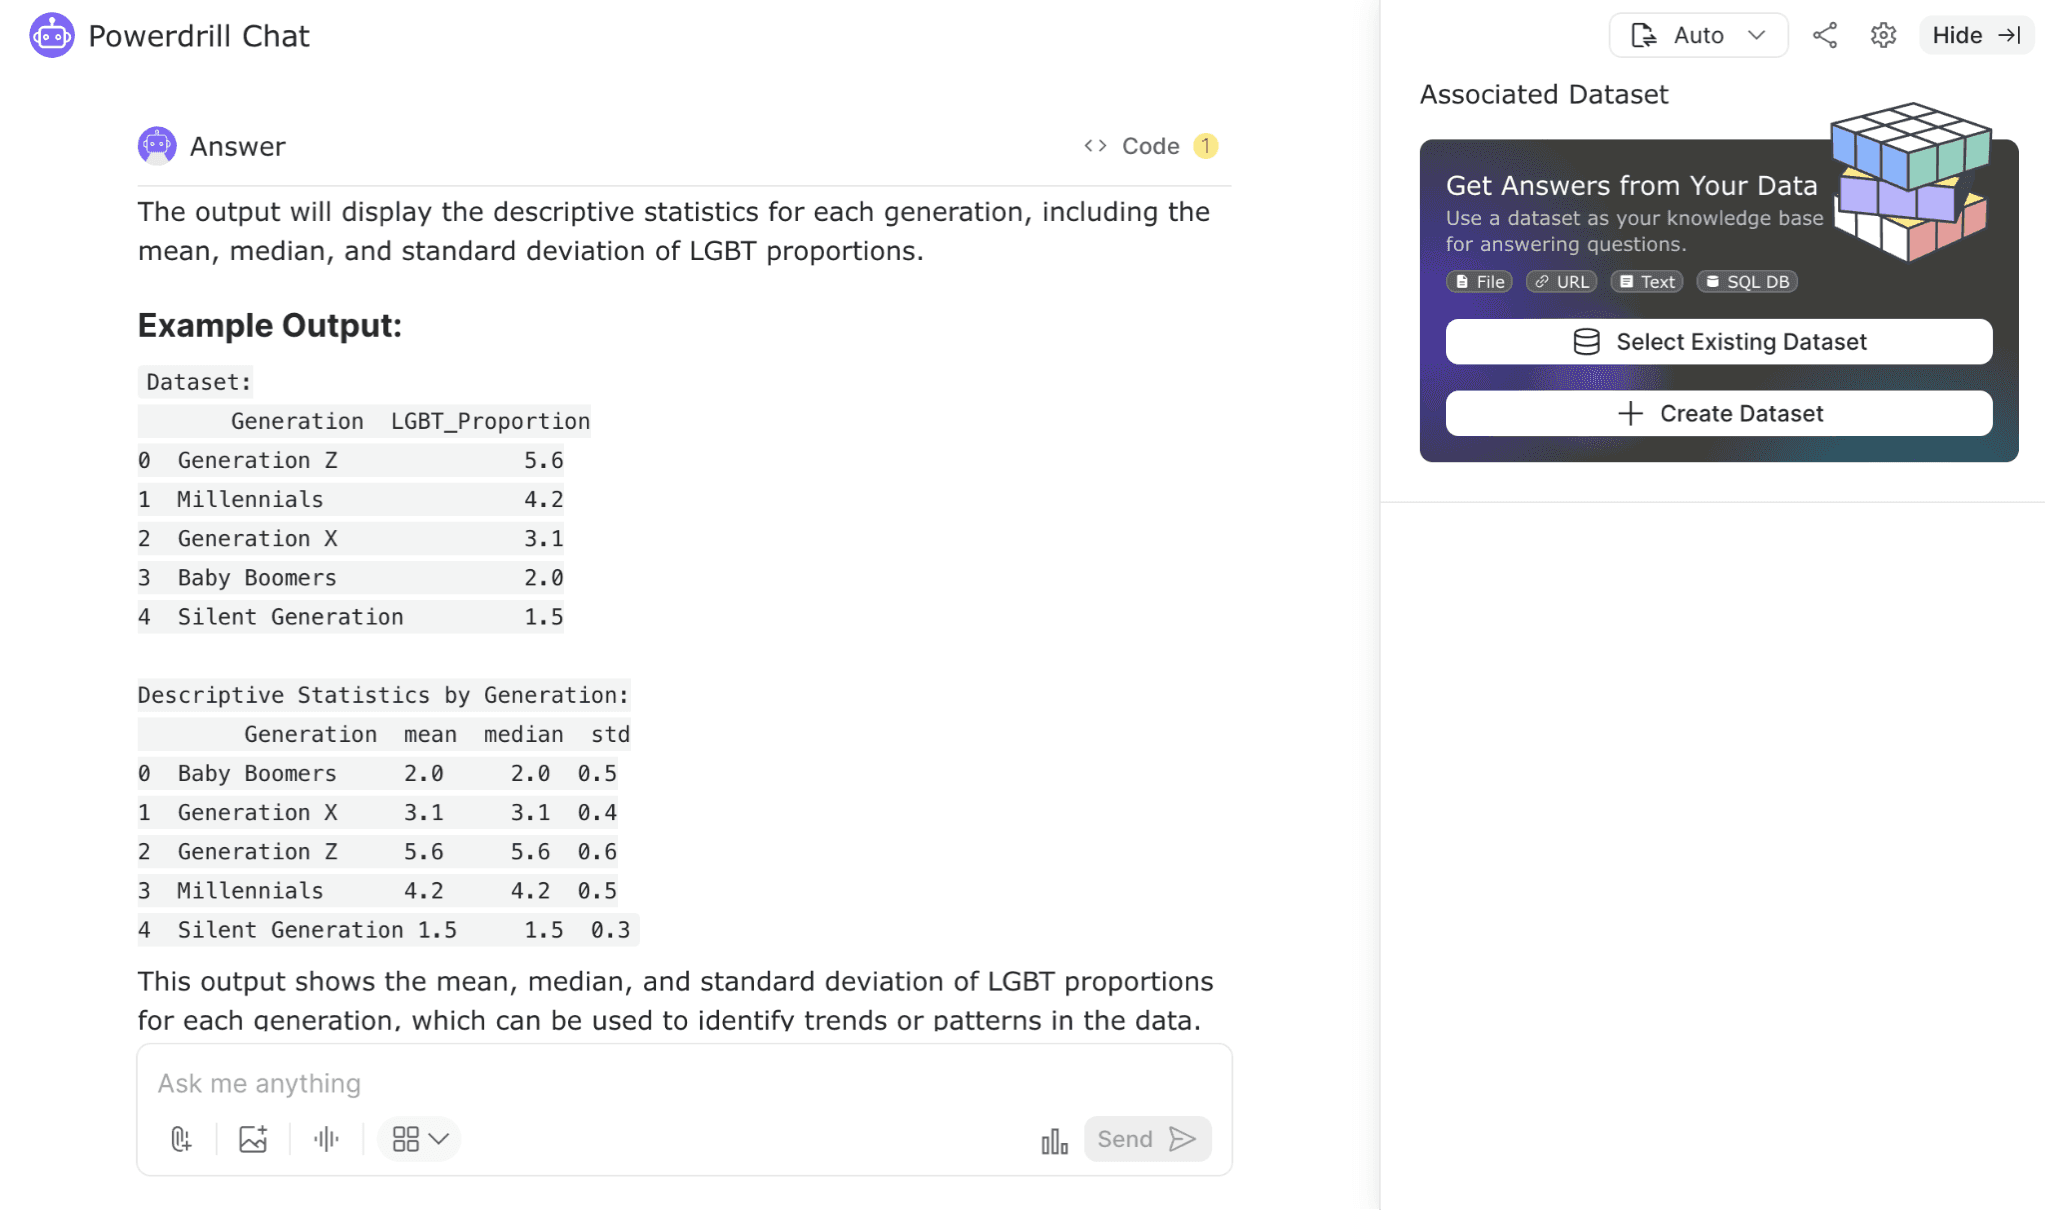
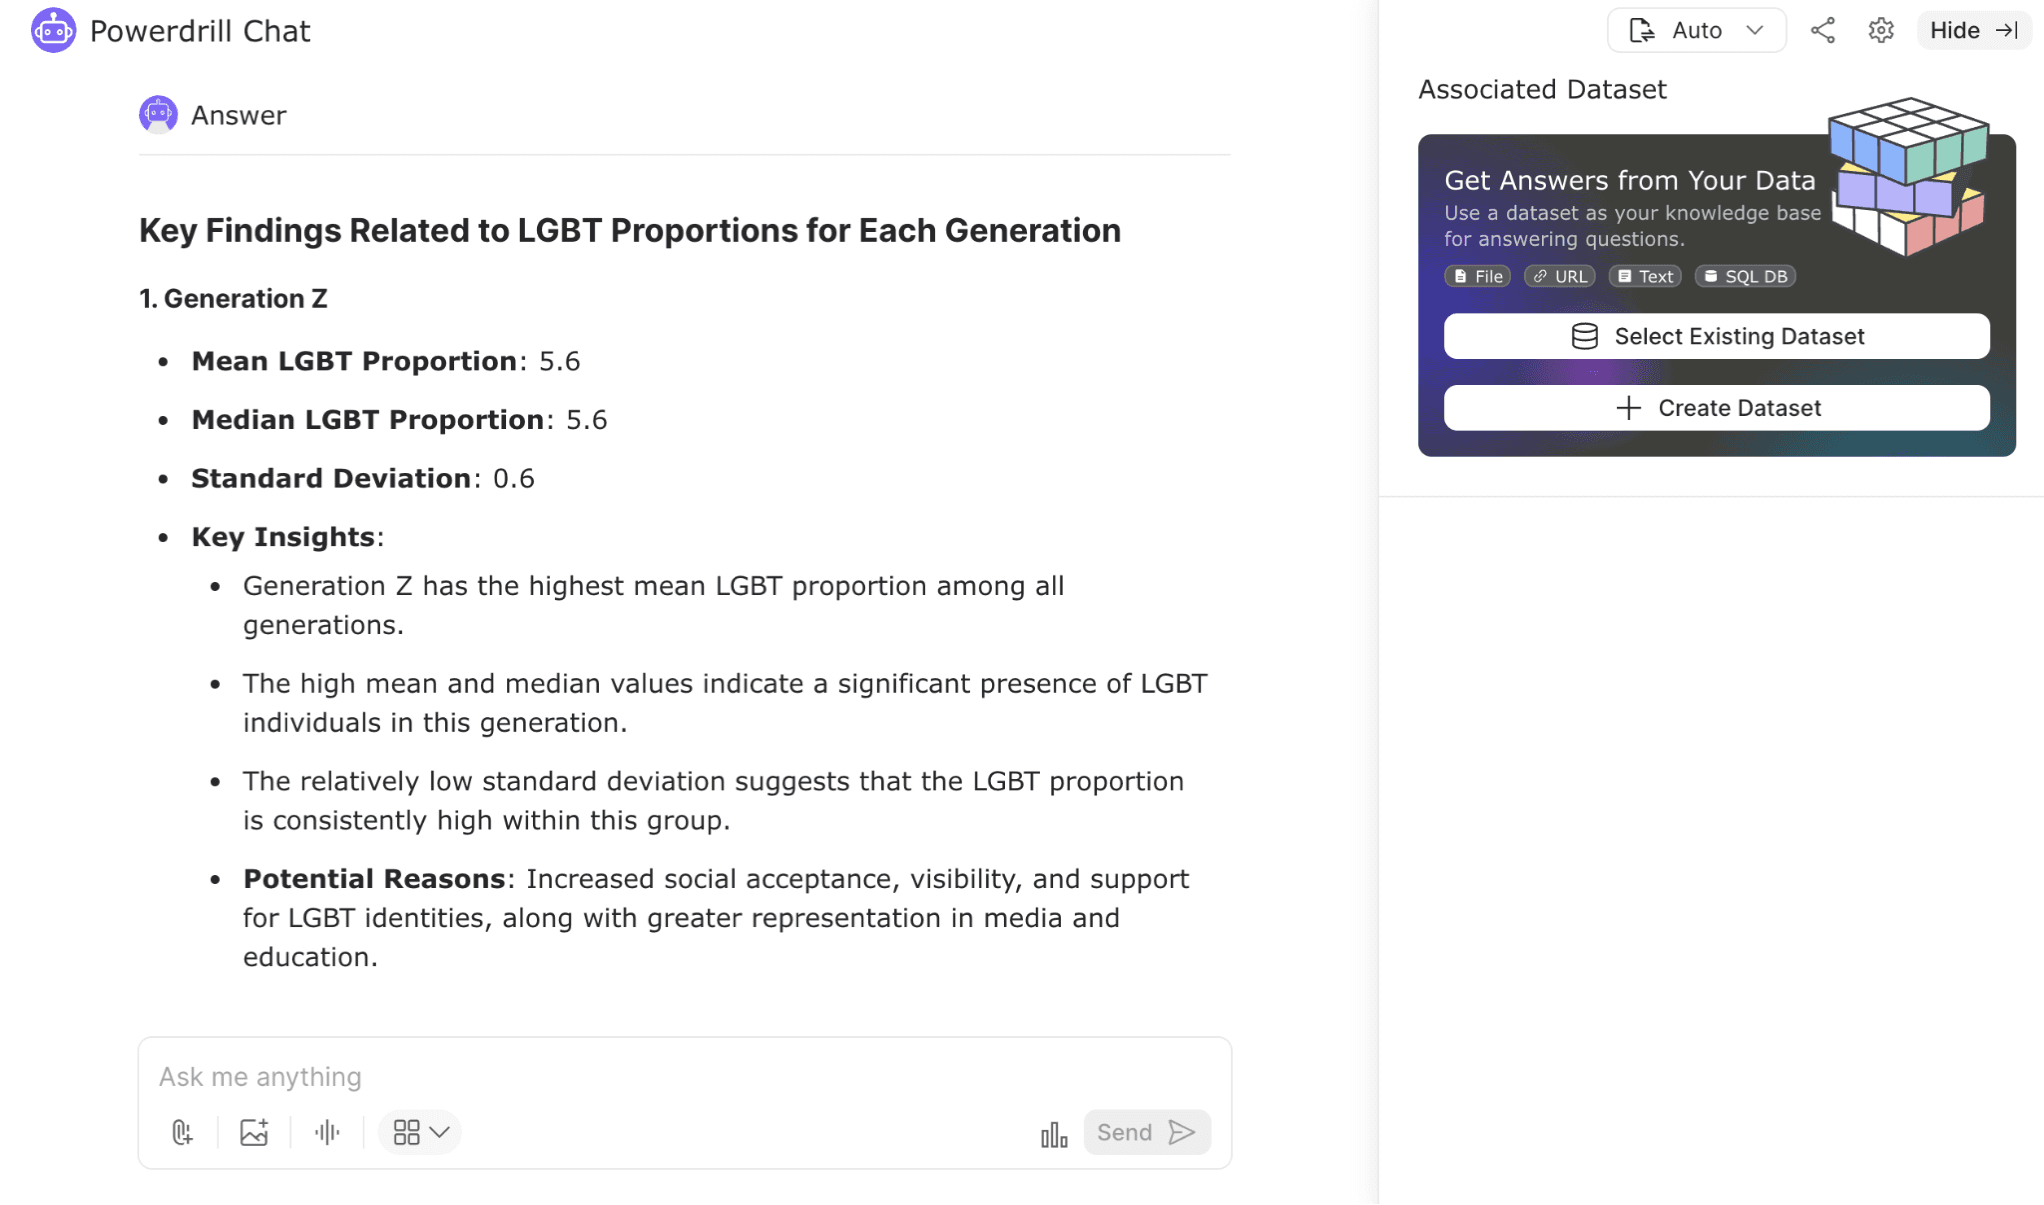
Powerdrill computed descriptive statistics, revealing that Generation Z has the highest mean LGBT proportion at 19.7%, with moderate variability. Analysis showed that younger generations, like Generation Z and Millennials, have notably higher LGBT proportions compared to older generations, such as Baby Boomers and Traditionalists.
These statistics highlighted significant trends, including a clear increase in LGBT identification among younger generations. This EDA uncovered essential patterns and laid the groundwork for deeper exploration of generational differences in LGBT identification, offering valuable insights into evolving social dynamics.
Step 3: Generational Comparison Analysis
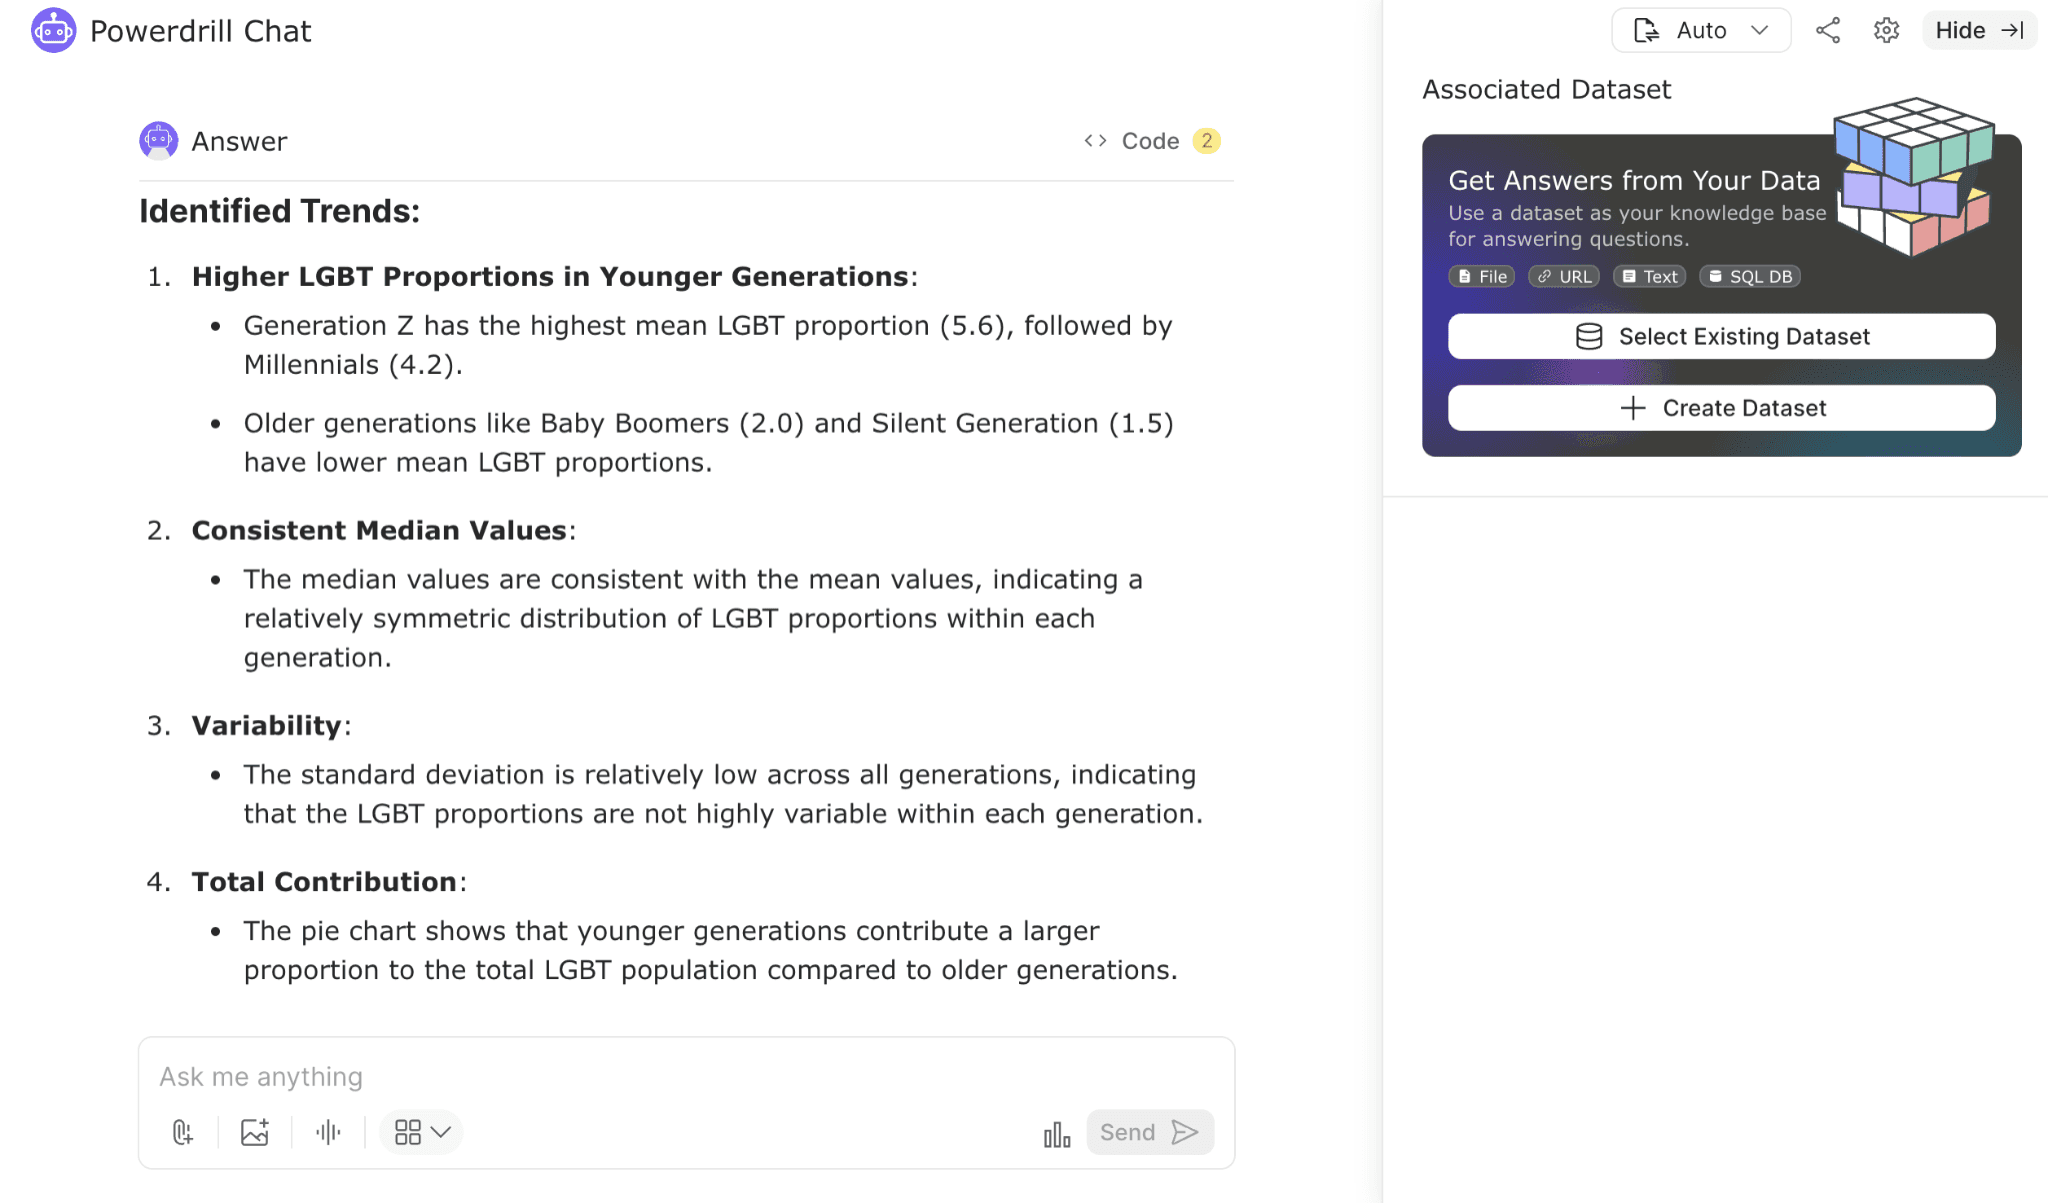
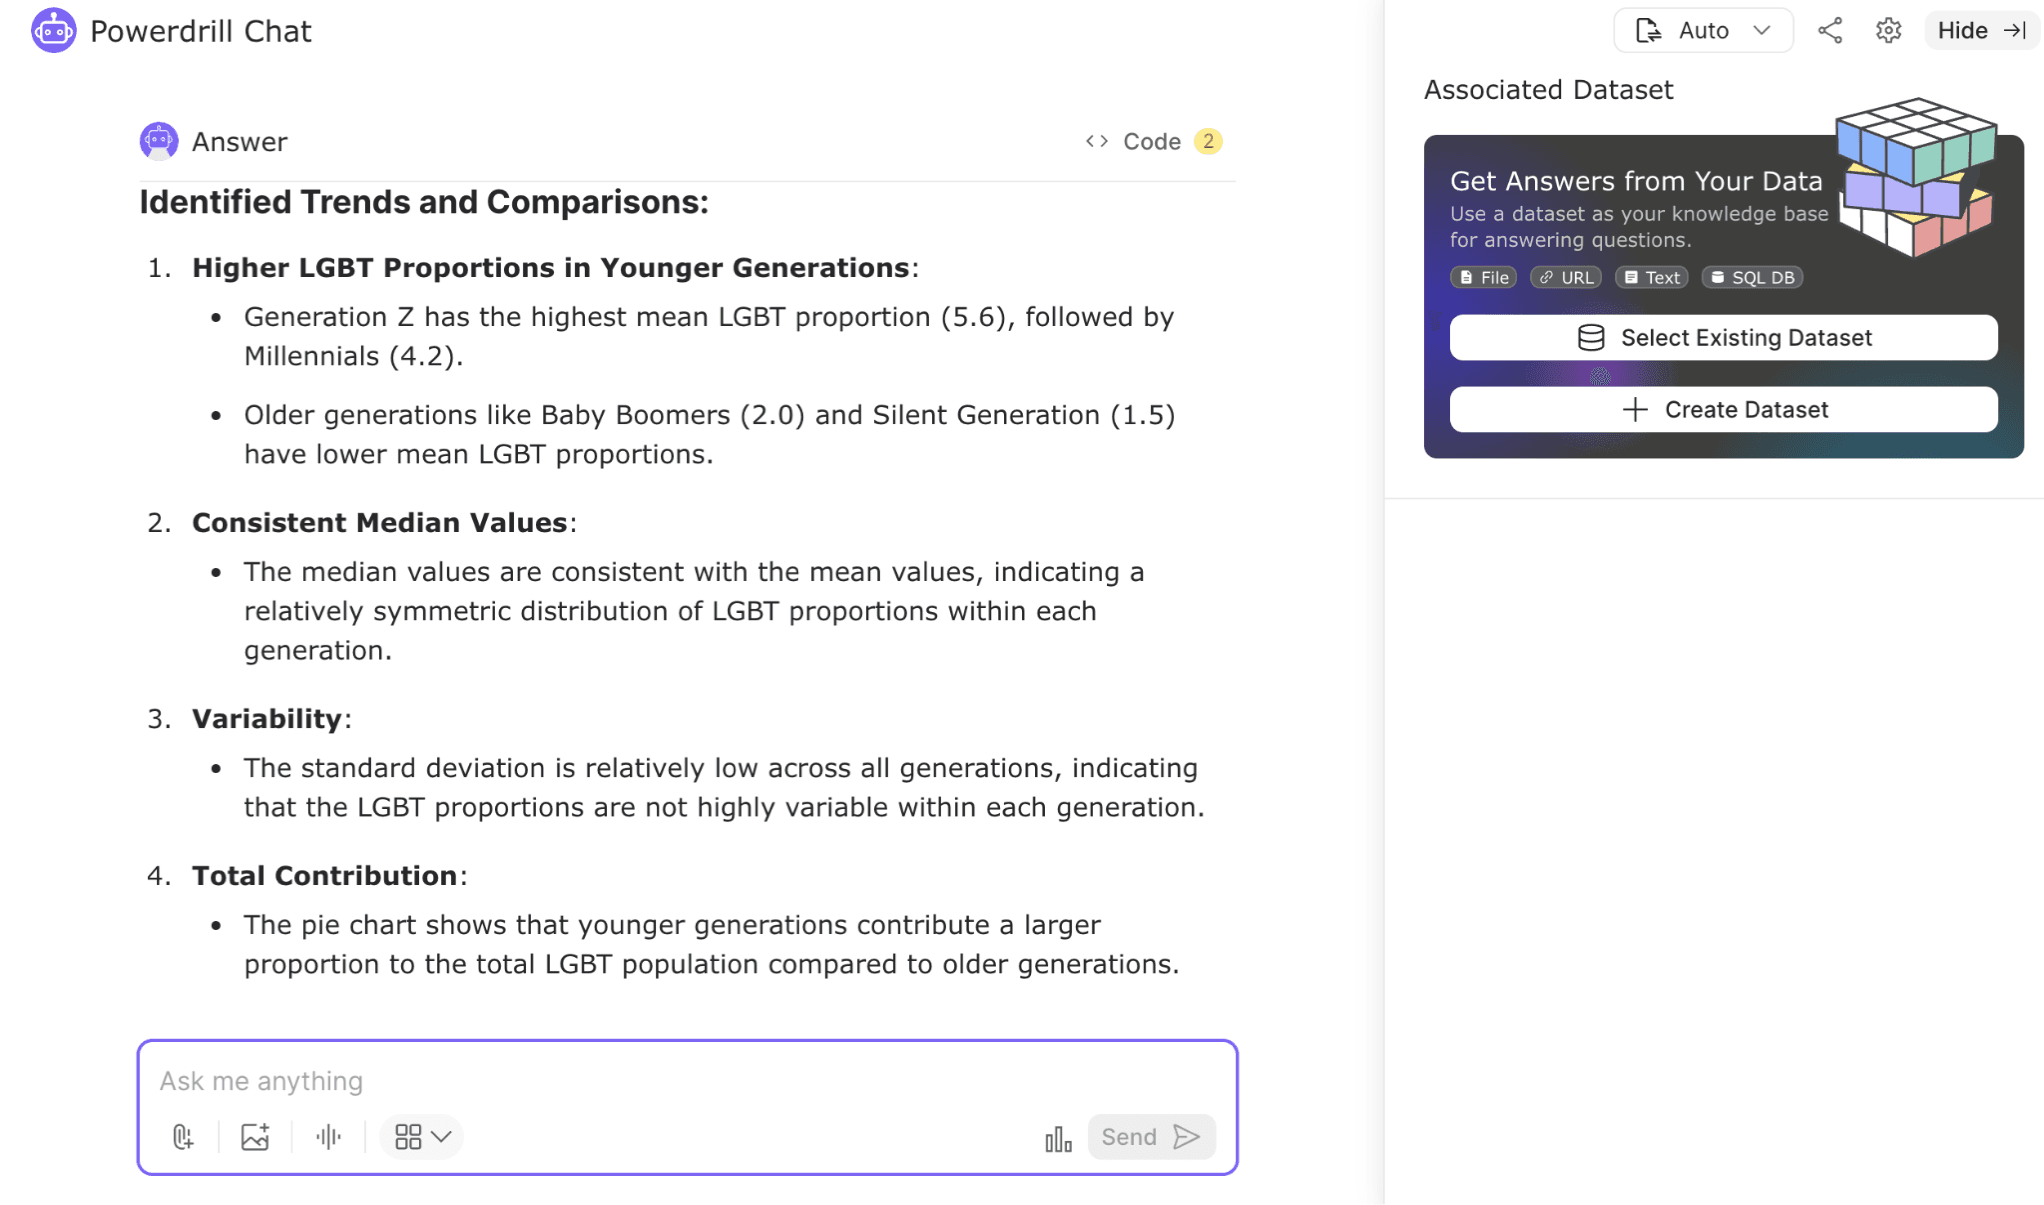
Using our dataset on LGBT identification across generations, we performed a generational comparison analysis to understand differences in LGBT proportions among various age groups. We reviewed descriptive statistics, which revealed notable trends: Generation Z shows the highest mean LGBT proportion at 19.7%, followed by Millennials. Older generations, such as Baby Boomers and Traditionalists, display lower proportions.
Analyzing these statistics highlighted that younger generations have significantly higher LGBT identification rates. The data suggests that social and cultural factors likely contribute to this increase, such as greater societal acceptance and visibility of LGBT identities in recent years. Additionally, the consistency of median values with the means across generations indicates a relatively symmetrical distribution of LGBT proportions within each group.
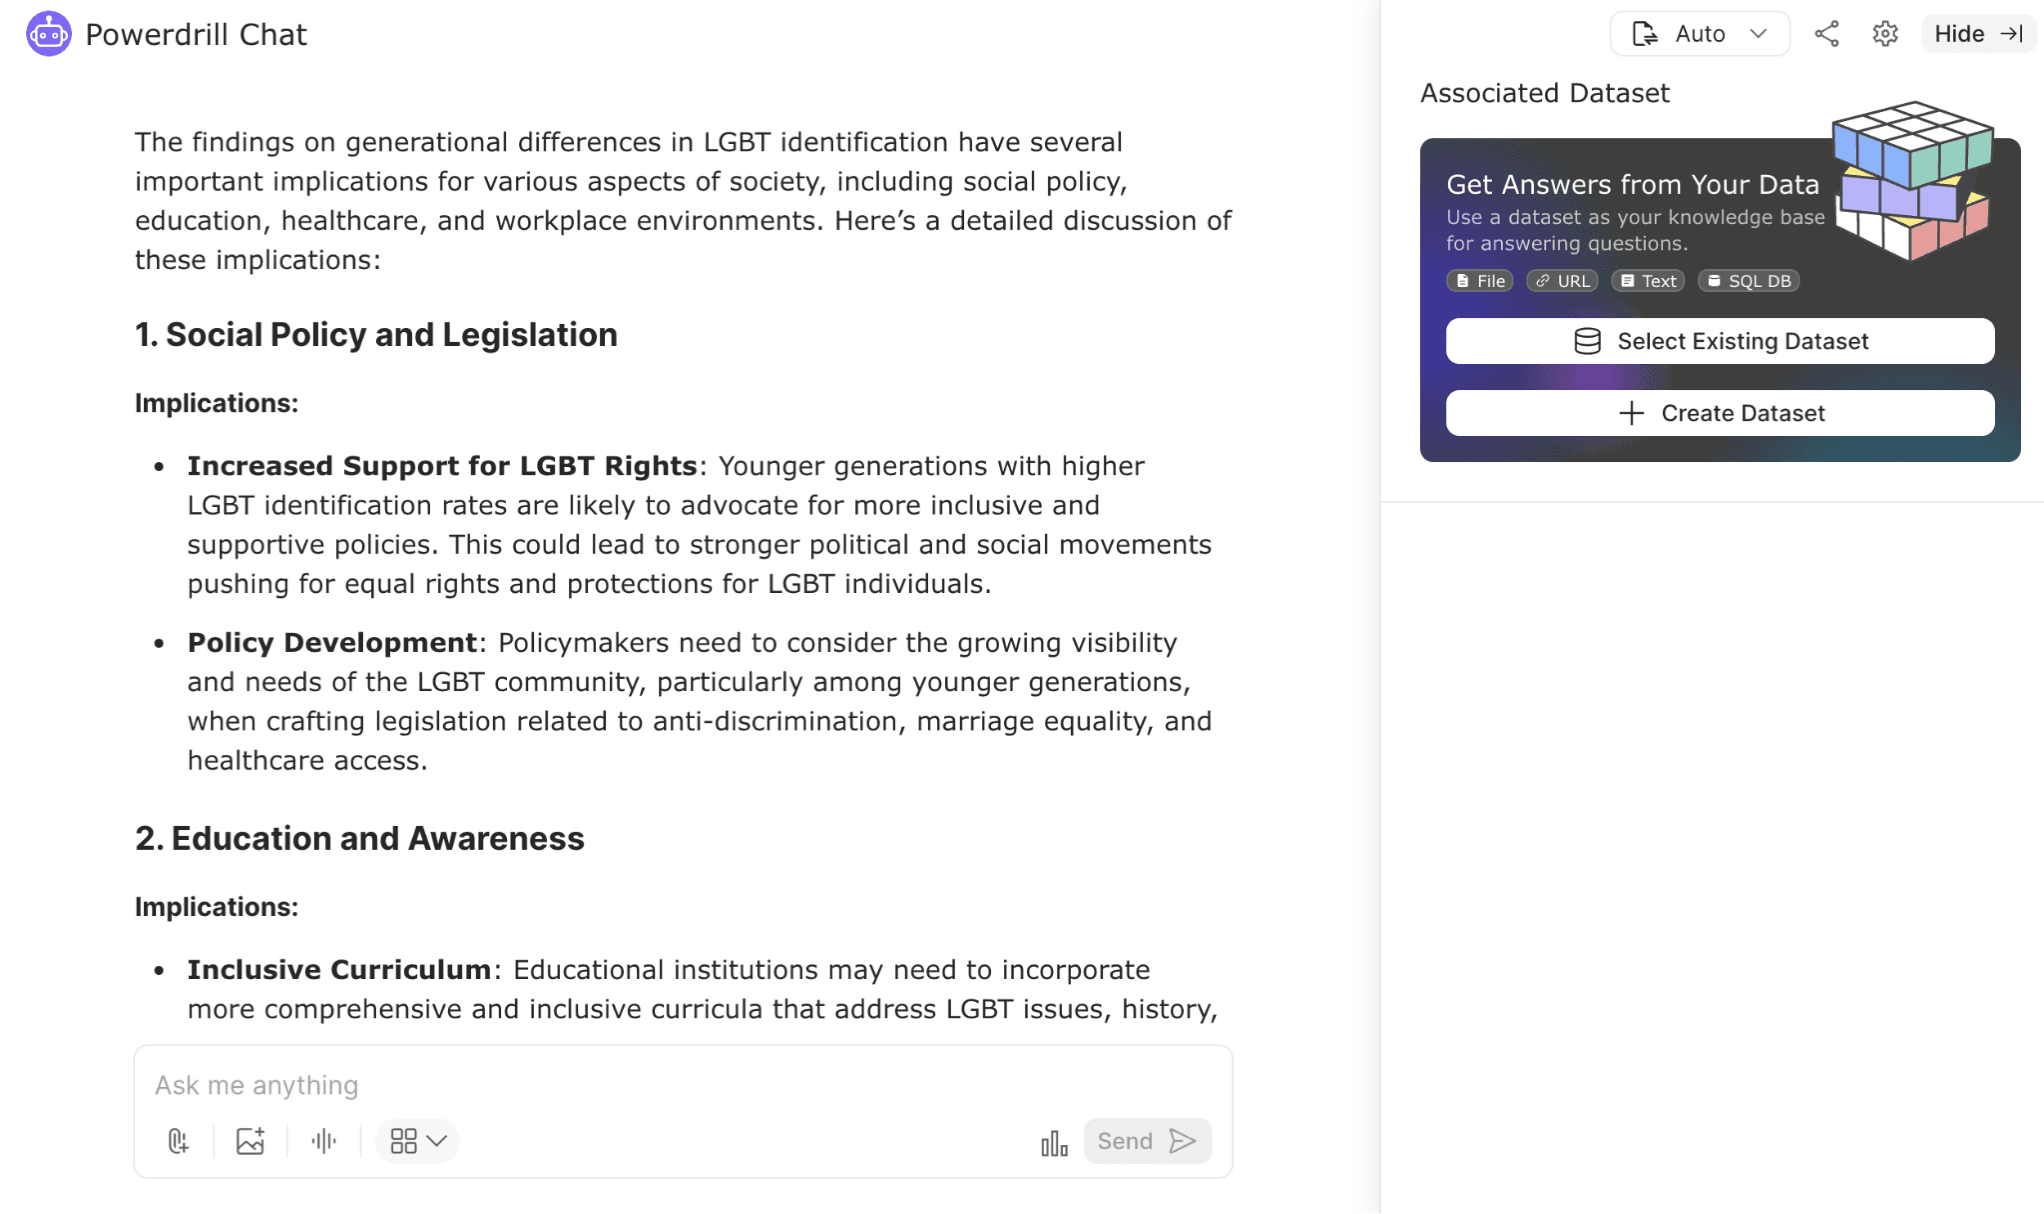
This analysis underscores key generational differences in LGBT identification. Understanding these trends helps illuminate how social attitudes and cultural shifts influence self-identification across different age cohorts, reflecting broader changes in societal norms and acceptance over time.
Step 4: Result Interpretation
We've reached the conclusion of our demographic analysis on LGBT identification across generations, transforming our dataset into meaningful insights. From meticulous data cleaning to a thorough exploration of generational patterns, this analysis demonstrates the power of systematic investigation in uncovering demographic trends.
Our use of Powerdrill to analyze LGBT proportions has revealed significant findings:
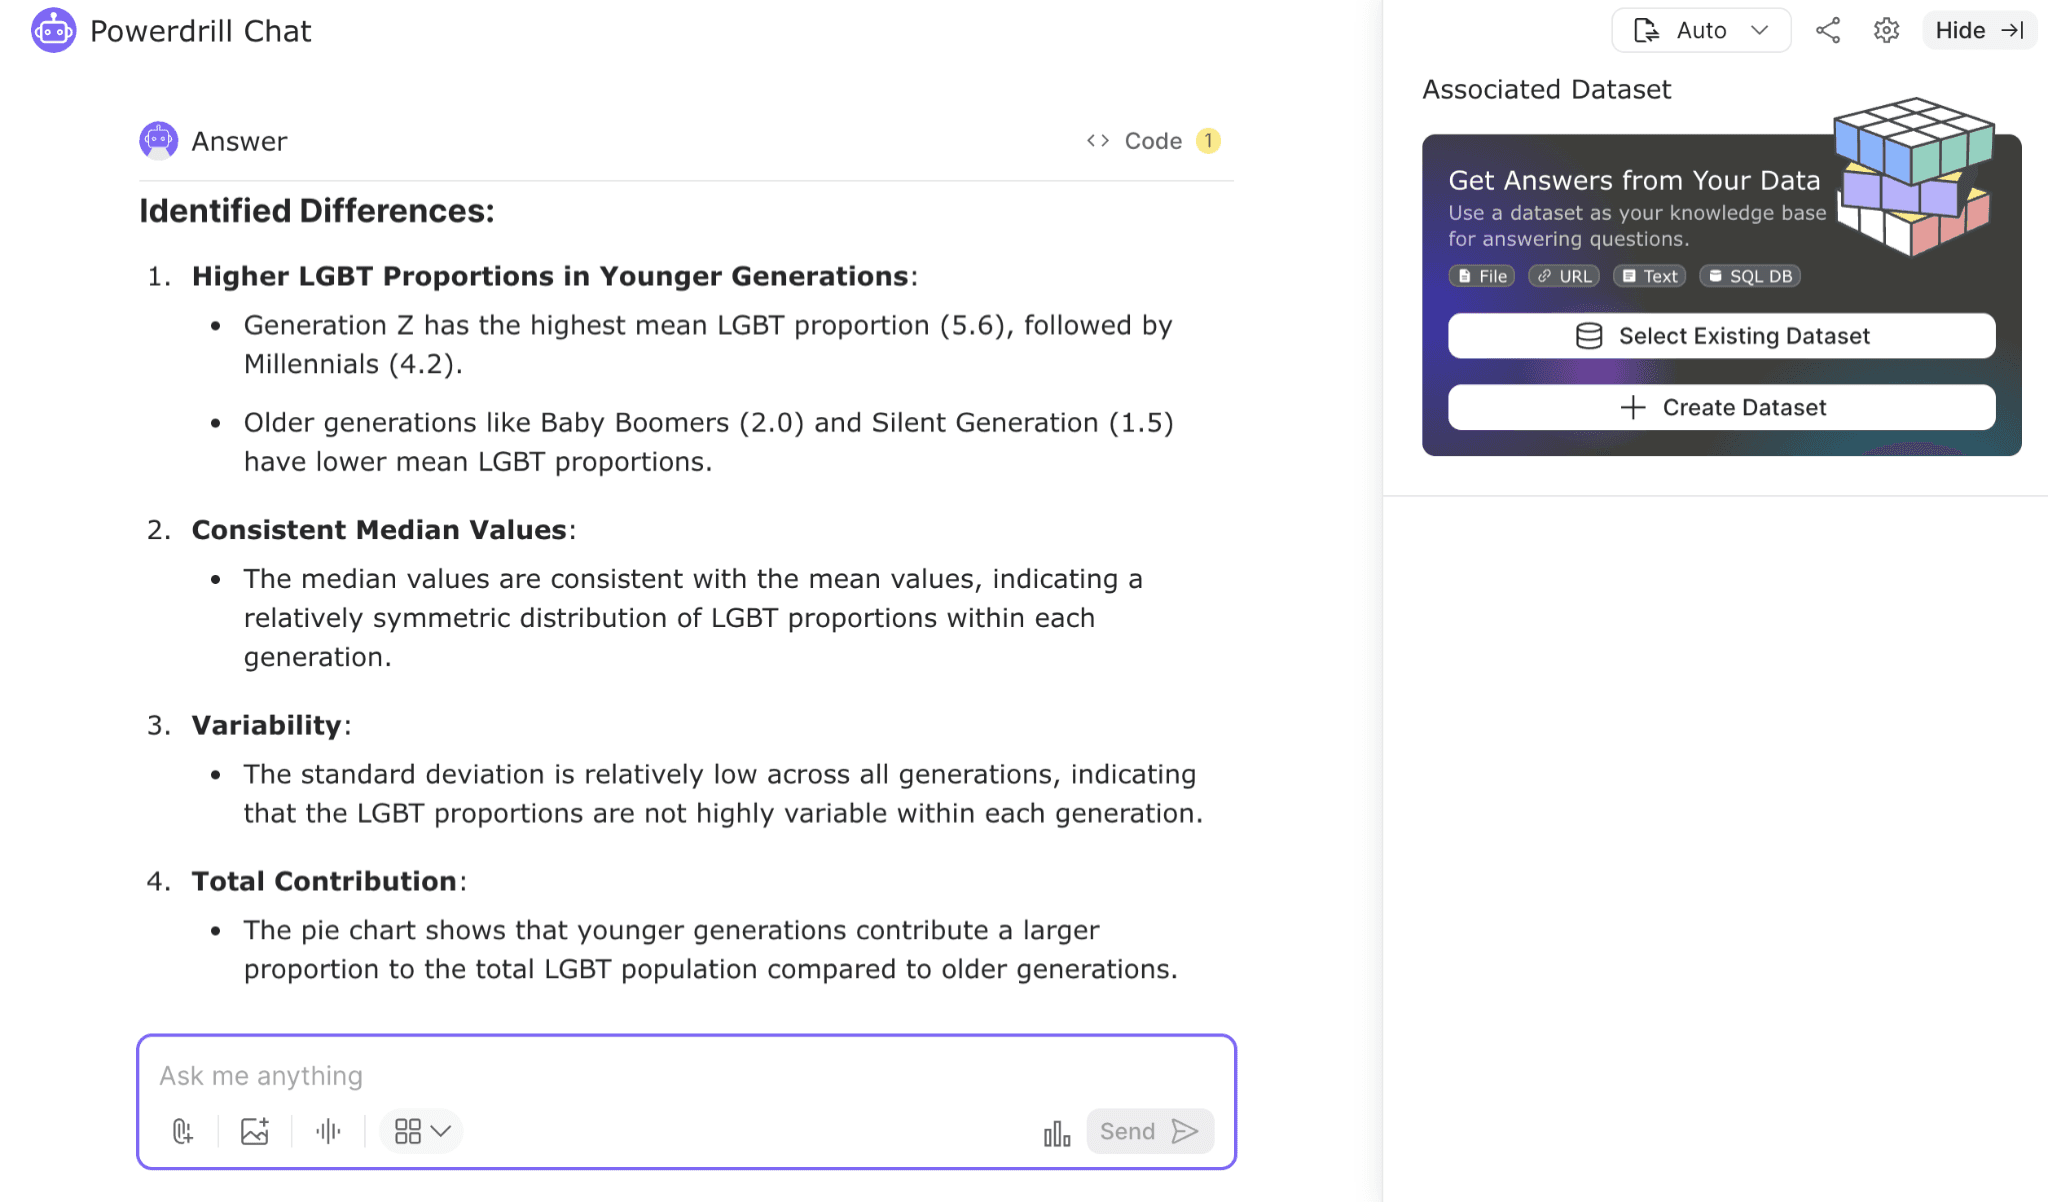
Generation Z displays the highest mean LGBT proportion at 19.7%, reflecting increased acceptance and visibility.
Millennials follow with a notable mean LGBT proportion, indicating the effects of growing societal support during their formative years.
Generation X shows a moderate mean LGBT proportion, highlighting the early stages of societal change regarding LGBT issues.
Baby Boomers and Traditionalists have lower mean LGBT proportions, consistent with the lesser acceptance and greater stigma during their upbringing.
These results highlight key generational differences, showing a clear trend of higher LGBT identification among younger cohorts. This trend likely reflects the progressive shifts in social attitudes, cultural representation, and legal rights over time. Our analysis provides a comprehensive understanding of how generational dynamics shape LGBT identification, offering insights into the evolving social landscape. These findings contribute to a broader understanding of demographic changes and can inform future research and social policies aimed at fostering inclusivity and support for the LGBT community.
Try Now:
Try Powerdrill Discover now, explore more interesting data stories in an effective way!