How to Create a Competitor Analysis Report with AI: 7 Steps
A competitor analysis report is one of those documents everyone agrees is useful and almost nobody keeps current.
The reason is not laziness. It is that the research is scattered across pricing pages, review sites, job postings, and earnings calls. Pulling it together takes a day. Doing it again next quarter takes another day.
This guide covers what belongs in the report and where the evidence comes from. It then gives a seven-step process that makes the second version cheaper than the first.
What a competitor analysis report is
A competitor analysis report is a document that compares your offering against the alternatives your buyers are actually considering, on the dimensions they actually weigh.
Two words in that sentence do the work. Actually considering rules out the competitors you find intimidating but your buyers have never heard of. Actually weigh rules out the feature comparisons nobody reads.
The US Small Business Administration frames the purpose plainly. Competitive analysis, in its words, "helps you learn from businesses competing for your potential customers." The SBA calls this "key to defining a competitive edge that creates sustainable revenue."
Note what that framing leaves out. A competitor analysis report is not a scorecard where you win. It is a map of where you sit.
What goes in one
The SBA's guidance is a good backbone because it is specific about dimensions rather than format. It says your analysis "should identify your competition by product line or service and market segment," then assess the competitive landscape.
| Dimension | What you are looking for |
|---|---|
| Market share | Who holds it, and which direction it is moving |
| Strengths and weaknesses | On the dimensions buyers weigh, not all dimensions |
| Window of opportunity | Timing, and what closes it |
| Importance of your target market to them | Whether they will defend it |
| Barriers to entry | What stops you, and what stops the next entrant |
| Indirect competitors | Substitutes that solve the same problem differently |
That last row is the one most reports skip. The SBA flags it directly, warning about "indirect or secondary competitors who may impact your success."
Three factors round out the picture in the SBA's framing. Those are level of competition, threat of new entrants, and the effect of suppliers and customers on price.
Where the evidence comes from
Every dimension above needs a source. These are the ones that hold up when challenged.
- Pricing pages. Read them yourself on a stated date. Pricing claims age faster than feature claims.
- Documentation and changelogs. What a company ships tells you more than what it markets.
- Job postings. A competitor hiring six enterprise sellers is telling you where it is going.
- Earnings calls and filings. For public competitors, the only numbers with consequences attached.
- Your own win-loss notes. The single most underused input, and the only one your competitors cannot read.
- Review sites and community threads. Useful for direction, weak for magnitude.
Record the date on everything. A competitor analysis report without dates is unmaintainable, because six months later you cannot tell what needs rechecking.
How to create a competitor analysis report with AI
Seven steps. The first three set up the work, and the rest is assembly and review.
Step 1: Define the comparison set
Start by naming who is in and who is out, with a reason for each.
Pull the list from your actual pipeline, not from an industry report. Lost-deal notes, sales call recordings, and support tickets all name competitors. So do the search queries bringing people to your site.
Cap it at five direct competitors plus two indirect ones. Larger sets produce reports that get skimmed instead of read.
Write the exclusion reasons down. "We left out X because it serves a different segment" is a sentence you will need when someone asks why X is missing.
This list is also the part most likely to be wrong on the first attempt. Sales usually names a different set than marketing does. That disagreement is worth surfacing before you research anything.
Step 2: Fix the dimensions before you gather anything
Decide what you are comparing on, then stop. Adding dimensions mid-research is what turns a two-hour job into a two-day one.
Six to eight dimensions is the working range. Use the SBA list above as a starting point and adapt it to what your buyers ask about in the last call before they sign.
For each dimension, write down what evidence would settle it. "Pricing" is not a dimension. "Entry price for a five-person team, from the public pricing page" is.
This step is where AI helps least and matters most. The dimensions encode your judgment about what buyers care about, and that judgment is yours.
Step 3: Gather sources into one place
Now collect. Pricing pages, docs, filings, and your own notes go into a single workspace rather than a folder of bookmarks.
This is the step where the day disappears. Each source is a different format, and reading them one at a time is why the report never gets refreshed.
Pointing an AI workspace at the whole set changes the shape of the work. You ask a question once and get an answer spanning every source, rather than opening fifteen tabs and taking notes.
The requirement is traceability. An answer you cannot trace back to a page is not usable here. The first challenge you get will be about a number.
Step 4: Fill the matrix, one dimension at a time
Work across competitors within a dimension, not down the list of competitors.
Doing all pricing at once, then all positioning, keeps your standard consistent. Going competitor by competitor produces a matrix where the first entry is generous and the last is thin.
For each cell, record the claim, the source, and the date. Three fields, every time.
Leave cells empty when you do not know. An honest gap is more useful than a confident guess, and it tells the next person where to pick up.
Be careful with claims phrased as absences. If you are about to write that a competitor cannot do something, check their documentation first. A capability that shipped last month is the fastest way to lose credibility with a technical reader.
Step 5: Write the finding before the analysis
Look at the filled matrix and write one sentence about what it shows.
If you cannot write that sentence, the matrix is not finished or the dimensions were wrong. Either way, better to find out now.
Then write three to five supporting observations. Each should point at specific cells. "Two of five competitors moved to usage-based pricing this year" is an observation. "The market is changing" is not.
The same discipline that governs a good executive summary slide applies here: conclusion first, evidence second.
Step 6: Add the implications, with owners
A competitor analysis report that stops at description gets read once and filed.
For each finding, write what it means for a specific team. Pricing moves imply a pricing decision. Hiring patterns imply a roadmap question. Positioning shifts imply a messaging review.
Attach a name and a date to each one. Findings without owners do not become decisions.
Keep this section short. Three implications people act on beat ten they skim.
Resist the pull toward reassurance here. A report whose implications are all comfortable is usually a report whose dimensions were chosen to produce that result.
Step 7: Date it and schedule the refresh
Put the date at the top, not the bottom. Readers need to know how stale the report is before they read it, not after.
Then schedule the next pass. Quarterly works for most markets, monthly for fast-moving ones, and event-driven for markets where a single launch resets everything.
The refresh is where the setup pays off. If your sources are in one place and your dimensions are fixed, the second competitor analysis report takes a fraction of the first.
A template you can reuse
Five sections, in this order.
Scope: Who is in the comparison set, who is out, and why. Date of this version.
The finding: One sentence on what the landscape shows.
Matrix: Competitors as rows, dimensions as columns, each cell carrying a claim, source, and date.
Implications: Three to five, each with an owner and a date.
Sources: Every page you read, with the date you read it.
Keep the matrix in whatever format your team already opens. A report that requires a new tool to read is a report nobody reads.
How often to refresh it
Match the cadence to how fast your market moves, not to your planning calendar.
| Market pace | Refresh | Trigger |
|---|---|---|
| Stable, established category | Twice a year | Planning cycles |
| Normal B2B software | Quarterly | Board or QBR prep |
| Fast-moving, well-funded category | Monthly | Competitor launches |
| Anything with a live pricing war | On event | Any published price change |
Between full refreshes, keep a running log of what you notice. Small observations recorded as they happen make the next version much faster to write.
A shared channel works fine for this. The format matters less than the habit of writing things down when you see them.
Direct versus indirect competitors
Most reports handle direct competitors well and indirect ones badly, which is backwards. Direct competitors are the ones you already watch. Indirect ones are where the surprises come from.
An indirect competitor solves the same problem with a different shape. For a reporting tool, that is a spreadsheet and a Friday afternoon. For a scheduling product, it is an email thread. Neither shows up in a category comparison.
Two tests identify them. First, when a deal is lost to "no decision," what did the buyer do instead? Second, what were people using before your category existed?
The answers are usually unglamorous, which is why they get left out. They are also where a large share of your addressable market currently sits.
Give indirect competitors their own short section rather than squeezing them into the matrix. The dimensions that matter for them are different, and forcing them into the same grid flattens the insight.
Turning the report into a recurring asset
A competitor analysis report written once is a research project. Written four times, it becomes a trend line, and the trend line is worth more than any single version.
Three habits make that possible.
Keep the dimensions stable. Changing them between versions destroys comparability, which is the whole point of doing it again. Add a dimension only when something genuinely new appears, and note when you added it.
Keep the old versions. The interesting question at version four is not "where do we sit" but "what moved." That question needs the earlier snapshots to answer.
Keep the sources in the same place. If the pricing pages, filings, and internal notes stay in one workspace between runs, the refresh becomes a re-read rather than a re-gather. That is the difference between a day and an hour.
Mistakes that make the report useless
- Comparing on your strengths. If every dimension favors you, you chose the dimensions wrong.
- Treating marketing copy as fact. A feature on a website is a claim, not a capability.
- Ignoring indirect competitors. The SBA warns about this for a reason. Spreadsheets beat a lot of software.
- No dates. An undated report cannot be maintained or trusted.
- Too many competitors. Five direct is plenty. Twelve produces a document nobody finishes.
- No implications. Description without consequence is trivia.
- Writing it once. The value is in the trend across versions, not in any single snapshot.
Where AI actually saves the time
Be specific about which part gets faster, because the honest answer is not "all of it."
Judgment does not get faster. Choosing the comparison set, picking the dimensions, and deciding what a pattern means are yours.
Gathering and cross-referencing does get faster, and that is where most of the day goes. Pointing one workspace at every pricing page, doc set, filing, and internal note turns fifteen sequential reads into one question.
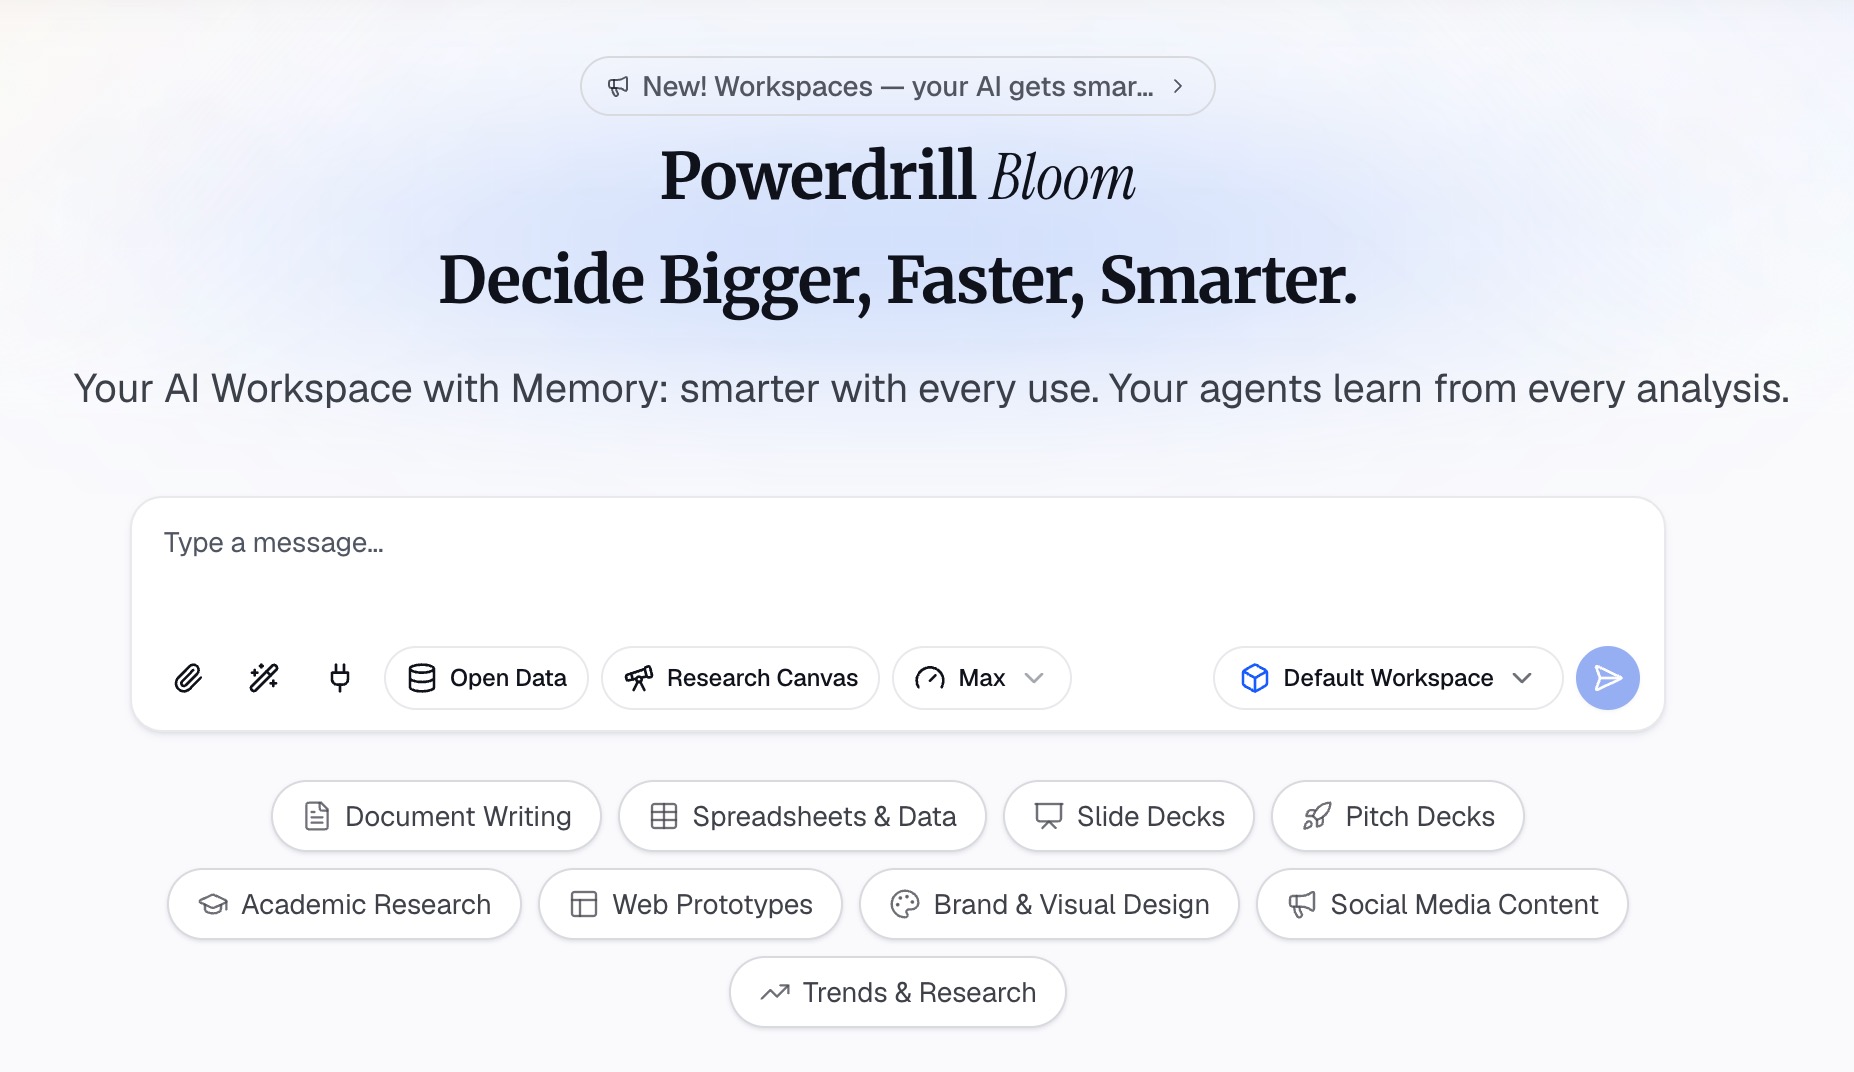
Powerdrill Bloom is built for that middle step. Ask across your documents and databases in natural language, and every number comes back with the page, the row, and the figure behind it. Its plan descriptions name this use case directly. The Premium tier is listed as built for finance, market, competitor, product, and growth analysis.
If your inputs are already tabular, our guide to generating a competitor benchmark report from spreadsheet data covers the numbers-first version of this work. For the upstream research, market research with agent skills covers how to get the raw material together.
Frequently asked questions
What should a competitor analysis report include?
A comparison set with stated inclusion rules, and six to eight dimensions. Then a matrix where each cell carries a claim and its source, a one-sentence finding, and implications with owners. Date everything.
How many competitors should I include?
Five direct competitors and two indirect ones is a practical ceiling. The SBA specifically flags indirect or secondary competitors as ones that can affect your success, so leave room for them.
Where do I find reliable competitor data?
Pricing pages, product documentation, changelogs, job postings, and public filings are the strongest sources. Your own win-loss notes are the most valuable and the most overlooked.
How is this different from a competitive benchmark report?
A benchmark report compares measurable metrics, usually from data you already hold. A competitor analysis report is broader, covering positioning, pricing, and strategy alongside the numbers. Our guide to turning competitor data into a benchmarking report covers the metrics-only version.
How often should I update it?
Quarterly suits most B2B software markets. Move to monthly in fast-moving categories, and refresh on event when a competitor changes published pricing.
Sources: US Small Business Administration, Market research and competitive analysis. Product plan details read from vendor pages on September 21, 2026.