How to Turn Competitor Data Into a Benchmarking Report (Step-by-Step)
Collecting competitor data is the easy half. You end up with a spreadsheet of prices, plan limits, feature ticks and headcount guesses. It still cannot answer the one question that matters: are we ahead or behind?
A benchmarking report answers that. It puts your number in a peer set and says where you sit.
Two things decide whether yours holds up. Who is in the peer set, and whether you compared against an average or a distribution.
This guide covers what to settle first, the three manual routes, and where each one stops working.
What you need before you start
You need a peer set you can defend in one sentence. "Tools a buyer would shortlist alongside us at the same budget" is a defensible definition. "The eight biggest names" is not.
You need one row per competitor and one column per attribute, with the attribute defined. A column called "AI features" is a coin flip. A column called "generates slides from an uploaded file" is a fact.
You also need a captured-on date for every figure. Prices and plan limits change, and a benchmarking report without dates rots silently.
Two decisions come first.
What you are comparing. Price, capability, or outcome. These need different peer sets, and mixing them in one table is the most common structural mistake.
Whether you rank or score. Ranking needs a distribution. Scoring needs weights, and weights need someone to own them.
One habit saves the most rework. Record the source URL beside every cell, not in a separate notes tab.
Why the comparison is the hard part
Most benchmarking exercises compare a number to a peer average. That is the weakest possible reading of the data.
An average tells you the middle. It does not tell you whether the middle is crowded or whether you are near an edge.
Percentile rank does. PERCENTRANK.INC returns where a value sits inside a set. That gives you the sentence you actually want: our price is at the 30th percentile of the shortlist.
Quartiles give the bands. QUARTILE.INC splits the peer set into four, which is usually enough resolution for a report someone reads once.
There is a size trap in this that catches people out. The exclusive percentile variants cannot compute extreme percentiles on small samples.
Microsoft documents the behaviour for PERCENTILE.EXC. It "will interpolate when the value for the specified percentile lies between two values in the array," and returns a #NUM! error when it cannot.
With a peer set of eight, the 95th percentile is not computable that way. Use the inclusive variants for small sets, and state which you used.
Normalisation matters just as much. Per-seat and per-workspace pricing are not comparable until you fix a team size. Annual and monthly prices are not comparable until you pick one basis.
How to do it manually
Option 1: Build the attribute matrix first, rank second
Get the table right before any arithmetic. One row per competitor, one column per attribute, one definition per column.
Then pull your own values in with XLOOKUP so your row is generated rather than typed. Typed values drift out of date faster than anything else in the file.
Only then rank. Add a percentile column per numeric attribute so every claim in the report has a position behind it.
The ceiling is that a matrix is not a conclusion. It shows twelve columns and no priority.
Option 2: Segment the peer set before you average anything
A single blended average across a mixed set is where benchmarking goes wrong. Enterprise-only tools and self-serve tools do not price against each other.
Split the set and use AVERAGEIFS per segment. Report each segment separately rather than merging them.
Watch the sample size as you split. Four competitors in a segment is an anecdote, and a percentile on four points should be labelled as directional.
The limit here is judgement. The tool computes whatever segments you define, and defining them badly produces a confident wrong answer.
Option 3: Keep a provenance tab
One row per data point: attribute, competitor, value, source URL, captured date.
This is what makes the report re-runnable next quarter. It is also what lets you answer "where did that come from" without redoing the research.
The limitation is that provenance does not refresh itself. Every figure has a shelf life, and someone has to check them again.
The shared ceiling. All three assume the attributes are comparable. When one vendor publishes limits and another publishes nothing, the honest cell is "not published" rather than a guess.
Where the manual route slows down
The first report takes a week. The second takes almost as long, because the underlying figures moved and nobody logged which ones.
Prices change on their own schedule. So do plan limits, seat minimums and packaging, and each change silently invalidates one cell.
Feature columns decay faster than price columns. A capability that was absent last quarter ships without an announcement, and your table now says something untrue about a competitor.
That is the real risk in benchmarking work. A stale "no" is not a neutral error. It is a claim about someone else's product that you cannot support.
There is a second cost that shows up at presentation time. Someone asks why a competitor was included, and if the peer-set rule was never written down, the whole report becomes negotiable.
How to build the report with Powerdrill Bloom
Step 1: Upload your competitor spreadsheet
Upload the matrix you collected, plus your own metrics file if they are separate. Powerdrill Bloom profiles the columns on arrival, so blank cells, mixed units and duplicated competitor names surface before any ranking is computed.

Step 2: Describe the comparison in natural language
State the peer set and the basis rather than building formulas. Say which competitors belong to which segment, which price basis you are using, and which attributes are numeric.
Then ask the questions that catch the errors. Ask which cells are missing a source or a date, and which attributes are recorded in mixed units. Then ask where your own row sits as a percentile within each segment.
Step 3: Export the chart, report, or deck
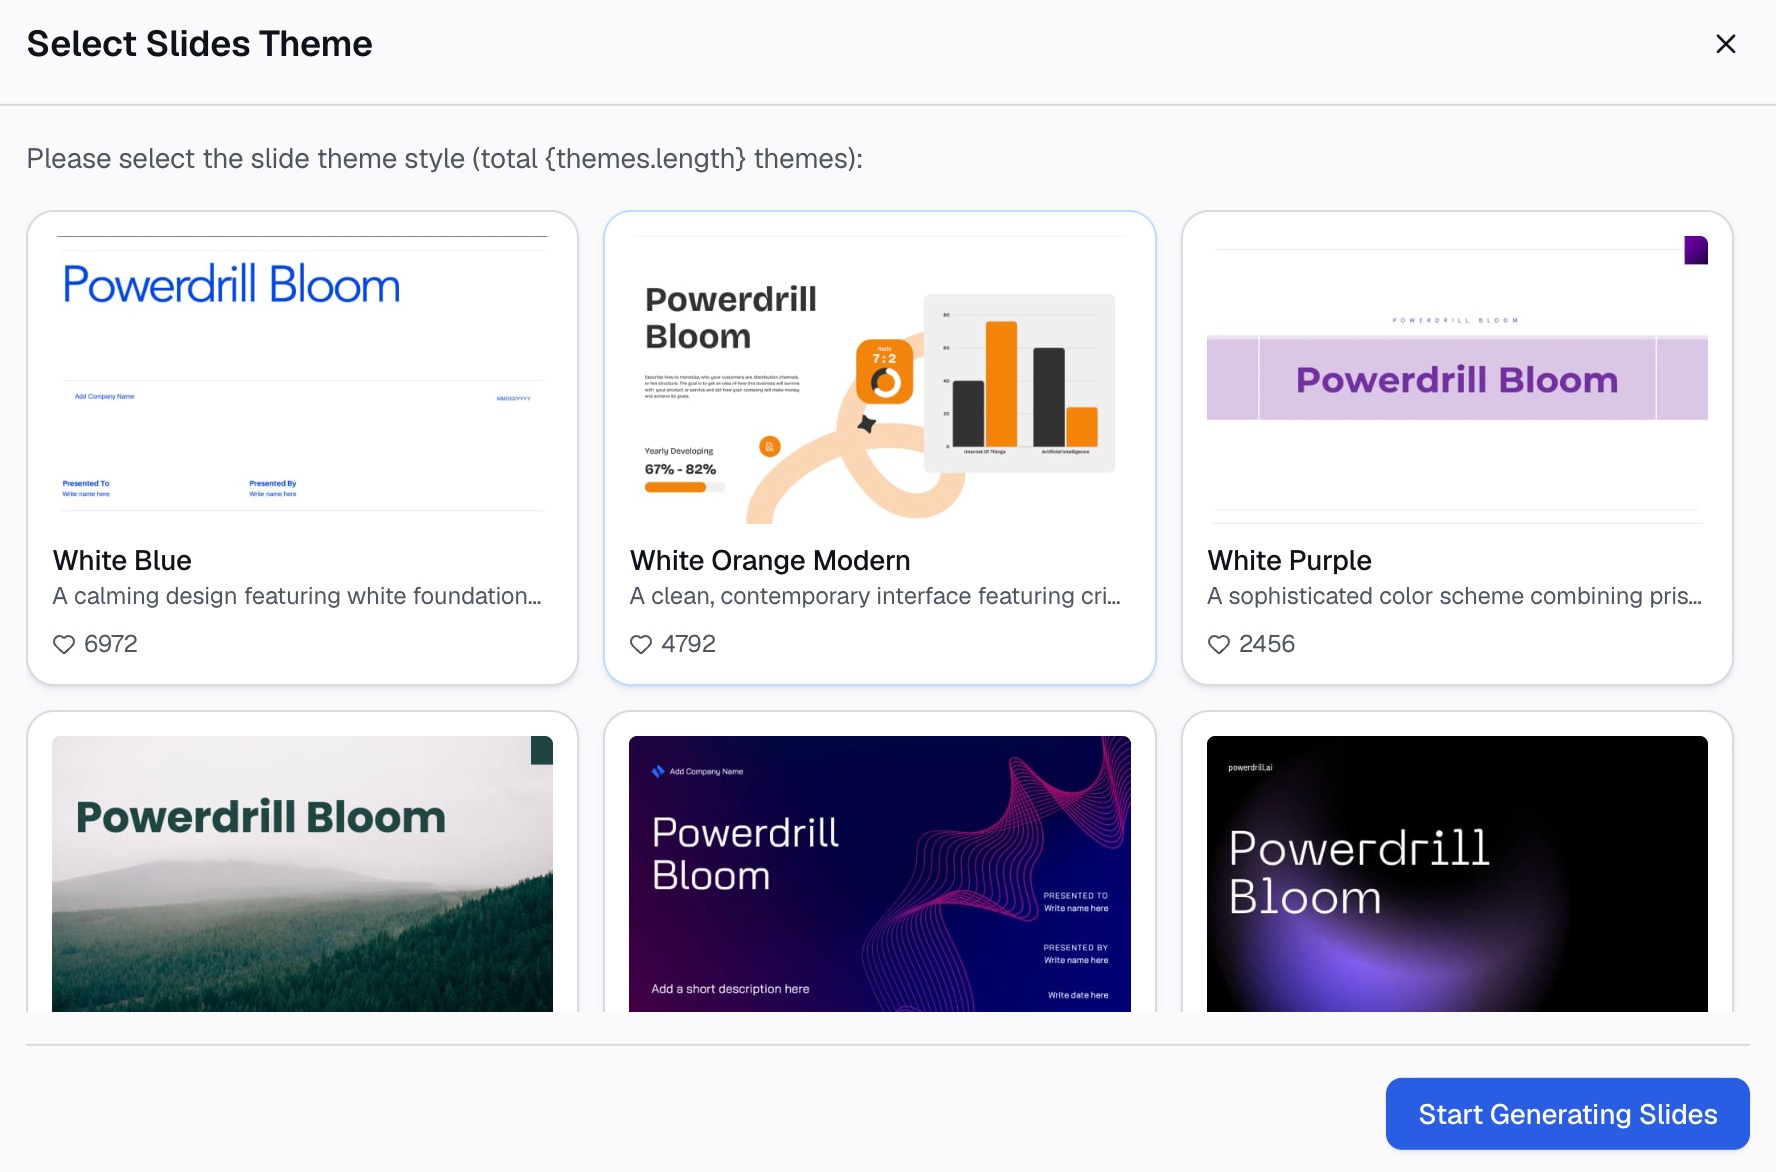
Take out the ranked table, a positioning chart, or slides that carry the peer-set definition alongside the results.
Why this beats rebuilding the matrix by hand
| Manual route | Powerdrill Bloom | |
|---|---|---|
| Mixed price bases in one column | Normalise by hand | State the basis and ask |
| Percentile position per attribute | Formula per column | Ask for the ranking |
| Cells with no source or date | Spot-check the tab | Surfaces on upload |
| Re-running next quarter | Rebuild the sheet | Swap the file, keep the rules |
The third row is the one that protects you. An unsourced cell in a benchmarking report is a liability, and finding those manually is exactly the check that gets skipped.
Common mistakes
Picking the peer set by brand size. Buyers shortlist by budget and job to be done, not by market cap. Define the set the way your buyer would.
Comparing to an average instead of a distribution. The average hides whether you sit in a crowd or at an edge. Report a percentile and the peer count together.
Leaving prices on different bases. Per seat, per workspace, monthly and annual cannot share a column. Fix a basis and note it.
Recording an absent feature as a permanent no. Capabilities ship quietly. Date every capability cell, and re-check before you publish a claim about a competitor.
Using exclusive percentile functions on a small peer set. Extreme percentiles are not computable that way and return an error. Use the inclusive variants and say so.
Blending segments to get a bigger sample. A larger set that mixes enterprise and self-serve is worse than a small honest one. Split and label.
Reporting a score with unstated weights. A weighted score is an opinion in numeric clothing. Publish the weights or publish the ranks, and pair the result with the leading and lagging indicators you actually manage against.
Conclusion
Define the peer set in one sentence, define every attribute column, normalise the price basis, and report percentiles rather than averages. That is what makes a benchmarking report survive its first review.
The expensive part is not the analysis. It is that every cell has a shelf life, so the report has to be re-runnable rather than rewritten.
If your quarter goes on rebuilding that matrix, try Powerdrill Bloom on the spreadsheet you already have. See also the roundup of AI tools for competitive benchmarking, plus the AI competitor analysis and AI competitive intelligence pages.
Frequently asked questions
What should go into a benchmarking report?
A defined peer set, one column per defined attribute, your own row generated from your data, and a percentile position per numeric attribute. Every cell needs a source and a captured date.
How many competitors do I need?
Enough that a percentile means something, so eight to twelve in a segment is a reasonable target. Below five, label the result as directional rather than statistical.
Should I compare against the average or the median?
Neither on its own. Report where you sit as a percentile, since that answers the actual question and survives a skewed peer set.
Where can I get competitor data I can defend?
Published pricing pages, official product documentation and public filings are the most defensible, because they are attributable and dated. Record the URL and the date beside every figure.
How often should the report be refreshed?
Quarterly for prices and packaging, and sooner for capability claims. Capabilities change without announcements, and a stale absence is the error that damages credibility.