

Financial markets rarely move in straight lines. Over the past year, I’ve spent a great deal of time analyzing how structural forces—especially the commercialization of artificial intelligence—are reshaping the outlook for technology equities.
While narratives around AI dominate headlines, the real question investors care about is simple: how much of that innovation actually turns into earnings growth?
To answer that, I examined macro conditions, earnings revisions, prediction-market sentiment, and historical market cycles using structured data analysis workflows powered by Powerdrill Bloom.
After synthesizing these signals, my high-conviction base case is that the Nasdaq-100 Index (NDX) closes around 29,800 by the end of 2026, with a modest upside skew if AI revenue growth broadens across the sector.
1. My Core Prediction: 29,800 by Year-End 2026
Point target:
Nasdaq-100 close (Dec 31, 2026): ~29,800
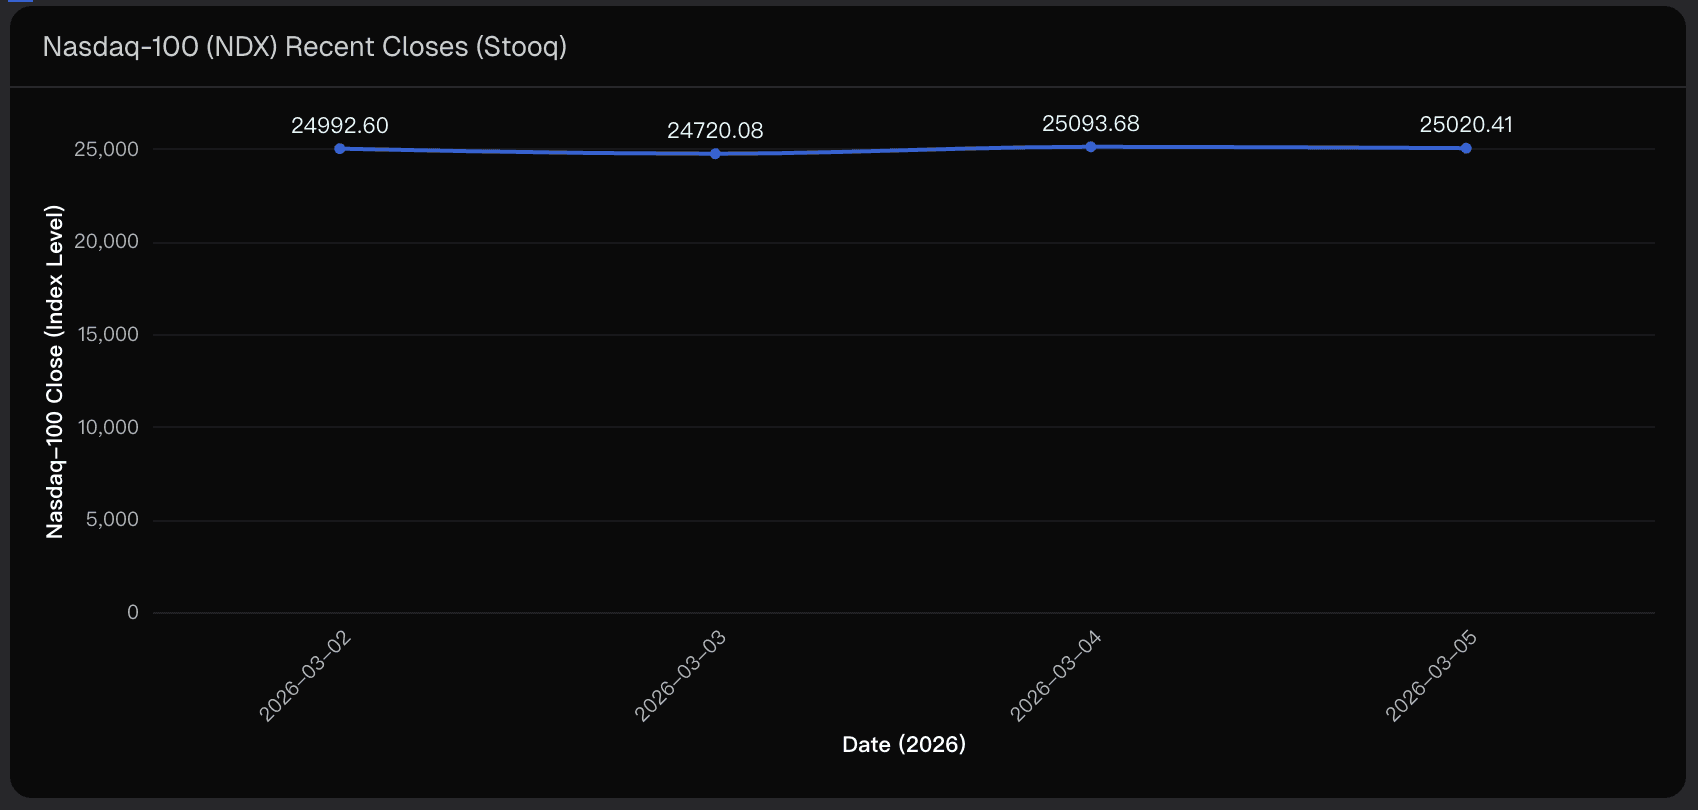
A recent reference level showed the index near 25,020 on March 5, 2026, implying roughly 18–20% potential upside over the remainder of the year. Historically, that magnitude of annual return is consistent with periods where earnings growth remains solid and financial conditions gradually ease.
Likely Market Path in 2026
Q2 2026 – Volatile but upward trend
Investors continue funding large AI infrastructure investments while demanding clearer signs of monetization.
Q3 2026 – Trend confirmation phase
If forward earnings revisions broaden beyond the largest technology companies, momentum could strengthen.
Q4 2026 – Year-end acceleration or valuation reset
The index could either rally sharply on improved liquidity and buybacks—or face valuation pressure if real yields rise again.
Overall, my baseline assumption is a steady but uneven climb toward the high-20k range.
2. Market Sentiment vs. Fundamentals
Prediction-market platforms often provide an interesting real-time view of crowd expectations. Current range-based markets suggest the most active pricing sits in the mid- to high-20k region, with additional interest around the low-30k range.
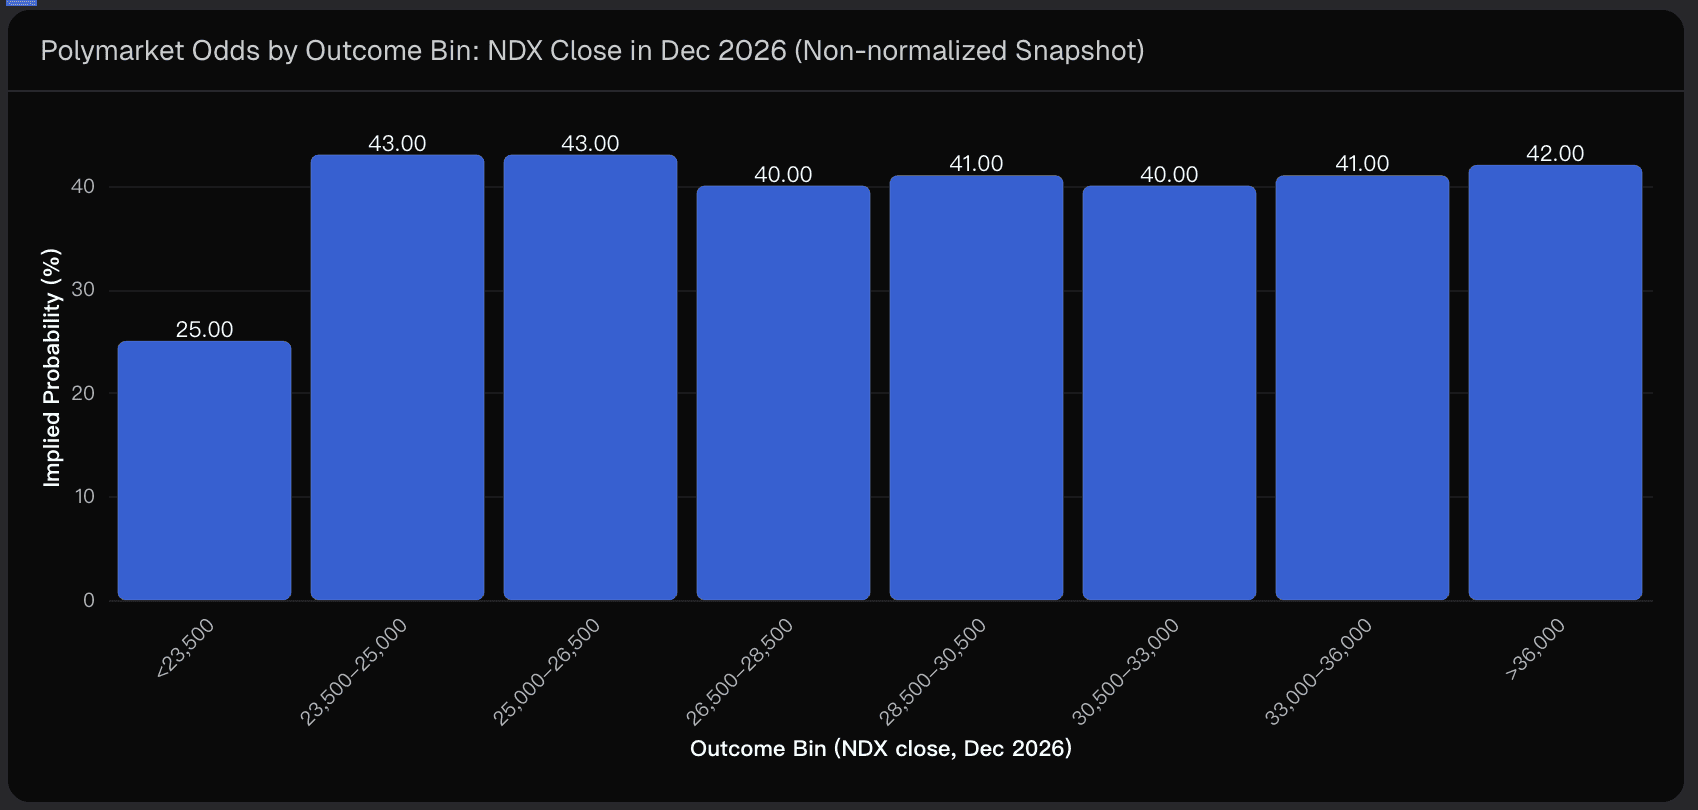
However, these bins are not normalized probabilities, meaning multiple ranges can simultaneously appear heavily priced.
To create a more practical outlook, I combine sentiment signals with macro and earnings modeling.
My Normalized Scenario Distribution
Scenario | Nasdaq-100 Range | Probability |
|---|---|---|
Bear Case | Below 27,000 | 20% |
Base Case | 27,000 – 32,000 | 55% |
Bull Case | Above 32,000 | 25% |
Median outcome: roughly 28,000–30,000, aligning closely with my 29,800 target.
This approach treats market sentiment as a starting signal, then adjusts it based on macro liquidity, earnings revisions, and valuation dynamics.
3. The Three Forces Likely to Drive the Nasdaq-100
1. AI Monetization
The key question for 2026 is no longer whether AI works—it’s whether AI generates sustainable cash flow.
Important revenue channels include:
AI-powered cloud services
Enterprise AI software subscriptions
Usage-based inference pricing
Automated workflow platforms
If companies can convert AI investment into scalable revenue streams, earnings revisions could accelerate quickly across the index.
2. Liquidity and Interest Rates
Technology stocks behave like long-duration assets, meaning their valuations are extremely sensitive to real interest rates.
Two regimes matter most:
Supportive environment
Gradual rate cuts
Lower real yields
Tight credit spreads
Negative environment
Inflation surprises
Rising term premiums
Liquidity tightening
My base case assumes a soft-landing macro environment, where growth slows but remains positive.
3. Market Concentration Dynamics
The Nasdaq-100 has historically been driven by a small group of dominant technology companies.
This concentration has two implications:
Positive:
A handful of major winners can push the entire index higher.
Negative:
If leadership weakens, the index can correct sharply.
The key transition for 2026 will be whether the market moves from an AI investment narrative to an AI earnings narrative.
4. Risks That Could Break the Forecast
Even well-supported forecasts carry uncertainty. The biggest risks include:
AI Monetization Disappointment
Adoption remains strong but pricing power weakens, compressing margins.
Higher Real Interest Rates
Rising bond yields reduce valuation multiples across technology stocks.
Narrow Earnings Growth
If only a few companies deliver strong results, index-level gains may stall.
Regulatory Pressure
Antitrust scrutiny, export restrictions, or AI regulation could disrupt leading companies.
Tail Risks
Geopolitical shocks affecting supply chains
Liquidity crises in credit markets
Major AI safety or regulatory events
Monitoring earnings revision trends, real yields, and AI pricing power will be critical throughout 2026.
Conclusion
After combining macro analysis, earnings expectations, and prediction-market sentiment, my base-case forecast places the Nasdaq-100 near 29,800 by the end of 2026.
The index still benefits from powerful structural drivers—especially the commercialization of AI—but the path forward will depend on whether technology companies can convert massive AI investment into durable revenue growth.
In my research workflow, platforms like Powerdrill Bloom help surface the patterns behind these shifts, making it easier to connect market sentiment, macro signals, and earnings data into a coherent outlook.
Disclaimer: This article is for informational purposes only and does not constitute financial advice.
Related Post

Mar 5, 2026
/
Post by
Sophia

Mar 4, 2026
/
Post by
john

Mar 3, 2026
/
Post by
fox