
Introduction
In the data-driven world of 2025, making sense of numbers is crucial. But raw data alone can be overwhelming. That's where data visualization comes in. It turns complex data into easy-to-understand visuals. But creating these visuals can be time-consuming. And that's where AI tools for graph-making come in.
These tools use AI to simplify and enhance the process. They can create smart charts and AI visualizations in a snap.
In this article, we'll explore the top 6 AI tools for making graphs in 2025. We'll dive into their features, usability, and how they leverage AI.
Whether you're a data analyst, a marketer, or just a data enthusiast, you'll find this guide useful. So, let's get started!

by Andy Vult (https://unsplash.com/@andyvult)
Why AI in Graph-Making is a Game-Changer
AI is revolutionizing many fields, and graph-making is no exception. It's not just about automating the process. It's about making it smarter.
AI can analyze your data and suggest the best chart types for data visualization. It can recognize patterns, uncover hidden insights, and even predict future trends. This level of analysis would take a human hours, if not days.
So, AI doesn't just save you time. It also gives you a deeper understanding of your data. And in today's data-driven world, that's a game-changer.
Criteria for Choosing the Best AI Graph-Making Tools
When choosing an AI tool for graph-making, there are several factors to consider. It's not just about the number of features. It's about how those features can help you achieve your goals.
Here are some key criteria to consider:
Ease of use: The tool should be intuitive and user-friendly.
Range of chart types: The tool should offer a wide variety of chart types to suit different datasets.
Customization options: The tool should allow you to customize your graphs to fit your brand or presentation style.
Integration capabilities: The tool should easily integrate with your existing data sources and software.
Pricing: The tool should offer good value for money, considering its features and capabilities.
Remember, the best tool for you depends on your specific needs and circumstances. So, take the time to explore different options and find the one that fits you best.
1. Powerdrill Bloom – AI-Powered Graphs and Instant Insights
Powerdrill Bloom is an AI-first data exploration and visualization platform that transforms raw datasets into professional graphs and actionable insights with minimal effort. Designed to make data analysis accessible to everyone, Bloom eliminates the need for complex BI setups or coding skills. Users can simply upload their data (Excel, CSV, TSV, and more), and Bloom’s AI agents instantly generate charts, summaries, and trends.

Bloom stands out for its AI Exploration Canvas, where insights are organized into visual cards that can be expanded, refined, or exported. Whether you’re analyzing sales performance, customer behavior, or operational metrics, Bloom’s automated graphing and one-click presentation export make it an essential tool for marketers, business analysts, and decision-makers.
With its multi-agent AI architecture, Bloom doesn’t just create graphs—it proactively detects anomalies, highlights correlations, and suggests new exploration paths. This makes it a true companion for teams that want to move from data to decisions faster.
Key Features and Benefits
AI-Generated Graphs that instantly convert raw data into bar charts, line graphs, scatter plots, and more.
Natural Language Queries let you ask questions like “Which campaign had the highest ROI last quarter?” and get clear, visual answers.
Multi-Agent AI System ensures accurate analysis by handling data cleaning, anomaly detection, and recommendations in the background.
One-Click Presentation Export turns your analysis into polished PowerPoint-ready slides in seconds.
Collaborative Insights allow teams to organize findings into visual cards and share them seamlessly.
Guided Data Exploration helps uncover trends you may have missed, making analysis more proactive than reactive.
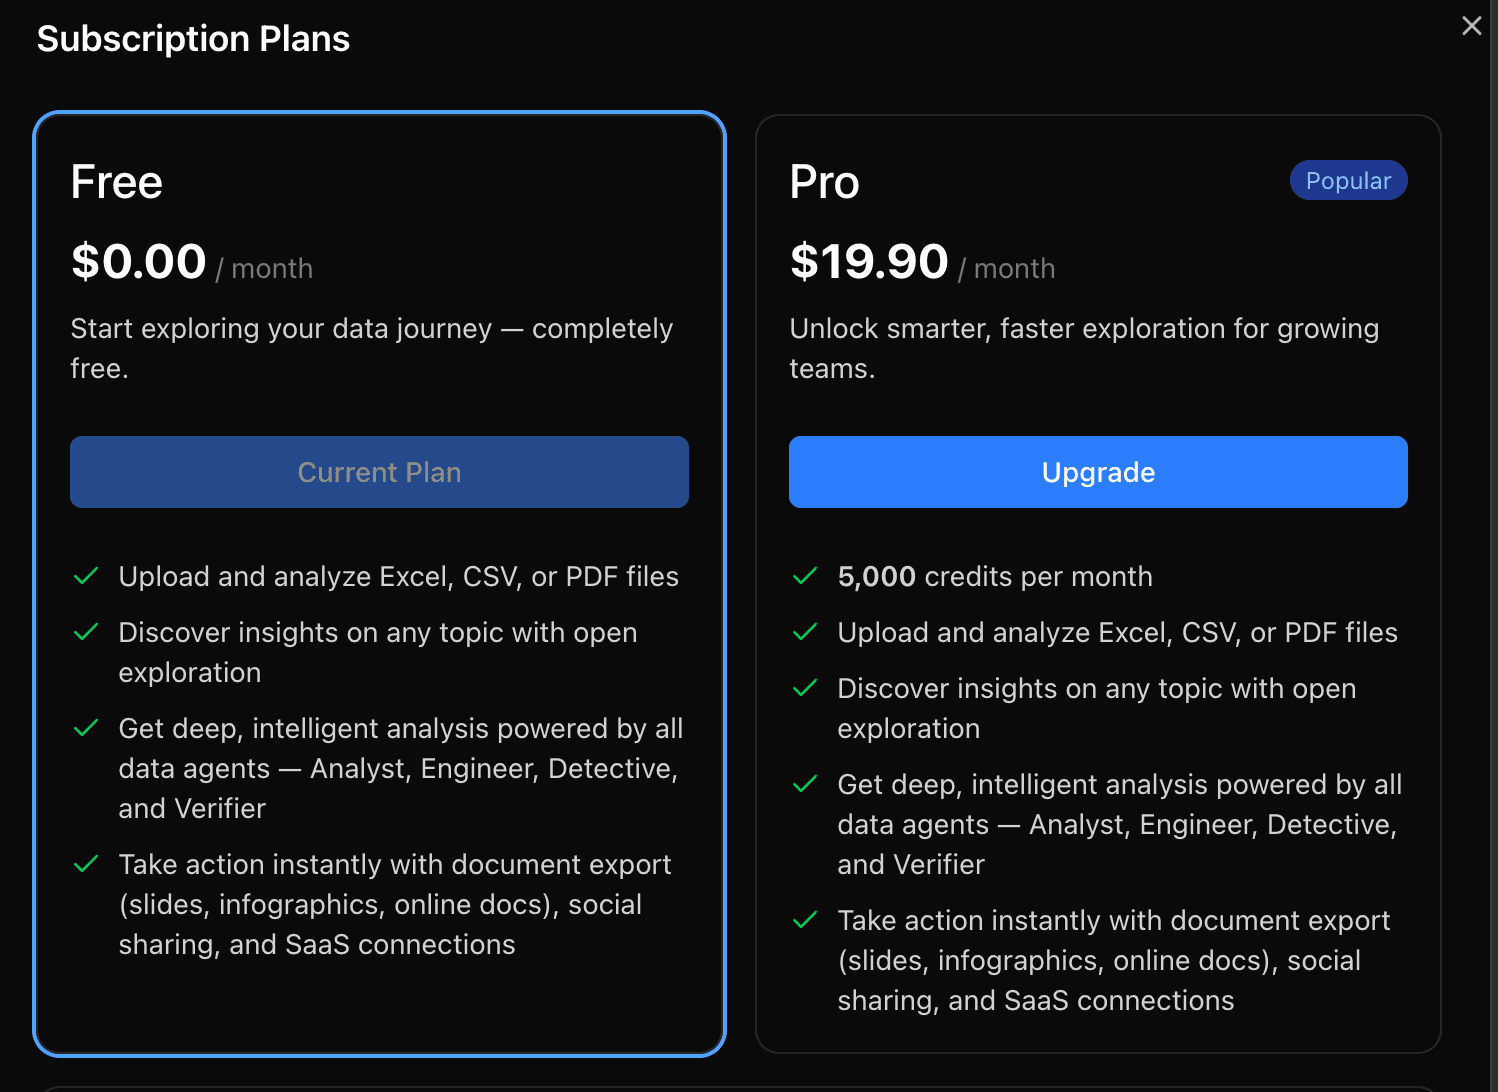
User Experience and Pricing
Users praise Powerdrill Bloom for its intuitive, card-based interface that makes graphing and analysis both fast and enjoyable. Even non-technical users can create meaningful graphs without needing SQL or coding skills.
Powerdrill Bloom offers simple, usage-based pricing with a Free plan to get started and a Pro plan for advanced AI exploration and higher productivity.
2. Lark - Empowering Seamless Team Collaboration
Lark is a versatile all-in-one SaaS platform that enhances team collaboration through a comprehensive set of project management and communication tools. With powerful Gantt chart features integrated into both the Base and Task functionalities, Lark is perfect for teams with diverse project management needs, from simple task tracking to complex workflows.
by Coinstash Australia (https://unsplash.com/@coinstash_au)
The Task feature is designed for those who need to manage tasks quickly and easily. It provides a visual layout for task dependencies and timelines, ensuring you can track progress effortlessly. For more intricate project management, Lark's Base feature offers enhanced task management with deeper customization options, perfect for teams handling large and multifaceted projects.
Whether you're visualizing timelines, tracking task dependencies, or collaborating in real time, Lark keeps everything consolidated in one platform. Its seamless integration of communication tools like Messenger ensures that team members stay updated with real-time notifications about task progress and deadline changes, significantly reducing the risk of missed updates.
Key Features and Benefits
Free Gantt chart tools with task dependencies for easy project planning.
Customizable color settings for better timeline visualization and task differentiation.
Real-time collaboration through integrated communication tools to keep teams aligned.
Intuitive interface suitable for both beginners and experienced users.
Flexible project management setup with Base and Task features to suit various team needs.
User Experience and Pricing
Lark is praised for its user-friendly interface and comprehensive toolset, making it ideal for teams of all sizes. The platform’s free version makes it accessible to any team, while the Pro version at $12 per user per month offers additional features for those needing more advanced capabilities. For larger enterprises, Lark offers a customized Enterprise plan upon request.
3. GraphAI - Revolutionizing Data Visualization
GraphAI is a leading player in the AI graph-making space. It's known for its powerful AI capabilities and user-friendly interface.

by charlesdeluvio (https://unsplash.com/@charlesdeluvio)
The tool uses machine learning to automate the graph-making process. It can analyze your data and suggest the most suitable type of graph. This feature is a real time-saver and helps reduce manual errors.
GraphAI also offers real-time data visualization. This means you can see your data change and evolve in real-time, which is particularly useful for monitoring live data feeds.
Key Features and Benefits
GraphAI offers a wide range of features. Here are some of the key ones:
Automated graph suggestions: GraphAI uses AI to suggest the best type of graph based on your data.
Real-time data visualization: You can monitor live data feeds and see your data change in real-time.
Wide range of chart types: GraphAI offers a variety of chart types, from bar and line charts to more complex scatter plots and heat maps.
These features make GraphAI a versatile tool for all your graph-making needs.
User Experience and Pricing
Users praise GraphAI for its intuitive interface and powerful AI capabilities. The learning curve is minimal, making it a great choice for beginners and experts alike.
As for pricing, GraphAI offers a free trial. After that, you can choose from several pricing plans, depending on your needs. The pricing is competitive, considering the range of features and capabilities offered.
4. ChartMaster AI - Smart Charting Simplified
ChartMaster AI is another top-notch tool in the AI graph-making arena. It's designed to simplify the charting process, making it accessible to everyone.

by Andrea De Santis (https://unsplash.com/@santesson89)
One of the standout features of ChartMaster AI is its use of natural language processing. You can create graphs from verbal or written descriptions, which is a game-changer for those who aren't data experts.
ChartMaster AI also excels in customization. It offers a wide array of customization options for charts and graphs, allowing you to tailor your visualizations to your specific needs.
Key Features and Benefits
ChartMaster AI is packed with features. Here are some of the key ones:
Natural language processing: You can create graphs from verbal or written descriptions.
Customization options: ChartMaster AI offers a wide array of customization options for charts and graphs.
These features make ChartMaster AI a flexible and user-friendly tool for creating smart charts.
User Experience and Pricing
Users love ChartMaster AI for its simplicity and ease of use. The tool's natural language processing feature is particularly praised, as it makes graph-making accessible to non-data experts.
In terms of pricing, ChartMaster AI offers a free version with limited features. For full access to all features, you can choose from several pricing plans. The pricing is reasonable, given the tool's capabilities and features.
5. VisualizeAI - Next-Gen Graph Automation
VisualizeAI is a next-generation tool that's making waves in the AI graph-making space. It's designed to automate the graph-making process, making it faster and more efficient.

by Justin Morgan (https://unsplash.com/@justin_morgan)
VisualizeAI stands out for its real-time data visualization capabilities. It can handle large datasets and generate visualizations in real time, which is a huge advantage for businesses dealing with dynamic data.
Another standout feature of VisualizeAI is its predictive analytics. It uses AI to forecast trends and patterns, adding a predictive element to your graphs.
Key Features and Benefits
VisualizeAI is loaded with features. Here are some of the key ones:
Real-time data visualization: VisualizeAI can handle large datasets and generate visualizations in real time.
Predictive analytics: The tool uses AI to forecast trends and patterns, adding a predictive element to your graphs.
These features make VisualizeAI a powerful tool for businesses dealing with dynamic data.
User Experience and Pricing
Users rave about VisualizeAI's real-time data visualization capabilities. They love how it can handle large datasets and generate visualizations quickly and efficiently.
In terms of pricing, VisualizeAI offers a free version with limited features. For full access to all features, you can choose from several pricing plans. The pricing is competitive, given the tool's capabilities and features.
6. SmartPlotter - Intelligent Graph Creation
SmartPlotter is another AI tool that's making a name for itself in the graph-making world. It's designed to simplify the graph creation process, making it more accessible to non-technical users.

by Justin Morgan (https://unsplash.com/@justin_morgan)
SmartPlotter stands out for its user-friendly interface. It's designed to be intuitive and easy to use, even for beginners. This makes it a great choice for non-technical users who want to create professional-looking graphs.
Another standout feature of SmartPlotter is its customization options. It offers a wide range of customization options, allowing you to create graphs that perfectly fit your needs.
Key Features and Benefits
SmartPlotter is packed with features. Here are some of the key ones:
User-friendly interface: SmartPlotter is designed to be intuitive and easy to use, even for beginners.
Customization options: The tool offers a wide range of customization options, allowing you to create graphs that perfectly fit your needs.
These features make SmartPlotter a great choice for non-technical users who want to create professional-looking graphs.
User Experience and Pricing
Users love SmartPlotter's user-friendly interface. They appreciate how easy it is to use, even for beginners. The customization options are also a big hit, with users loving the ability to create graphs that perfectly fit their needs.
In terms of pricing, SmartPlotter offers a free version with limited features. For full access to all features, you can choose from several pricing plans. The pricing is competitive, given the tool's capabilities and features.
Final Thoughts on AI Tools for Graph-Making
AI tools for graph-making are revolutionizing the way we visualize data. They offer advanced features and capabilities that traditional graph-making tools can't match.
These tools are not just for data analysts or tech-savvy individuals. They're designed to be user-friendly, making data visualization accessible to everyone.
In a world where data is king, these AI tools are invaluable. They can help you make sense of complex data and uncover insights that can drive decision-making.


