How to Make a Project Status Report: Step by Step
To make a project status report, start with one overall rating: green, amber, or red. Then show progress against the plan, budget spent against budget, milestones, risks, and the decisions you need. Keep it to one page or one slide, and send it on the same day every week or two.
This guide covers what to include, how to set the ratings, and how to build the report in Excel and PowerPoint. It also walks through a full example and a faster way to draft it from your project data. Excel steps come from Microsoft's support pages read on November 10, 2026.
What a project status report is
A project status report is a short update on one project's health. It tells sponsors and stakeholders whether the project is on track, what changed, and what help is needed.
It differs from a general weekly update. A weekly report usually covers a team's work across many tasks. A project status report tracks one project against its own plan, budget, and dates. If you need the team version, see our guide on how to write a weekly status report from your data.
Most readers spend under a minute on it. That shapes everything. The overall rating and the asks must be visible without scrolling.
Good reports answer five questions:
- Are we on track overall?
- What did we finish since the last report?
- What is coming next?
- What could go wrong?
- What do we need from you?
What to include in a project status report
Here are the sections most teams use, in reading order.
| Section | What it shows |
|---|---|
| Header | Project name, reporting period, date, and project manager |
| Overall status | One rating for the whole project, plus one line of reason |
| Status by area | Separate ratings for schedule, budget, and scope |
| Progress | Work done against work planned |
| Milestones | Recent and upcoming milestones with dates |
| Budget | Spent to date, budget, and forecast at completion |
| Risks and issues | Top items, owners, and next actions |
| Decisions needed | What you need from the reader, and by when |
Keep each section short. Two or three bullets are usually enough. Link to the detailed plan instead of copying it in.
The header matters more than it looks. Readers who get several reports a week need to know which project and which period they are reading.
How to set red, amber, and green ratings
Status colors are only useful if everyone reads them the same way. Agree on the rules at the start of the project, not in the middle of a bad week.
Here is one example of rules a team might set. Adjust the numbers to your own project.
| Area | Green | Amber | Red |
|---|---|---|---|
| Schedule | On or ahead of plan | Up to 2 weeks behind | More than 2 weeks behind |
| Budget | Forecast within 2% of budget | Forecast 2% to 10% over | Forecast more than 10% over |
| Scope | No unapproved changes | Changes under review | Changes affect a milestone |
The overall rating usually follows the worst area. If budget is amber and the rest are green, the project is amber.
Each rating needs one line of reason. "Amber: test migration is one week behind" is useful. "Amber" on its own is not.
Red should lead to a plan. When a rating turns red, the report should say what will bring it back and when.
How to make a project status report in Excel
Excel works well when the report lives next to the project tracker. Here is a simple layout.
- Create a header block. Put the project name, period, date, and manager in the top rows.
- Add a status table. List Schedule, Budget, Scope, and Overall in one column. Put a rating score next to each, such as 1 for red, 2 for amber, and 3 for green.
- Add icons. Select the score cells, then go to Home > Conditional Formatting > Icon Sets.
- Add a progress table. Show tasks planned, tasks done, and percent complete.
- Add budget lines. Show budget, spent to date, and forecast at completion.
- Add risks and asks. Use a short table with item, owner, and due date.
Icon sets do the color work. Microsoft says an icon set can "annotate and classify data into three to five categories separated by a threshold value." It also notes you can mix icons, for example "a green 'symbol' check mark, a yellow 'traffic light', and a red 'flag.'"
Link the numbers to the tracker. A formula such as =COUNTIF(D:D,"Done") counts finished tasks, so the report updates when the tracker does. Percent complete is then tasks done divided by total tasks.
For example, if the tracker lists 48 tasks and the formula counts 29 as done, percent complete is 29 divided by 48, or 60.4%. Put planned progress next to it, so readers see the gap at a glance. A second COUNTIF on a due-date column can count tasks that should be done by now.
Keep the sheet as a template. Next period, you only update the dates, the notes, and the source data.
How to make a project status report in PowerPoint
Many sponsors prefer one slide in a meeting. A slide forces you to keep only what matters.
A layout that works:
- Top band. Project name, period, and a large overall status color.
- Left column. Status by area, with one line of reason each.
- Center. A small timeline with the next three milestones.
- Right column. Budget spent, forecast, and percent complete.
- Bottom band. Top risks and the decisions you need.
Use the same slide every time. Readers learn where to look, and changes stand out.
If the project has a Gantt chart, add a small version as a second slide. Our guide on how to create a Gantt chart with AI covers that step. For the first meeting of a project, see how to make a project kickoff presentation.
How to collect the data each period
A status report is only as good as its inputs. Set up the data flow once, and each report takes minutes instead of hours.
Use one source for each number:
- Tasks. The project tracker, whether that is a spreadsheet, Planner, Jira, or another tool.
- Budget. Finance's cost report, not the project team's own estimate.
- Milestones. The approved plan, with any changes logged.
- Risks. A risk log that owners update before the report is due.
Pick a cut-off time. For a Friday report, many teams use Thursday at noon. Anything that changes after that goes in the next report. This stops last-minute edits from breaking the numbers.
Ask owners for updates in the same format each time. A short form with three fields works well: what moved, what is blocked, and what is next. The project manager then turns those updates into the report.
Keep an archive of past reports. When a sponsor asks when a risk first appeared, the answer is one search away. Past reports also show whether ratings changed too late.
Status reports for different readers
One project often has several audiences. The facts stay the same, but the level of detail changes.
Executive sponsors. They want the rating, the reason, and the asks. One slide or a short email is usually enough.
The steering group. They want status by area, milestones, budget, and the top risks. A one-page status report fits this group.
The project team. They want task-level detail, owners, and dates. The tracker itself often serves them better than a report.
Clients or partners. They want progress on what they care about, such as delivery dates. Leave out internal staffing or budget details unless the contract requires them.
Write the full version first, then trim it for each audience. That keeps every version consistent. A sponsor and a team member should never get different answers to the same question.
A project status report example
Here is a worked example for a made-up project. Northgate Supply is moving its sales team to a new CRM. The plan runs 12 weeks, and this is the report for week 7.
Overall: Amber. Test migration is one week behind, and the budget forecast is 3.3% over.
| Area | Status | Reason |
|---|---|---|
| Schedule | Amber | Test migration moved from week 7 to week 8 |
| Budget | Amber | Forecast $186,000 against a $180,000 budget |
| Scope | Green | No unapproved changes |
Progress. The plan has 48 tasks. By week 7, 31 tasks were planned to be done, which is 64.6%. The team has finished 29, which is 60.4%. That gap of two tasks explains the amber schedule rating.
Budget. Spent to date is $112,500, or 62.5% of the $180,000 budget. The forecast at completion is $186,000. That is $6,000 over, or 3.3%, which falls in the amber band of 2% to 10%.
Milestones.
- Data mapping: done in week 5.
- Test migration: moved to week 8.
- Go-live: still planned for week 12.
Risks. The old system limits how many records it can export per hour. The data lead is testing a weekend export window. Owner: data lead. Due: Friday.
Decision needed. Approve $6,000 for extra test cycles, or drop one custom report from scope. Needed by next Wednesday to protect the go-live date.
The whole report fits on one page. A sponsor can read the rating, the reason, and the ask in under a minute.
The next report shows how the story moves. In week 8, the weekend export works and the test migration finishes. The team also closes the two late tasks, so schedule returns to green. The sponsor approves the $6,000, which raises the budget to $186,000. The forecast now matches the budget, so budget turns green as well. With every area green, the overall rating moves to green, and the report says why in one line.
Make a project status report with AI
The slow part is rarely writing. It is pulling numbers from trackers, checking them, and keeping the format the same every time. An AI tool can draft the report from your exports.
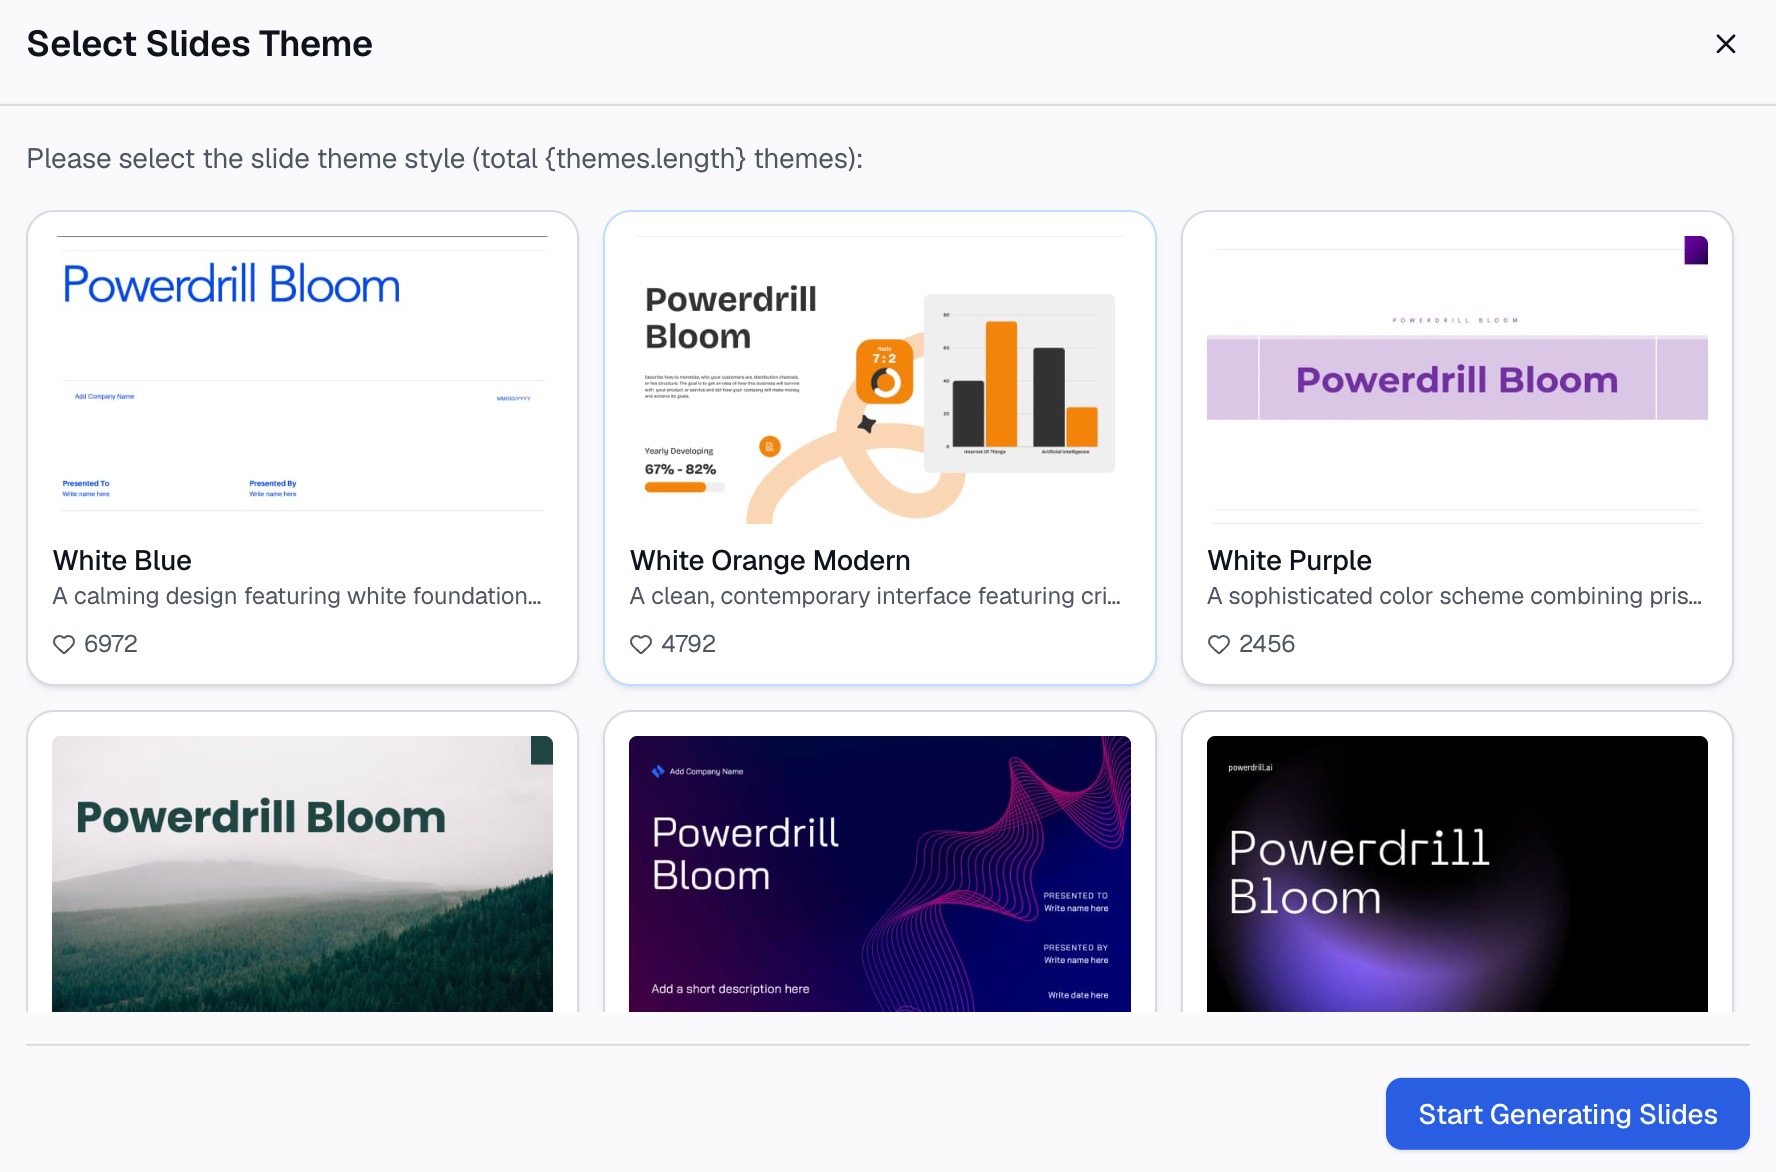
Here is the method in three steps, using Powerdrill Bloom.
Step 1: Upload your project tracker
Export the task list, budget sheet, or notes from your project tool. The AI One-Page Summary Generator says to "Upload the source long doc, project tracker, product info or pasted notes."
Include your status rules if you have them. That keeps the ratings consistent with what your team agreed.

Step 2: Describe the status report you need in natural language
Pick the format and say what to include. For example: "Make a one-page project status report for week 7. Rate schedule and budget with our rules, and list the top two risks."
The tool page lists a "One-page project recap" with "Project status, KPIs and next steps on a single printable sheet."
Step 3: Review the numbers and export the report
Check the ratings and totals against your tracker. Then export the page. The tool page says you can "Export the one-pager print-ready PDF or PNG sized A4 / Letter."
For leadership reviews across several projects, the Board Report Generator lists a "KPI scoreboard PDF with traffic lights and trend arrows by metric."
How to write the summary and the asks
Two parts of the report do most of the work: the one-line summary and the decision request.
The summary. Write it last, and keep it to one sentence. Include the rating, the main reason, and the outlook. For example: "Amber: test migration slipped one week, but go-live in week 12 is still achievable."
The asks. Be specific about what, who, and when. "We need a decision" is vague. "Approve $6,000 for extra test cycles by Wednesday" gets a reply.
Some habits make both parts stronger:
- Lead with change. Say what is different from the last status report.
- Use numbers, not adjectives. "Two tasks behind" beats "slightly behind."
- Name owners. Every risk and every ask needs a person.
- Close the loop. Report the outcome of last period's asks.
If nothing needs a decision, say so. "No decisions needed this week" is useful information too.
Read the summary aloud before you send it. If it takes more than one breath, it is too long for a sponsor reading on a phone.
Common mistakes to avoid
These are the problems that make status reports easy to ignore.
- Staying green too long. A project that is green every week until it turns red was never really green.
- Changing the format. A new layout each week hides real changes.
- Reporting activity instead of progress. Meetings held matter less than milestones reached.
- Skipping the budget forecast. Spent to date says little without the forecast at completion.
- Burying the ask. Put decisions near the top, not at the end of a long page.
- Sending it late. A report on the same day each period builds trust.
When you are ready to stop rebuilding the report by hand, try Powerdrill Bloom with this week's project tracker.
Frequently asked questions
What should a project status report include?
Start with a header, an overall rating, and status by area. Then add progress against plan, milestones, and budget with a forecast. Close with risks, issues, and the decisions you need.
How often should you send a project status report?
Most teams send one weekly or every two weeks. Pick a fixed day and keep it, so stakeholders know when to expect it.
What does RAG status mean in a project report?
RAG stands for red, amber, and green. Green means on track, amber means at risk, and red means off track and needing action. Agree on the rules for each color at the start.
How do I make a project status report in Excel?
Build a header, a status table with scores, and progress and budget tables. Then use Conditional Formatting > Icon Sets to turn the scores into traffic-light icons.
How long should a project status report be?
One page or one slide is enough for most projects. Link to the detailed plan and tracker instead of copying them into the report.
Sources: Microsoft Support, Use conditional formatting to highlight information in Excel.