How to Create a Financial Ratio Analysis: A Full Guide
To create a financial ratio analysis, pull the income statement and balance sheet for at least two periods. Calculate ratios in five groups: liquidity, leverage, profitability, efficiency, and valuation. Then compare each ratio across periods and with peers, and write down what changed and why.
This guide walks through the ratios to include, the formulas, and how to build them in Excel. It also shows a faster way with AI, a worked example, and a simple structure for the written report. The formulas for the core ratios come from the SEC's Beginners' Guide to Financial Statements.
What a financial ratio analysis is
A financial ratio analysis turns raw figures from financial statements into comparisons you can read. A revenue number alone tells you little. Revenue compared with costs, debt, or assets tells you a lot more.
The SEC puts it simply. It describes ratios that investors "calculate from information on financial statements and then use to evaluate a company." It also points out that these terms do not appear on the statements themselves. You build them from the reported numbers.
People run a ratio analysis for different reasons:
- Investors compare companies before they buy or sell.
- Lenders check whether a borrower can repay.
- Managers track whether margins and cash are moving the right way.
- Founders prepare for board meetings and funding rounds.
The goal is the same in each case. You want to know how healthy the business is and which way it is heading.
What you need before you start
Gather four things before you calculate anything.
- The income statement. This gives revenue, cost of sales, operating income, and net income.
- The balance sheet. This gives assets, liabilities, inventory, and shareholders' equity.
- At least two periods. One year of ratios shows a level. Two or more years show a trend.
- A reference point. The SEC warns that "desirable ratios vary by industry." Pick one or two peers or an industry average.
For a public company, the figures sit in the annual 10-K and quarterly 10-Q filings. Our 10-K reading guide shows where to find each statement. For a private company, export the statements from your accounting system.
Check one detail before you start. Make sure both periods use the same units, such as thousands of dollars.
The five groups of financial ratios
A full ratio analysis covers five groups. You do not need every ratio. Three or four from each group give a clear picture.
| Group | Ratio | Formula | What it tells you |
|---|---|---|---|
| Liquidity | Current ratio | Current assets / Current liabilities | Can the company cover short-term bills? |
| Liquidity | Quick ratio | (Current assets − Inventory) / Current liabilities | Can it cover them without selling stock? |
| Liquidity | Working capital | Current assets − Current liabilities | How much cushion is left in dollars |
| Leverage | Debt-to-equity | Total liabilities / Shareholders' equity | How much the company relies on debt |
| Profitability | Gross margin | (Revenue − Cost of sales) / Revenue | How much is left after direct costs |
| Profitability | Operating margin | Income from operations / Net revenues | Profit from core operations per dollar of sales |
| Profitability | Net margin | Net income / Revenue | Profit per dollar of sales after all costs |
| Profitability | Return on equity | Net income / Shareholders' equity | Profit earned on owners' money |
| Efficiency | Inventory turnover | Cost of sales / Average inventory | How many times stock sells through in a period |
| Valuation | P/E ratio | Price per share / Earnings per share | How the market prices each dollar of earnings |
The SEC defines several of these directly. For debt-to-equity, it says "you divide a company's total liabilities by its shareholder equity." For operating margin, you divide "income from operations (before interest and income tax expenses) by its net revenues."
On inventory turnover, the SEC explains the average. You take the current inventory balance, add the previous balance, "and then divide by two." On working capital, it calls the result "the money leftover if a company paid its current liabilities."
Valuation ratios need a share price, so they apply only to public companies. The SEC's example: a stock at $20 per share with earnings of $2 per share has a P/E of 10.
Which ratios to include for your purpose
A ratio analysis does not need every ratio. Pick the ones that answer the question your reader is asking.
For a lender or a supplier, focus on liquidity and leverage. The current ratio, quick ratio, working capital, and debt-to-equity show whether bills and loans can be paid. Add operating margin to show whether the business earns enough to keep paying.
For an investor, focus on profitability and valuation. Gross margin, operating margin, net margin, and return on equity show how well the company turns sales into profit. The P/E ratio shows what the market already expects.
For a manager, focus on profitability and efficiency. Margins show where costs are rising. Inventory turnover shows whether stock is moving or sitting in the warehouse.
For a board pack, pick two ratios from each group and show five years. Board members want the trend and the reason for it, not twenty numbers.
Whatever the audience, keep the same set of ratios from one period to the next. A ratio analysis is most useful when readers can compare this quarter with the last one at a glance.
How to create a financial ratio analysis in Excel
Excel works well for one company and a few periods. Here is a simple layout.
Set up the input sheet. Put each line item in a row and each period in a column. Use rows for revenue, cost of sales, operating income, net income, current assets, inventory, current liabilities, total liabilities, and equity.
Add a ratio sheet. List each ratio in a row with the same period columns. Write each formula once, then copy it across. For example, if current assets sit in row 6 and current liabilities in row 8, the current ratio for the first period is =B6/B8.
Format the results. Show margins and returns as percentages. Show liquidity and leverage ratios with two decimals. Show turnover as a plain number of times.
Add a change column. Subtract the prior period from the current one. Conditional formatting can color the cells that moved the most.
Add the peer column. Enter the same ratios for one or two peers. A ratio that looks weak alone may be normal for the industry.
Protect against errors. Wrap formulas in IFERROR so a missing value does not break the sheet. Check that total assets equal total liabilities plus equity before you trust any ratio.
Once the sheet is built, you paste in new figures each quarter and the ratios update.
How to create a financial ratio analysis with AI
The Excel method gets slow with many periods, several companies, or statements stuck in PDF reports. An AI tool can read the statements, calculate the ratios, and draft the summary.
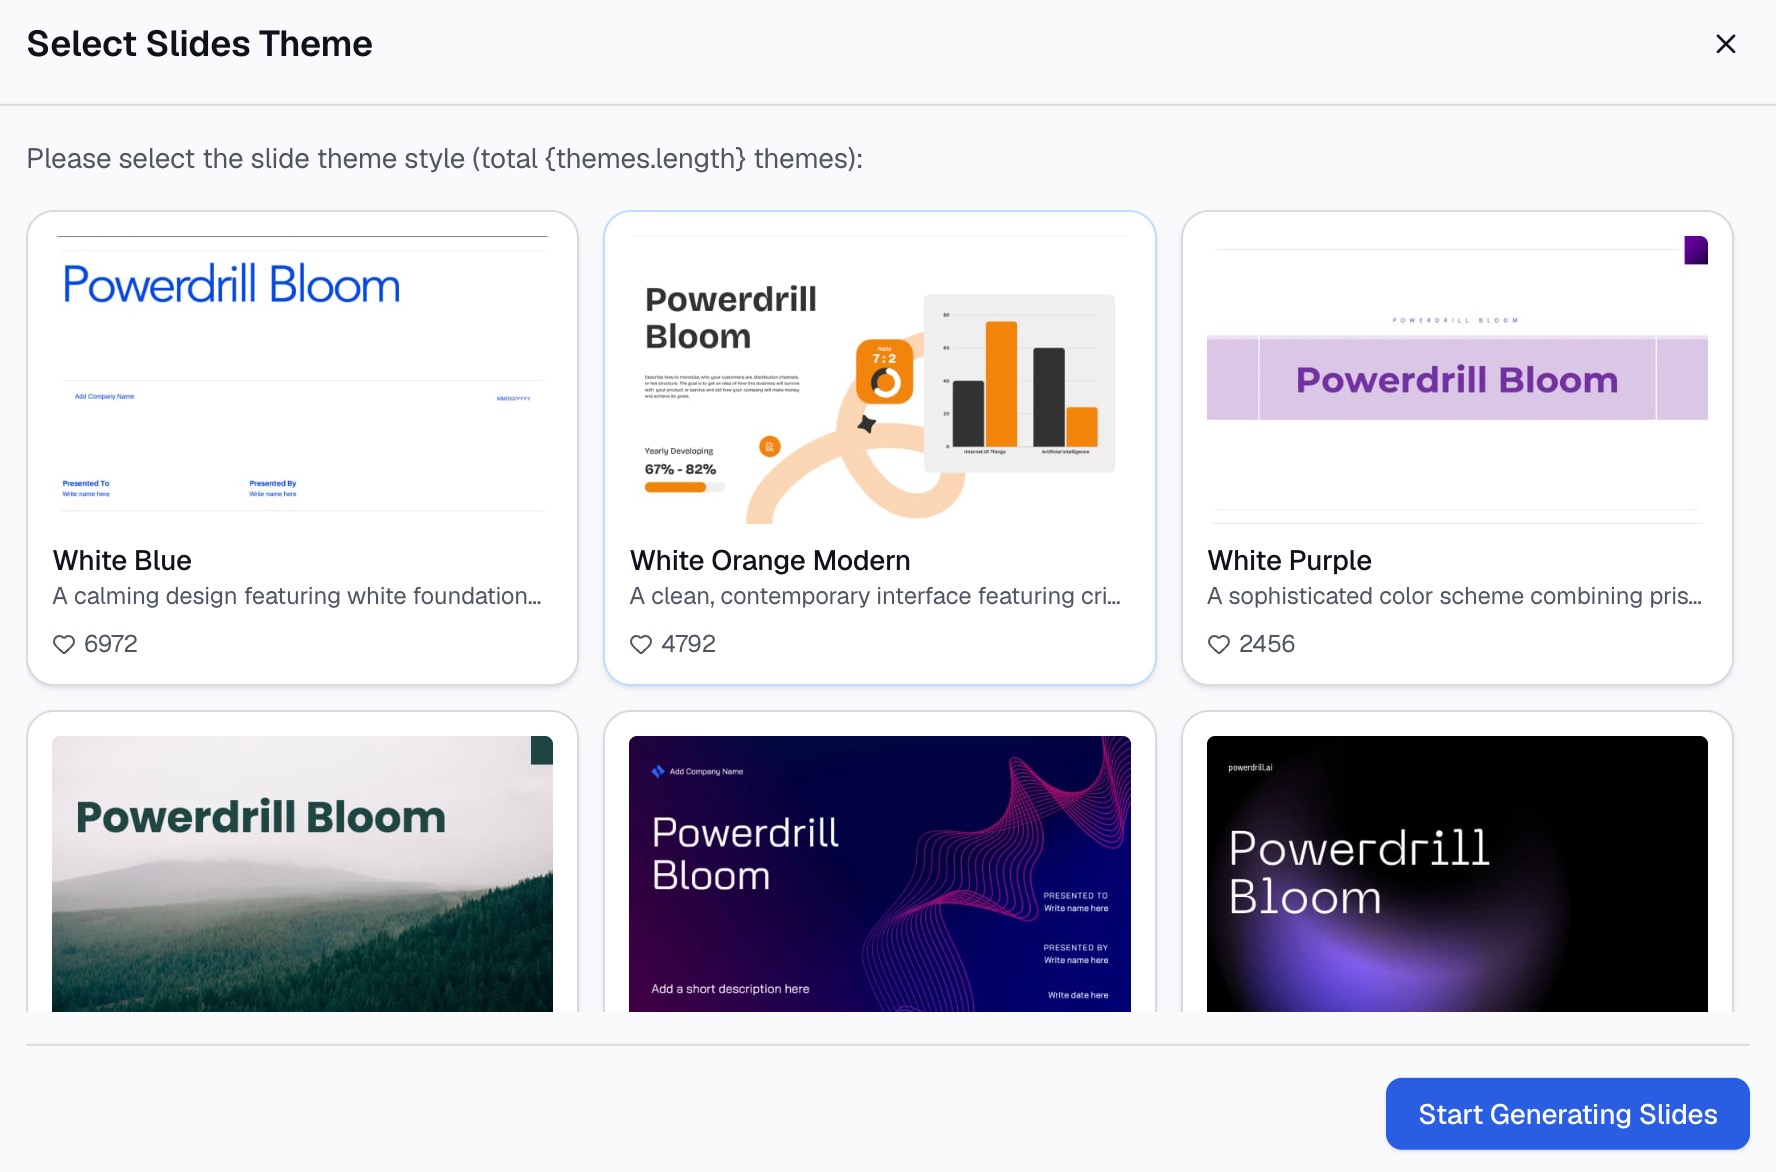
Here is the method in three steps, using Powerdrill Bloom.
Step 1: Upload the financial statements
Start with the files that hold the figures. That might be an Excel export from your accounting system, a CSV file, or a PDF annual report.
The AI Financial Analysis Tool asks you to "Upload financials P&L, balance sheet and cash flow exports from your accounting system." For a public company, the SEC Filing Search tool pulls statements from SEC records. Its page says "Every answer is backed by SEC, with links to the original records — not guesses."

Step 2: Ask for the ratios by group
Describe what you need in natural language. For example: "Calculate liquidity, leverage, profitability, and efficiency ratios for the last three years. Show the change each year and flag anything that moved more than 10%."
The tool page describes the output as a "Ratio dashboard with profitability, liquidity, leverage and efficiency grouped." It also lists "Trend lines across periods with QoQ and YoY callouts." Ask for a short written summary of the three biggest changes.
Step 3: Check the figures and export the report
Check a few ratios by hand against the source statements before you share anything. The homepage says "Every number comes back with the page, the row and the figure behind it," so you can trace each input.
Then export. The tool page lists exports as a "branded PDF, deck or canvas link for finance review." Pick the format your audience uses.
How to read the results
Numbers alone are not the analysis. The reading is.
Look at direction first. A current ratio of 1.5 means little alone. A drop from 2.0 to 1.5 over two years tells a story.
Read the groups together. The SEC reminds readers that "No one financial statement tells the complete story." Ratios work the same way. Rising margins with falling liquidity can mean growth is tying up cash.
Compare with peers. A software company and a grocery chain have very different margins and turnover. Compare like with like.
Find the driver. When a ratio moves, trace it to the line items. A lower gross margin might come from higher input costs, price cuts, or a shift in product mix.
Note one-off items. A large asset sale or legal charge can distort a single year. Read the notes before you draw a conclusion.
Set a rhythm. Run the ratio analysis each quarter, or each year for a small business. Keep every past version so the trend builds over time. A short note on what changed each time makes the next update faster.
Our guides to the balance sheet, the income statement, and the cash flow statement cover each statement in more depth.
A financial ratio analysis example
Cedar Point Outfitters is an invented retailer used here to show the method. Figures are in thousands of dollars.
| Line item | 2025 | 2024 |
|---|---|---|
| Revenue | 12,000 | 10,500 |
| Cost of sales | 7,200 | 6,450 |
| Operating income | 1,440 | 1,155 |
| Net income | 960 | 735 |
| Current assets | 4,200 | 3,900 |
| Inventory | 1,800 | 1,500 |
| Current liabilities | 2,400 | 2,000 |
| Total liabilities | 4,000 | 3,500 |
| Shareholders' equity | 5,000 | 4,500 |
Inventory at the end of 2023 was 1,400. Here are the ratios:
| Ratio | 2025 | 2024 | Change |
|---|---|---|---|
| Current ratio | 1.75 | 1.95 | Down |
| Quick ratio | 1.00 | 1.20 | Down |
| Working capital | 1,800 | 1,900 | Down |
| Debt-to-equity | 0.80 | 0.78 | Slightly up |
| Gross margin | 40.0% | 38.6% | Up |
| Operating margin | 12.0% | 11.0% | Up |
| Net margin | 8.0% | 7.0% | Up |
| Return on equity | 19.2% | 16.3% | Up |
| Inventory turnover | 4.36 | 4.45 | Slightly down |
The story is clear once the ratios sit together. Profitability improved on every measure. Liquidity got tighter, and inventory sold through a little more slowly.
The likely driver is growth. Revenue rose about 14%, and the company built inventory ahead of demand. That lifted margins but tied up cash. The next step is to check whether 2026 sales absorb the extra stock.
How to write up a financial ratio analysis report
Most readers want the conclusion before the table. A short report in this order works well:
- Summary. Two or three sentences on overall health and the main trend.
- Key ratios table. The ratios by group, with the prior period and the change.
- What drove the changes. One short paragraph per group that moved.
- Risks and questions. Items to watch, such as rising debt or slower inventory.
- Method notes. Data sources, periods, and any adjustments you made.
Keep each section brief. A one-page summary with a ratio table often beats a ten-page report.
If the report goes to a board, add one chart per group. A line chart of margins over five years says more than a paragraph.
Write in plain terms for non-finance readers. Instead of "the quick ratio fell to 1.00," say that cash and receivables now just cover short-term bills. Then give the number in brackets. Readers remember the meaning, and analysts can still check the figure.
Common ratio analysis mistakes
These errors are easy to make and easy to avoid.
Using one period only. A single year shows a snapshot, not a trend. Use at least two periods, and three or more when you can.
Mixing units or periods. Quarterly income against an annual balance sheet distorts turnover and return ratios. Match the periods.
Ignoring industry norms. As the SEC notes, desirable ratios vary by industry. Compare with peers before calling a ratio good or bad.
Using ending balances where averages fit. Turnover ratios should use average balances, as the SEC shows for inventory.
Calculating without explaining. A table of ratios is not an analysis. Add the drivers and the questions they raise.
Skipping the cash flow statement. Ratios from the income statement and balance sheet miss cash timing. Check operating cash flow alongside net income.
Trusting copied figures. Numbers retyped from a PDF often carry errors. Check a few inputs against the original statements before you calculate.
When you are ready to run a ratio analysis on your own statements, try Powerdrill Bloom with two years of exports from your accounting system.
Frequently asked questions
What are the main types of financial ratios?
The main groups are liquidity, leverage, profitability, efficiency, and valuation. Liquidity covers the current ratio and quick ratio. Leverage covers debt-to-equity. Profitability covers gross, operating, and net margin plus return on equity. Efficiency covers inventory turnover, and valuation covers the P/E ratio.
How do you do a ratio analysis of a company?
Collect the income statement and balance sheet for at least two periods. Calculate ratios in each group, then compare them across periods and with peers. Finally, trace each big change to the line items that caused it and write up the findings.
Can I do a financial ratio analysis in Excel?
Yes. Put each line item in a row and each period in a column, then add a ratio sheet with formulas. Format margins as percentages and add a change column. An AI tool can speed this up when you have many periods or PDF statements.
What is a good current ratio?
It depends on the industry. A current ratio above 1 means current assets exceed current liabilities. The SEC notes that desirable ratios vary by industry, so compare with peers. A falling trend matters more than any single value.
How do I write a financial ratio analysis report?
Start with a short summary of overall health. Add a table of key ratios with the prior period and the change. Explain what drove each change, list risks to watch, and close with notes on data sources and methods.
Sources: US Securities and Exchange Commission, Beginners' Guide to Financial Statements. Details read on November 3, 2026.