How to Analyze a Balance Sheet: Step by Step
To analyze a balance sheet, first confirm that assets equal liabilities plus equity. Then check liquidity with working capital and the current ratio, and check leverage with the debt-to-equity ratio. Compare at least two periods, and read the notes before you draw a conclusion.
This guide walks through each step with the formulas, a worked example, and the mistakes that trip up beginners. It also shows how to analyze a balance sheet with AI when you have several years or several companies to compare.
What a balance sheet tells you
A balance sheet is one of the three core financial statements, alongside the income statement and the cash flow statement. The US Securities and Exchange Commission (SEC) explains it in its Beginners' Guide to Financial Statements.
The SEC says "A balance sheet provides detailed information about a company's assets, liabilities and shareholders' equity." It shows those figures "at the end of the reporting period." The guide also notes a limit: "It does not show the flows into and out of the accounts during the period."
That makes the balance sheet a snapshot. It answers three questions:
- What does the company own? These are its assets, such as cash, inventory, and equipment.
- What does it owe? These are its liabilities, such as loans, supplier bills, and taxes.
- What is left for the owners? That is shareholders' equity.
The SEC sums up the link in one formula: "ASSETS = LIABILITIES + SHAREHOLDERS' EQUITY." A company's assets "have to equal, or 'balance,' the sum of its liabilities and shareholders' equity."
Analysis turns that snapshot into answers. Can the company pay its bills this year? How much does it rely on debt? Is its position getting stronger or weaker?
Before you start: what you need
Gather these before you begin:
- At least two balance sheets. Use the same date in each year, such as two year-end statements. One period alone tells you little.
- The notes to the financial statements. They explain how the numbers were measured.
- The income statement. Some ratios mix balance sheet and income statement figures.
- A spreadsheet. Excel or Google Sheets is enough for the ratios below.
- An industry reference point. The SEC warns that "desirable ratios vary by industry."
For a public US company, you will find all of these in its annual report, known as Form 10-K. For a private company or your own business, export them from your accounting system.
Read the three sections
Start by reading the statement top to bottom before you calculate anything.
Assets. The SEC says "Assets are generally listed based on how quickly they will be converted into cash." Current assets come first. The SEC defines them as "things a company expects to convert to cash within one year." Noncurrent assets follow, such as property and equipment.
Liabilities. The SEC says "Liabilities are generally listed based on their due dates." Current liabilities are "obligations a company expects to pay off within the year." Long-term liabilities "are obligations due more than one year away."
Shareholders' equity. The SEC describes it as "the amount owners invested in the company's stock plus or minus the company's earnings or losses since inception."
As you read, note the five largest lines in each section. Large items deserve the most attention, because small changes in them move every ratio.
Then check the totals. Total assets should equal total liabilities plus equity. If they do not, you are reading a draft or you copied a figure wrong.
Check liquidity: can the company pay its bills?
Liquidity is the ability to cover short-term obligations. Two measures do most of the work.
Working capital. The SEC defines it as "the money leftover if a company paid its current liabilities" out of its current assets. The formula is:
Working Capital = Current Assets – Current Liabilities
Positive working capital means current assets cover the bills due within a year. Negative working capital is a warning sign, though some business models run that way.
Current ratio. This divides current assets by current liabilities. A ratio above 1 means current assets exceed current liabilities. Many analysts watch for a ratio well below 1, but the right level depends on the industry.
Look inside current assets. Not every current asset turns into cash at the same speed. Cash is immediate. Receivables depend on customers paying. Inventory depends on sales. A company with a healthy current ratio built mostly on slow-moving inventory may still run short of cash.
A simple check helps. Compare cash alone with current liabilities. If cash covers only a small share, the company depends on collecting receivables and selling stock on time.
Check leverage: how much does it rely on debt?
Leverage shows how a company is funded. The SEC gives the main formula:
Debt-to-Equity Ratio = Total Liabilities / Shareholders' Equity
The SEC explains what a result of 2 to 1 means. The company "has two dollars of debt to every one dollar shareholders invest in the company."
A high ratio is not always bad. Utilities and banks often carry more debt by design. But a rising ratio over several years, with flat earnings, means the company is borrowing faster than it is growing.
Also check the mix of debt. Short-term borrowing that must be refinanced within a year carries more risk than long-term debt at a fixed rate. The notes usually list each loan, its rate, and its due date.
Compare two or more periods
One balance sheet is a photo. Two or more make a story.
Put each period side by side in a spreadsheet. Then add two columns: the change in dollars and the change in percent. Read the largest changes first.
Ask these questions as you go:
- Did receivables grow faster than sales? Customers may be paying more slowly.
- Did inventory pile up? Products may not be selling as planned.
- Did cash fall while debt rose? The company may be borrowing to fund operations.
- Did equity fall? Losses or large dividends may be eating into the owners' stake.
Then look across the statements. The SEC reminds readers that the statements "are all related." Changes in assets and liabilities also show up in revenue and expenses on the income statement.
Add one efficiency check. The SEC describes the inventory turnover ratio. It "compares a company's cost of sales on its income statement with its average inventory balance for the period." To get the average inventory, add the opening and closing balances and divide by two. A falling turnover means stock is sitting longer before it sells.
For a public company, also compare with one or two peers. A ratio that looks weak alone may be normal for the industry.
Read the notes and the MD&A
Numbers on the balance sheet depend on choices made by management. The notes explain those choices.
The SEC is direct about this: "It's so important to read the footnotes." It says "The footnotes to financial statements are packed with information." They cover accounting policies, taxes, pensions, and stock options.
The SEC also points readers to the management discussion. It says MD&A is "management's opportunity to provide investors with its view of the financial performance and condition of the company." That section can explain why a number changed.
When a line moves sharply, search the notes for it. A jump in debt might be a new loan for an acquisition. A drop in inventory might be a write-down. The notes turn a number into a reason.
How to analyze a balance sheet with AI
The steps above are simple for one company and two years. They get slow with five years, several entities, or a stack of PDF annual reports. An AI tool can read the statements, calculate the ratios, and flag the changes.
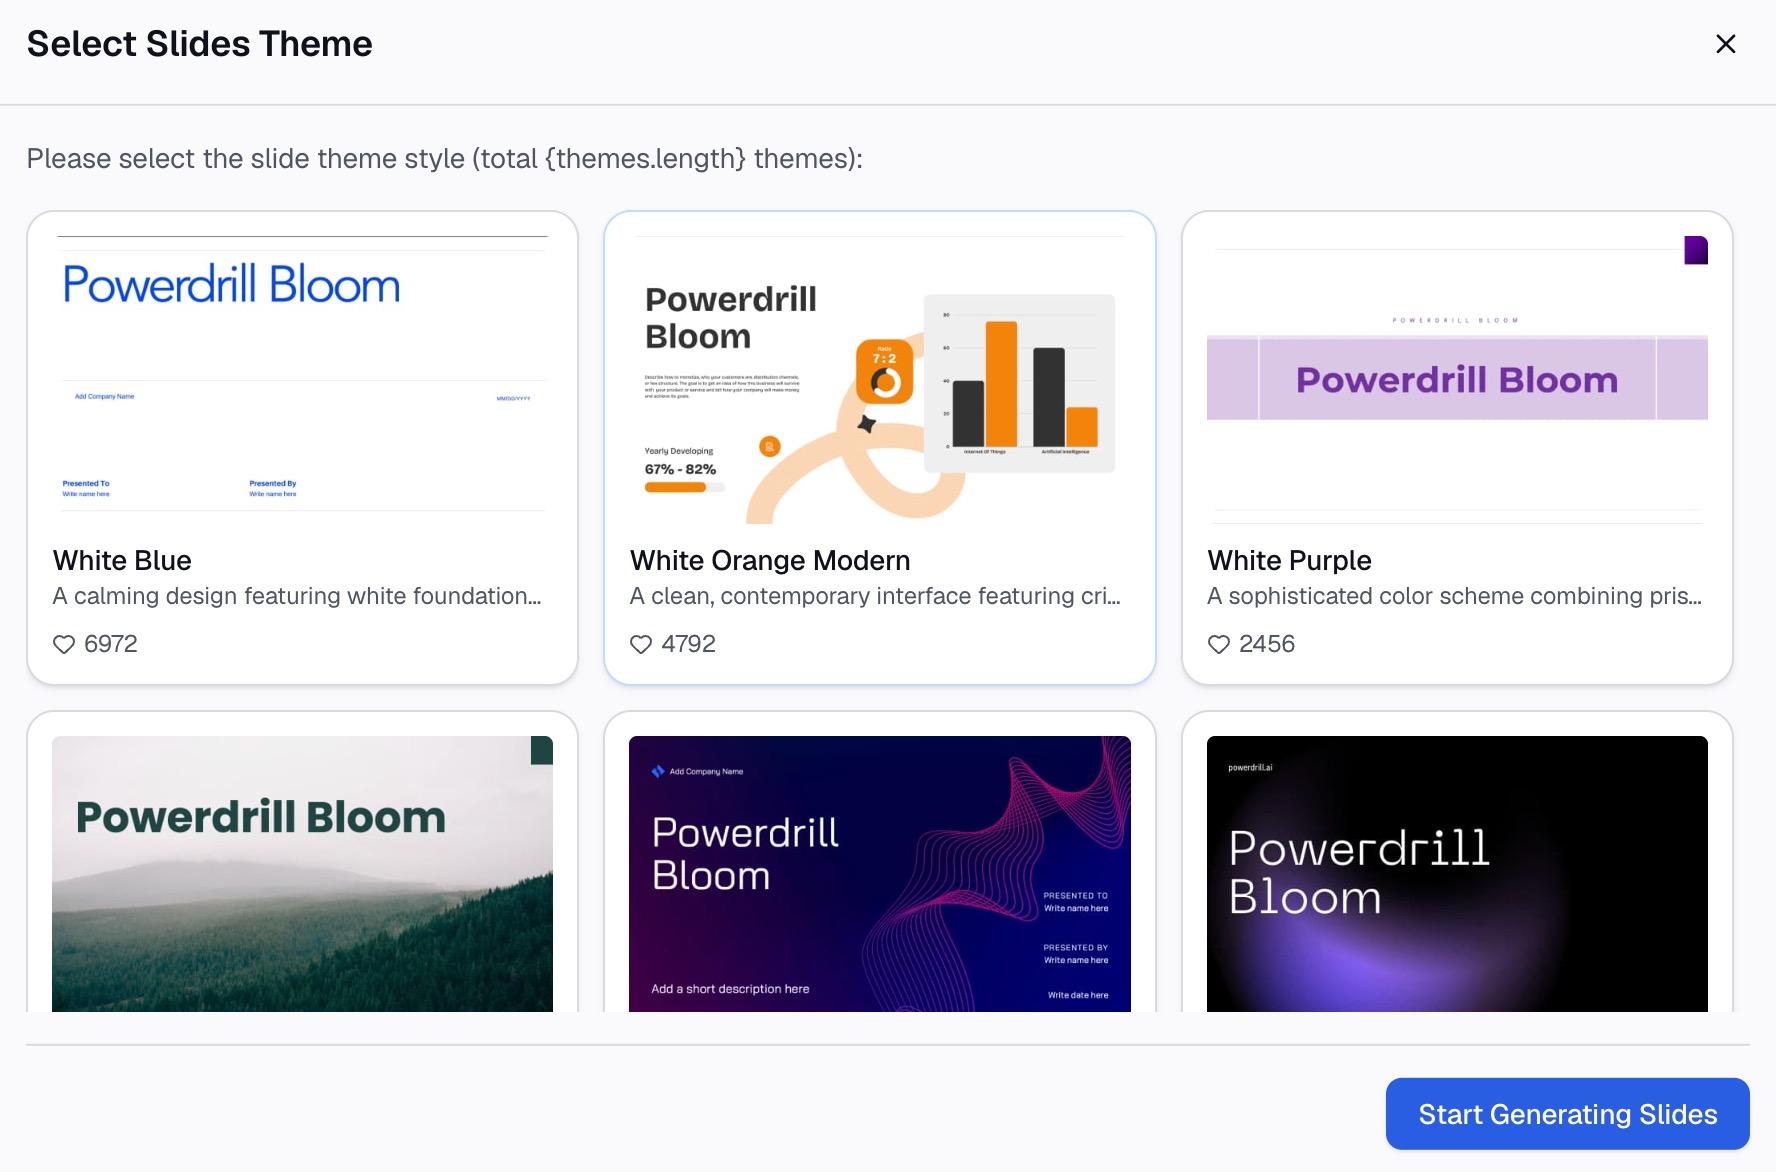
Here is the method in three steps, using Powerdrill Bloom.
Step 1: Upload your balance sheets
Upload the balance sheets you want to compare. They can be Excel exports from your accounting system or PDF annual reports.
The AI Financial Analysis Tool asks for "P&L, balance sheet and cash flow exports from your accounting system." For a public company, the SEC Filing Search page covers "SEC filings, earnings, balance sheets, income statements, cash flows, dividends, and insider transactions."

Step 2: Ask for the ratios in natural language
Describe the analysis you want. For example: "Calculate working capital, the current ratio, and debt-to-equity for each year. Show the change from last year and flag anything unusual."
The financial analysis page lists "Profitability, liquidity, leverage and efficiency ratios with industry benchmarks." It also offers "Multi-period trend lines across the financials with QoQ and YoY change."
You can ask follow-up questions, such as "Why did the current ratio fall?" or "Which liability grew the most?"
Step 3: Check the figures and export the analysis
Check each ratio against the source statement. Pick two figures and confirm them by hand. Totals and the equity line are good choices, because errors there move every ratio. The homepage says "Every number comes back with the page, the row and the figure behind it," so you can trace each one.
The tool also produces an "Anomaly flag report listing divergent line items with suggested causes." Treat those causes as leads to check in the notes, not as conclusions.
Then export. The financial analysis page offers a "branded PDF." For a board pack, the AI Financial Report Generator builds a "Quarterly board financial deck with KPIs, segment view and asks."
A worked example
Here is a short example for an invented company, Harbor Lane Supply. All figures below are invented and in thousands of dollars.
| Line item | Year 1 | Year 2 | Change |
|---|---|---|---|
| Cash | 420 | 260 | -38% |
| Accounts receivable | 610 | 790 | +30% |
| Inventory | 540 | 720 | +33% |
| Total current assets | 1,570 | 1,770 | +13% |
| Total current liabilities | 980 | 1,310 | +34% |
| Total liabilities | 1,900 | 2,450 | +29% |
| Shareholders' equity | 1,250 | 1,230 | -2% |
Now apply the steps. The ratios below use the rounded figures from the table.
Liquidity. Working capital fell from 590 to 460. The current ratio fell from about 1.6 to about 1.35. Both still cover short-term bills, but the cushion shrank.
Inside current assets. Cash fell 38% while receivables and inventory each grew about a third. More of the company's short-term strength now depends on customers paying and stock selling.
Leverage. Debt-to-equity rose from about 1.5 to about 2.0. The company now has about two dollars of liabilities for every dollar of equity.
The story. Sales may have grown, but the company is funding that growth with supplier credit and borrowing. The next questions go to the notes and the income statement. Did sales grow as fast as receivables? Are any customers late?
Common balance sheet analysis mistakes
Reading one period alone. A single balance sheet cannot show a trend. Always compare at least two dates.
Ignoring the industry. The SEC says "desirable ratios vary by industry." Compare with peers before you judge a ratio.
Treating all current assets as cash. Inventory and receivables take time to turn into cash. Check how much of the total is cash.
Skipping the notes. Debt terms, leases, and accounting changes live in the notes. They often explain the biggest moves.
Forgetting the other statements. The balance sheet shows position, not performance. Pair it with the income statement and cash flow statement. Our guide on analyzing financial data with AI covers the wider picture.
Retyping PDF numbers by hand. Copy errors are common, and one wrong digit in a total breaks every ratio that uses it. If your statements are PDFs, see how to turn PDF financial statements into charts without retyping.
Want to run the ratios on your own statements? Try Powerdrill Bloom with two years of balance sheets, and ask for liquidity and leverage ratios with year-over-year changes.
Frequently asked questions
How do you analyze a balance sheet?
Check that assets equal liabilities plus equity. Then calculate working capital, the current ratio, and the debt-to-equity ratio. Compare at least two periods, look for the largest changes, and read the notes to understand why the numbers moved.
What are the most important balance sheet ratios?
For beginners, start with three. Working capital and the current ratio show liquidity. The debt-to-equity ratio shows leverage. The SEC explains that a debt-to-equity ratio of 2 to 1 means two dollars of debt for every dollar shareholders invest.
What is a good current ratio?
A current ratio above 1 means current assets exceed current liabilities. The right level depends on the industry, because the SEC notes that desirable ratios vary by industry. Compare with peers and with the company's own past years.
What is the difference between a balance sheet and an income statement?
A balance sheet shows what a company owns and owes at one date. An income statement shows revenue, expenses, and profit over a period. The SEC says the balance sheet does not show the flows into and out of the accounts during the period.
Can AI analyze a balance sheet?
Yes. AI tools can read balance sheets from Excel or PDF, calculate liquidity and leverage ratios, and flag large changes between periods. Powerdrill Bloom links each figure to its source row or page. Always check a few figures by hand and read the notes before you draw conclusions.
Sources: US Securities and Exchange Commission, Beginners' Guide to Financial Statements. Details read on October 27, 2026.