Create Impressive Bar Graphs with Powerdrill
Make professional bar graphs effortlessly. Analyze data clearly and present it beautifully. Try now!
Dùng thử miễn phí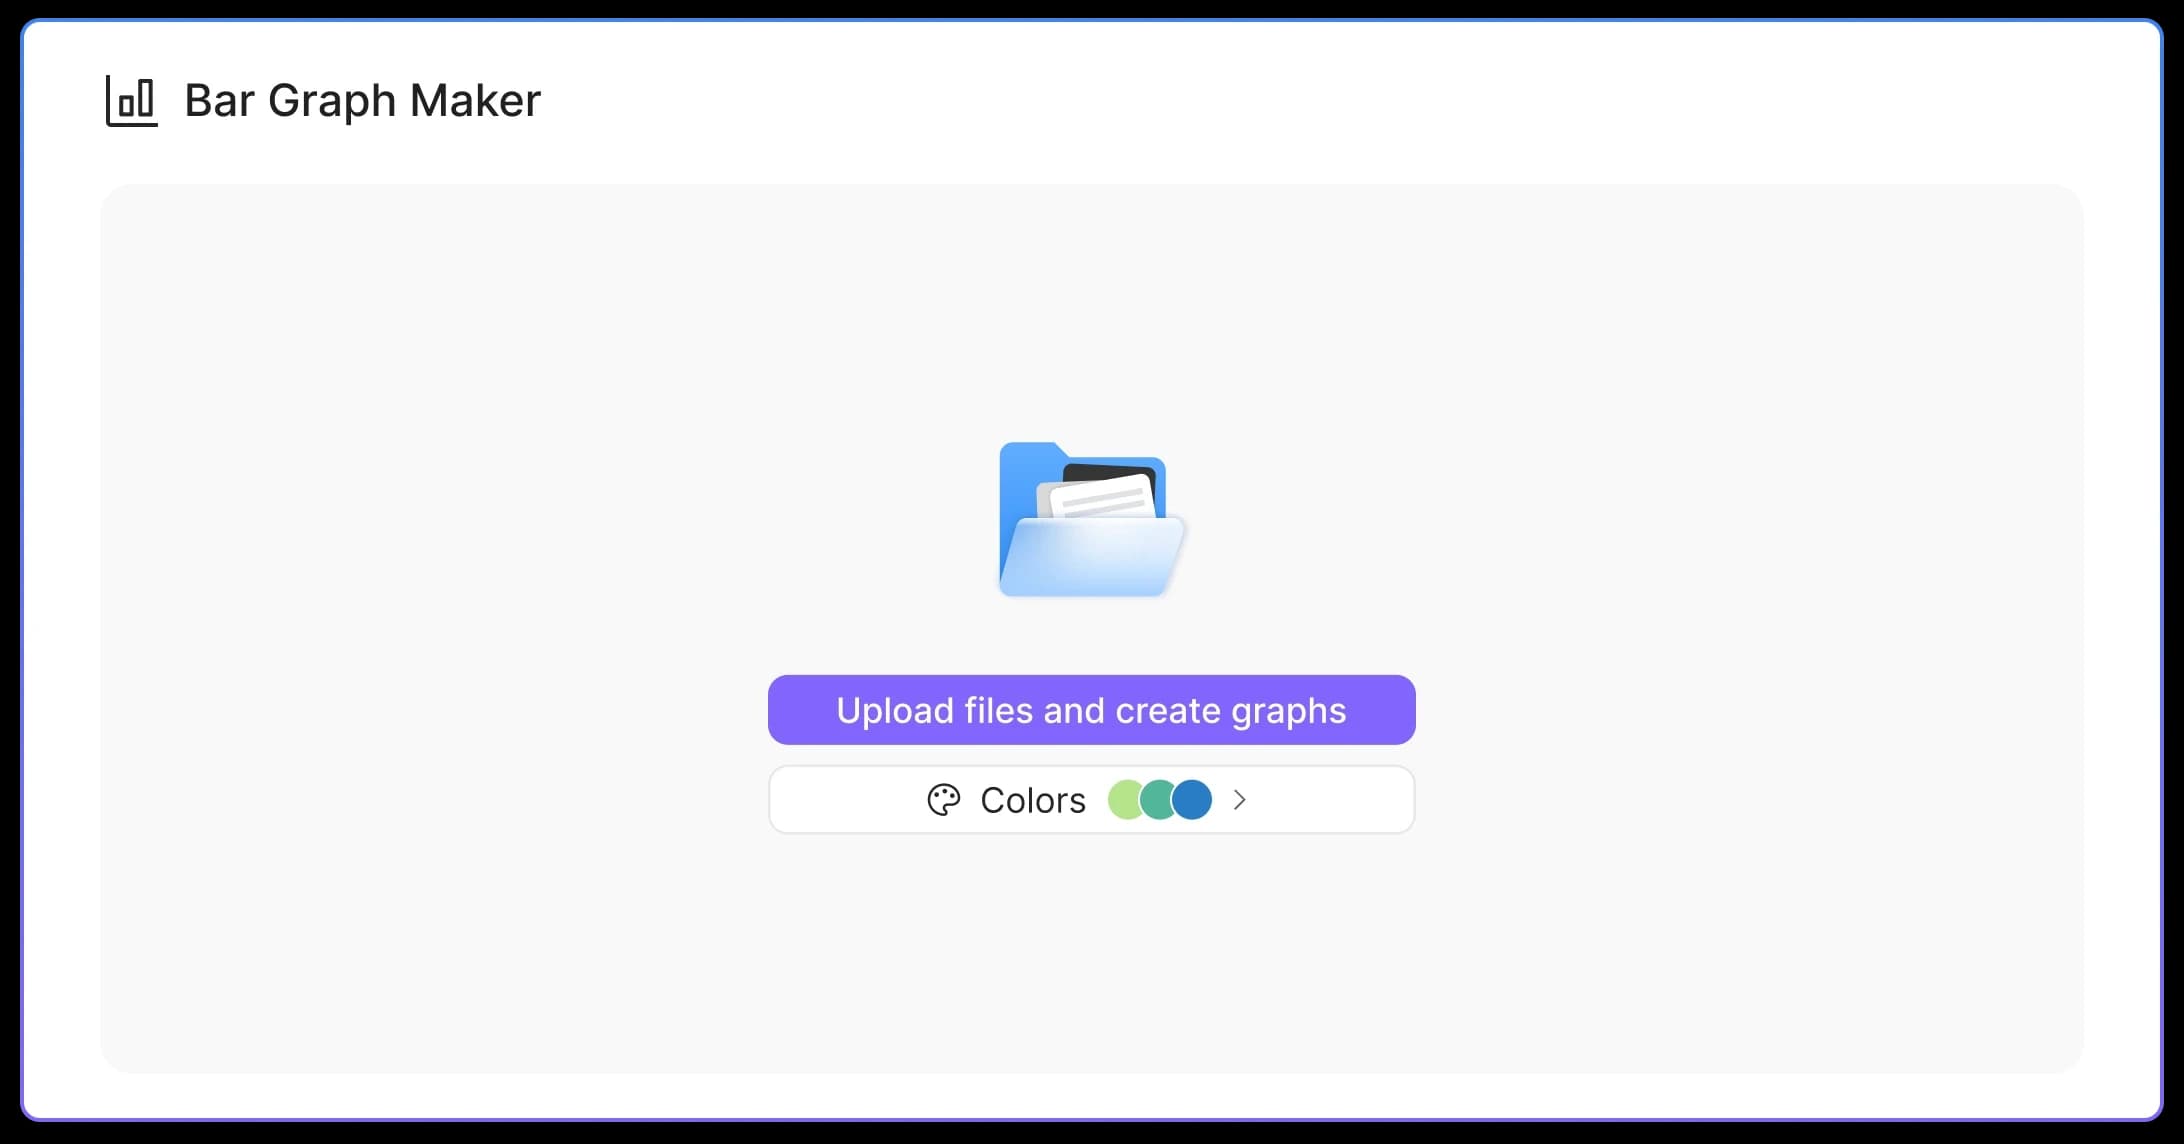
Quick Comparisons
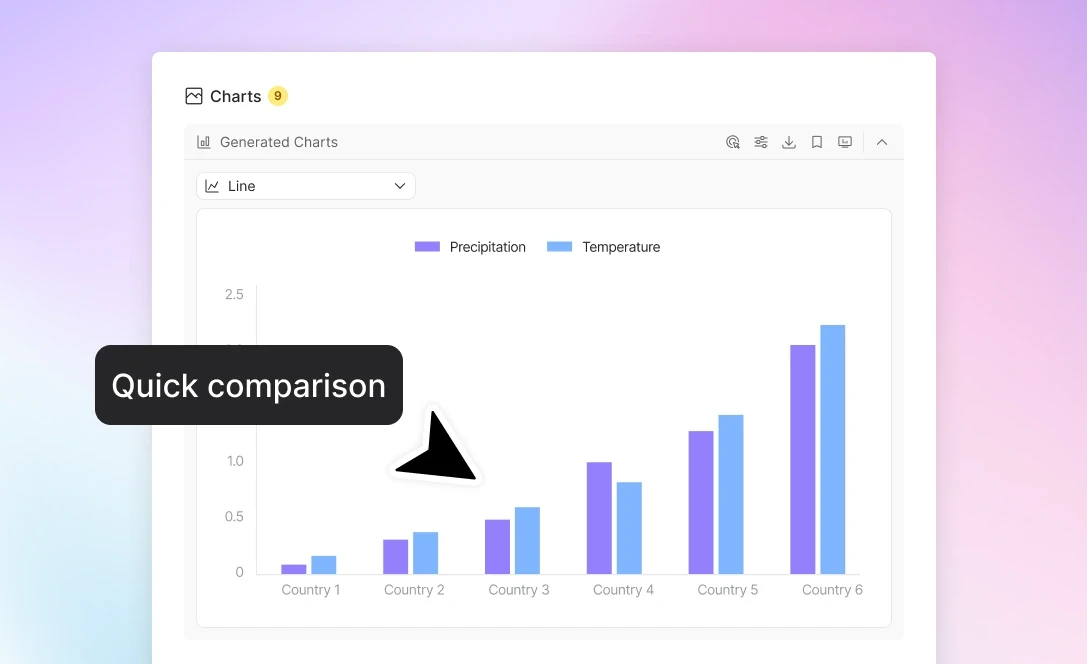
Bar graphs allow for quick visual comparisons. Easily see which categories are dominant or lagging. Ideal for sales or market data.
Clear Visual Hierarchy
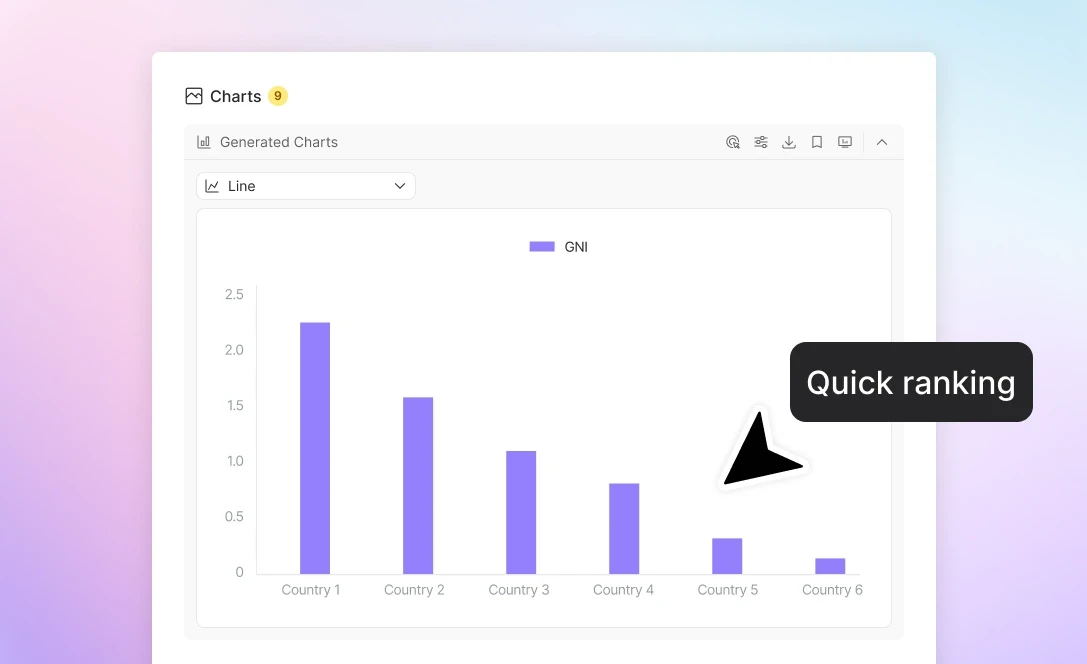
The height of bars shows the magnitude clearly. Understand data priorities at a glance. Useful for presenting priorities or rankings.
Simple Data Storytelling
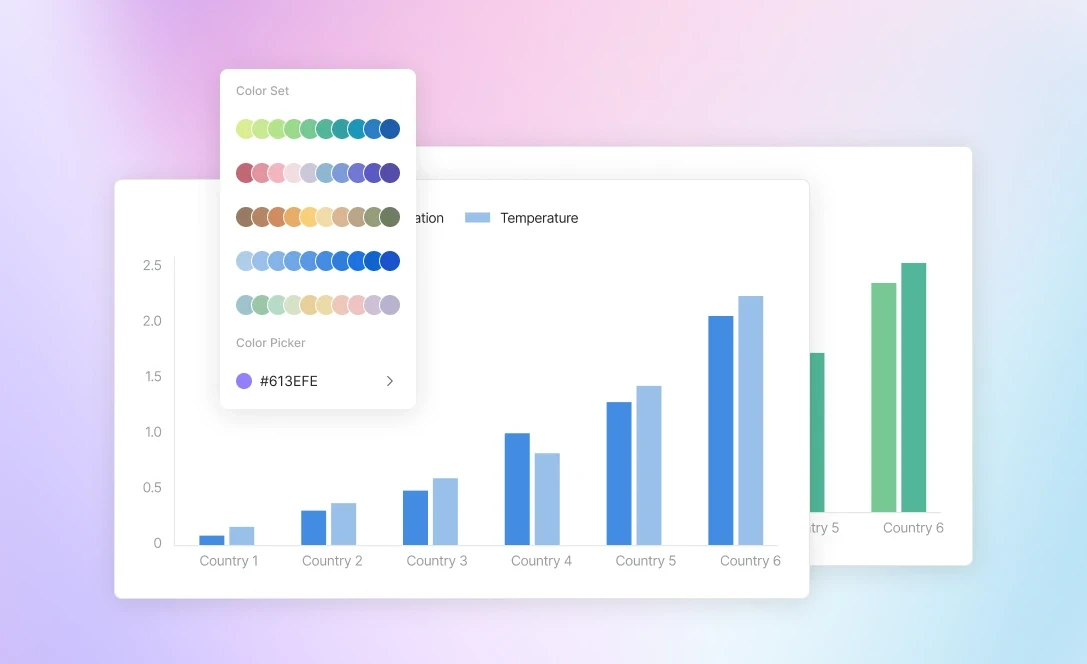
Convey complex data simply with bar graphs. Engage your audience and make data memorable. Great for reports and presentations.
Cách hoạt động
Upload data
Upload your data effortlessly. Supports various formats like CSV and Excel. Just select the file and start the process.
Choose the Type
Pick from different graph types. Whether horizontal or vertical, customize to your needs and data nature.
Download the Graph
Download the completed bar graph quickly. Available in PNG and excel formats. Ready to use in your projects or share with others.
Câu hỏi thường gặp
What is Powerdrill AI?
+
Powerdrill AI is an AI SaaS service centered around personal and enterprise datasets. Designed to unlock the full potential of your data, Powerdrill enables you to use natural language to effortlessly interact with your datasets for tasks ranging from simple Q&As to insightful BI analysis. By breaking down barriers to knowledge acquisition and data analysis, Powerdrill AI boosts data processing efficiency exponentially.
How can I use Powerdrill AI?
+
Log in to Powerdrill AI, and then you can message Powerdrill anything you want to ask.
However, that's not our top recommendation. Powerdrill AI excels at processing data-centric tasks, offering connectors to various data types such as PDFs, Excel files, PowerPoints, CSVs, TSVs, and, most impressively, SQL databases. You can upload your data to train a custom AI assistant tailored to your specific needs.
Is Powerdrill AI free?
+
You can start using Powerdrill for free. Powerdrill offers free quotas to several features. However, if you want to try more fantastic features, such as understanding images, text-to-image converters, and connectors to SQL databases, you need to upgrade your plan. For more information, see Pricing Plans.
How does Powerdrill AI work?
+
Powerdrill leverages top-notch AI technologies, such as GPT-3.5, GPT-4, GPT-4 Turbo, GPT-4o, and DALL·E to deliver precise and tailored responses, ensuring you receive accurate information efficiently.
Can I analyze spreadsheets with multiple tabs?
+
Absolutely. Simply upload your multi-tab spreadsheet. Afterwards, you can start ask questions about your spreadsheet. If you want Powerdrill AI to analyze specific tabs, just reference the specific tab names in your prompts.
Does Powerdrill AI have a privacy notice?
+
Absolutely yes. At Powerdrill, safeguarding your privacy and ensuring data security are our top priorities. In addition to our comprehensive privacy notice, we are dedicated to compliance with regulations such as GDPR, ISO 27001, and SOC2 (in progress), demonstrating our commitment to protecting your information.
More efforts we've done in security and compliance can be found in the Security page and our Trust Center.
How can I get in touch with you for questions or to share feedback?
+
Experience issues, discover bugs or have suggestions for Powerdrill? Share with us! We‘ll promptly review your feedback within 48 hours. For any valid issues, bugs, or suggestions, we‘ll offer additional usage credits to express our thanks.
To ask questions or provide feedback for Powerdrill, simply log in, select your profile at the bottom left corner, and then click on the Feedback section to enter your comments.