How to Turn Data Into Graphs With AI: The Complete Guide for 2026

Introduction
If you are still spending hours wrestling with pivot tables or manually adjusting chart colors, you are falling behind. After testing dozens of data visualization tools with sample business datasets, I found a definitive truth: using AI agents like Powerdrill Bloom to turn data into graphs is exponentially faster than manual creation. The era of needing a data scientist to understand your metrics is over.
In this complete 2026 guide, I will show you exactly how to automate your workflows and extract actionable insights instantly. For an even deeper dive into the mechanics of this process, I highly recommend checking out our related guide: Create Stunning Charts from Excel, CSV, or PDF — Instantly with AI.
Here is how you can leverage AI to turn your raw data into crystal-clear visualizations today.
What You Need Before Starting AI Data Visualization
Before we dive into the steps, let’s ensure you have the basics ready. You don’t need a background in SQL or Python—just these three things:
1. Your Data: Have your raw data ready. This can be an Excel spreadsheet, a CSV file, or even a PDF containing tables and unstructured metrics.
2. A Powerdrill Bloom Account: This is the core AI agent we will use. It acts as an autonomous data analyst that processes metrics and outputs stunning visuals. It offers a generous Freemium tier so you can start immediately. For power users needing advanced features and mass slide generation, the premium subscription is highly competitive, starting at just $13.27 per month.
3. Clear Goals: Know what you want to extract. Are you looking for quarterly revenue trends? Customer churn rates? Having a clear business question helps the AI give you the sharpest answers.
How to Convert Data into Professional Graphs Using AI Tools Like Powerdrill Bloom: A Step-by-Step Guide
Transforming a messy Excel to graph format is now a seamless process. Here is your actionable, step-by-step framework:
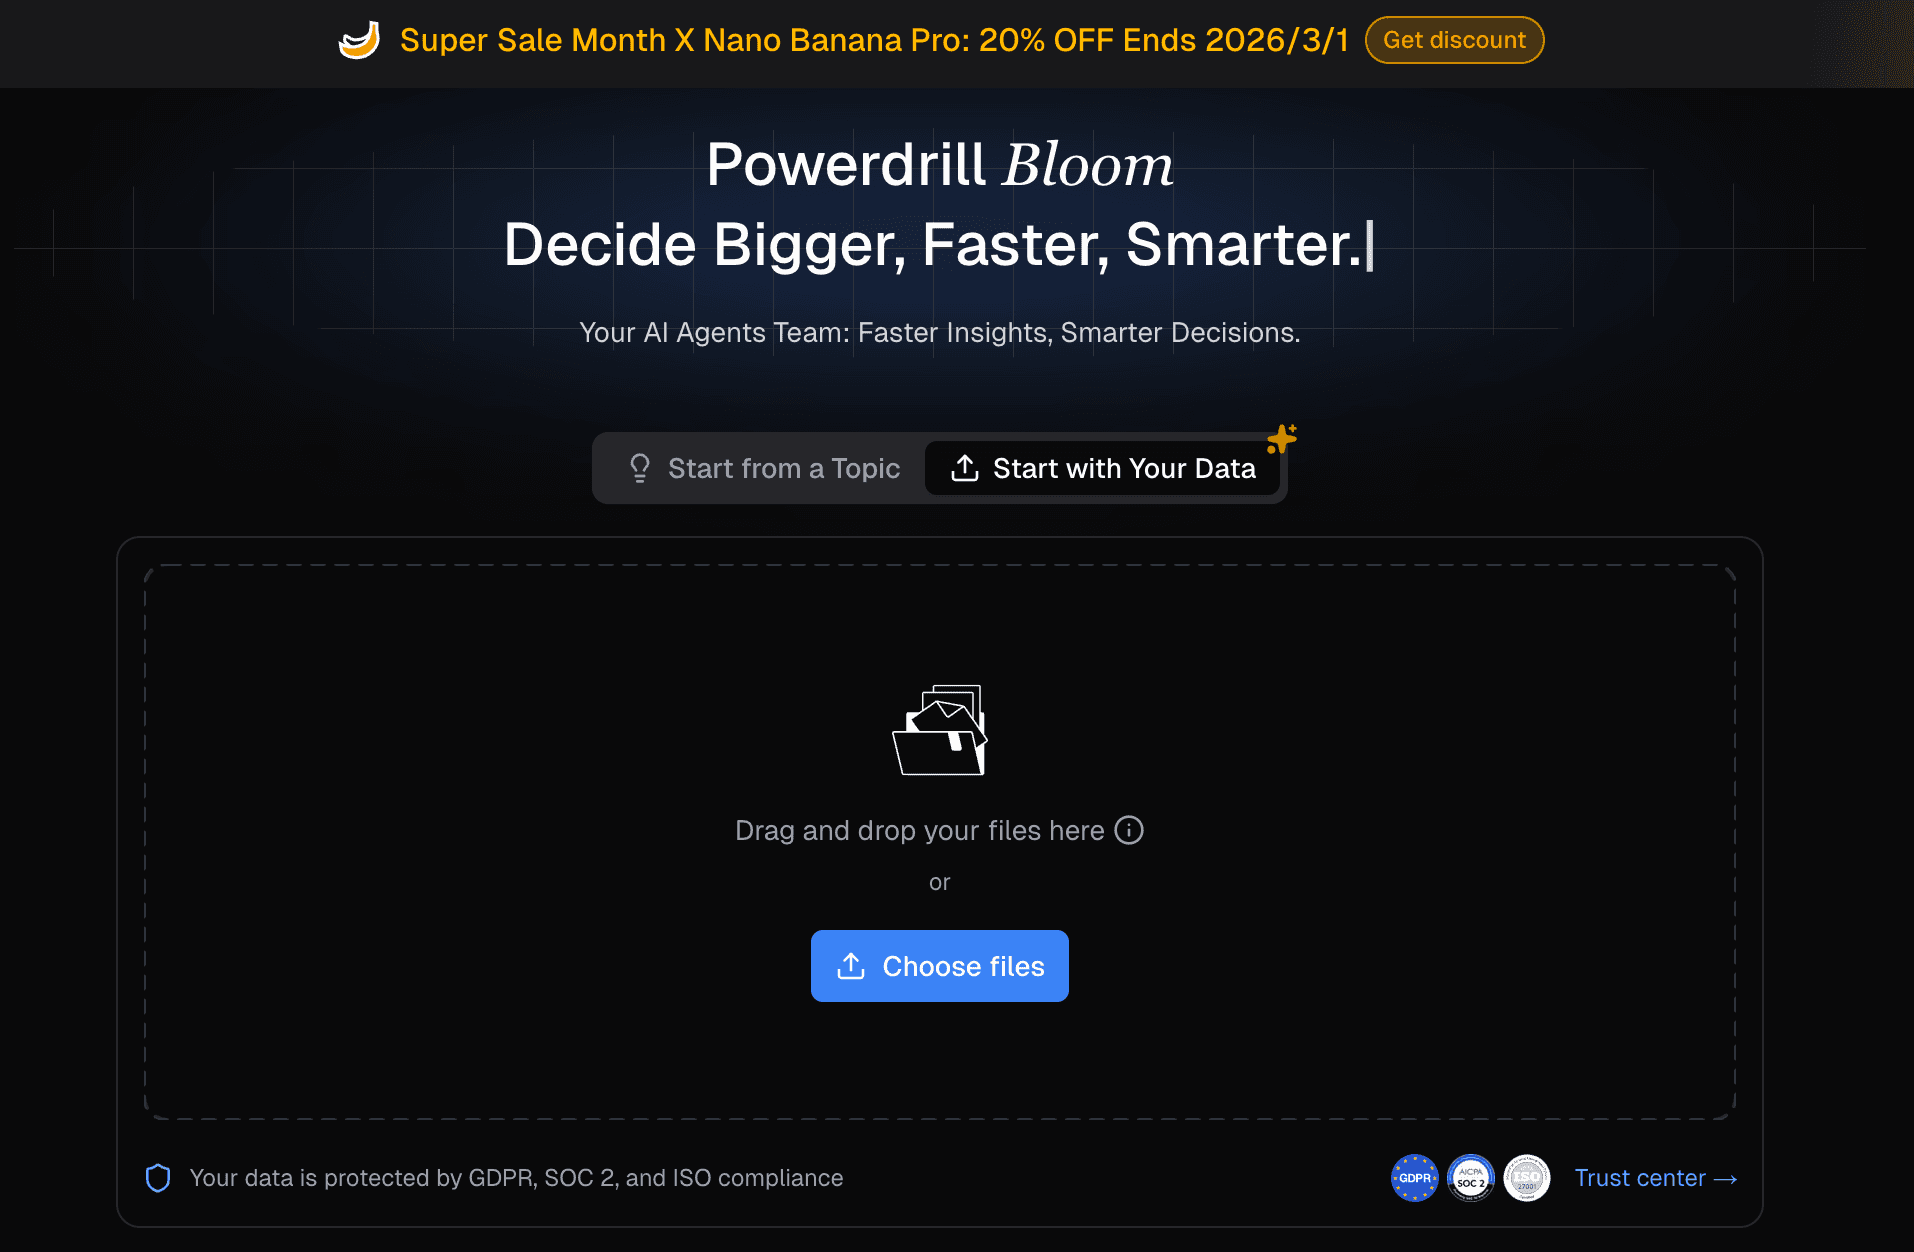
Step 1: Upload & Clean
Simply drag and drop your raw files into the interface. You don't need to format your columns perfectly; the AI will automatically clean, categorize, and reshape complex data, handling missing values and anomalies on its own.
Step 2: Ask in Natural language
Skip the complex formulas. Use natural language commands to tell the AI what you want to see. Just type prompts like "Show me the sales growth by region over the last 12 months"—no SQL or coding required.
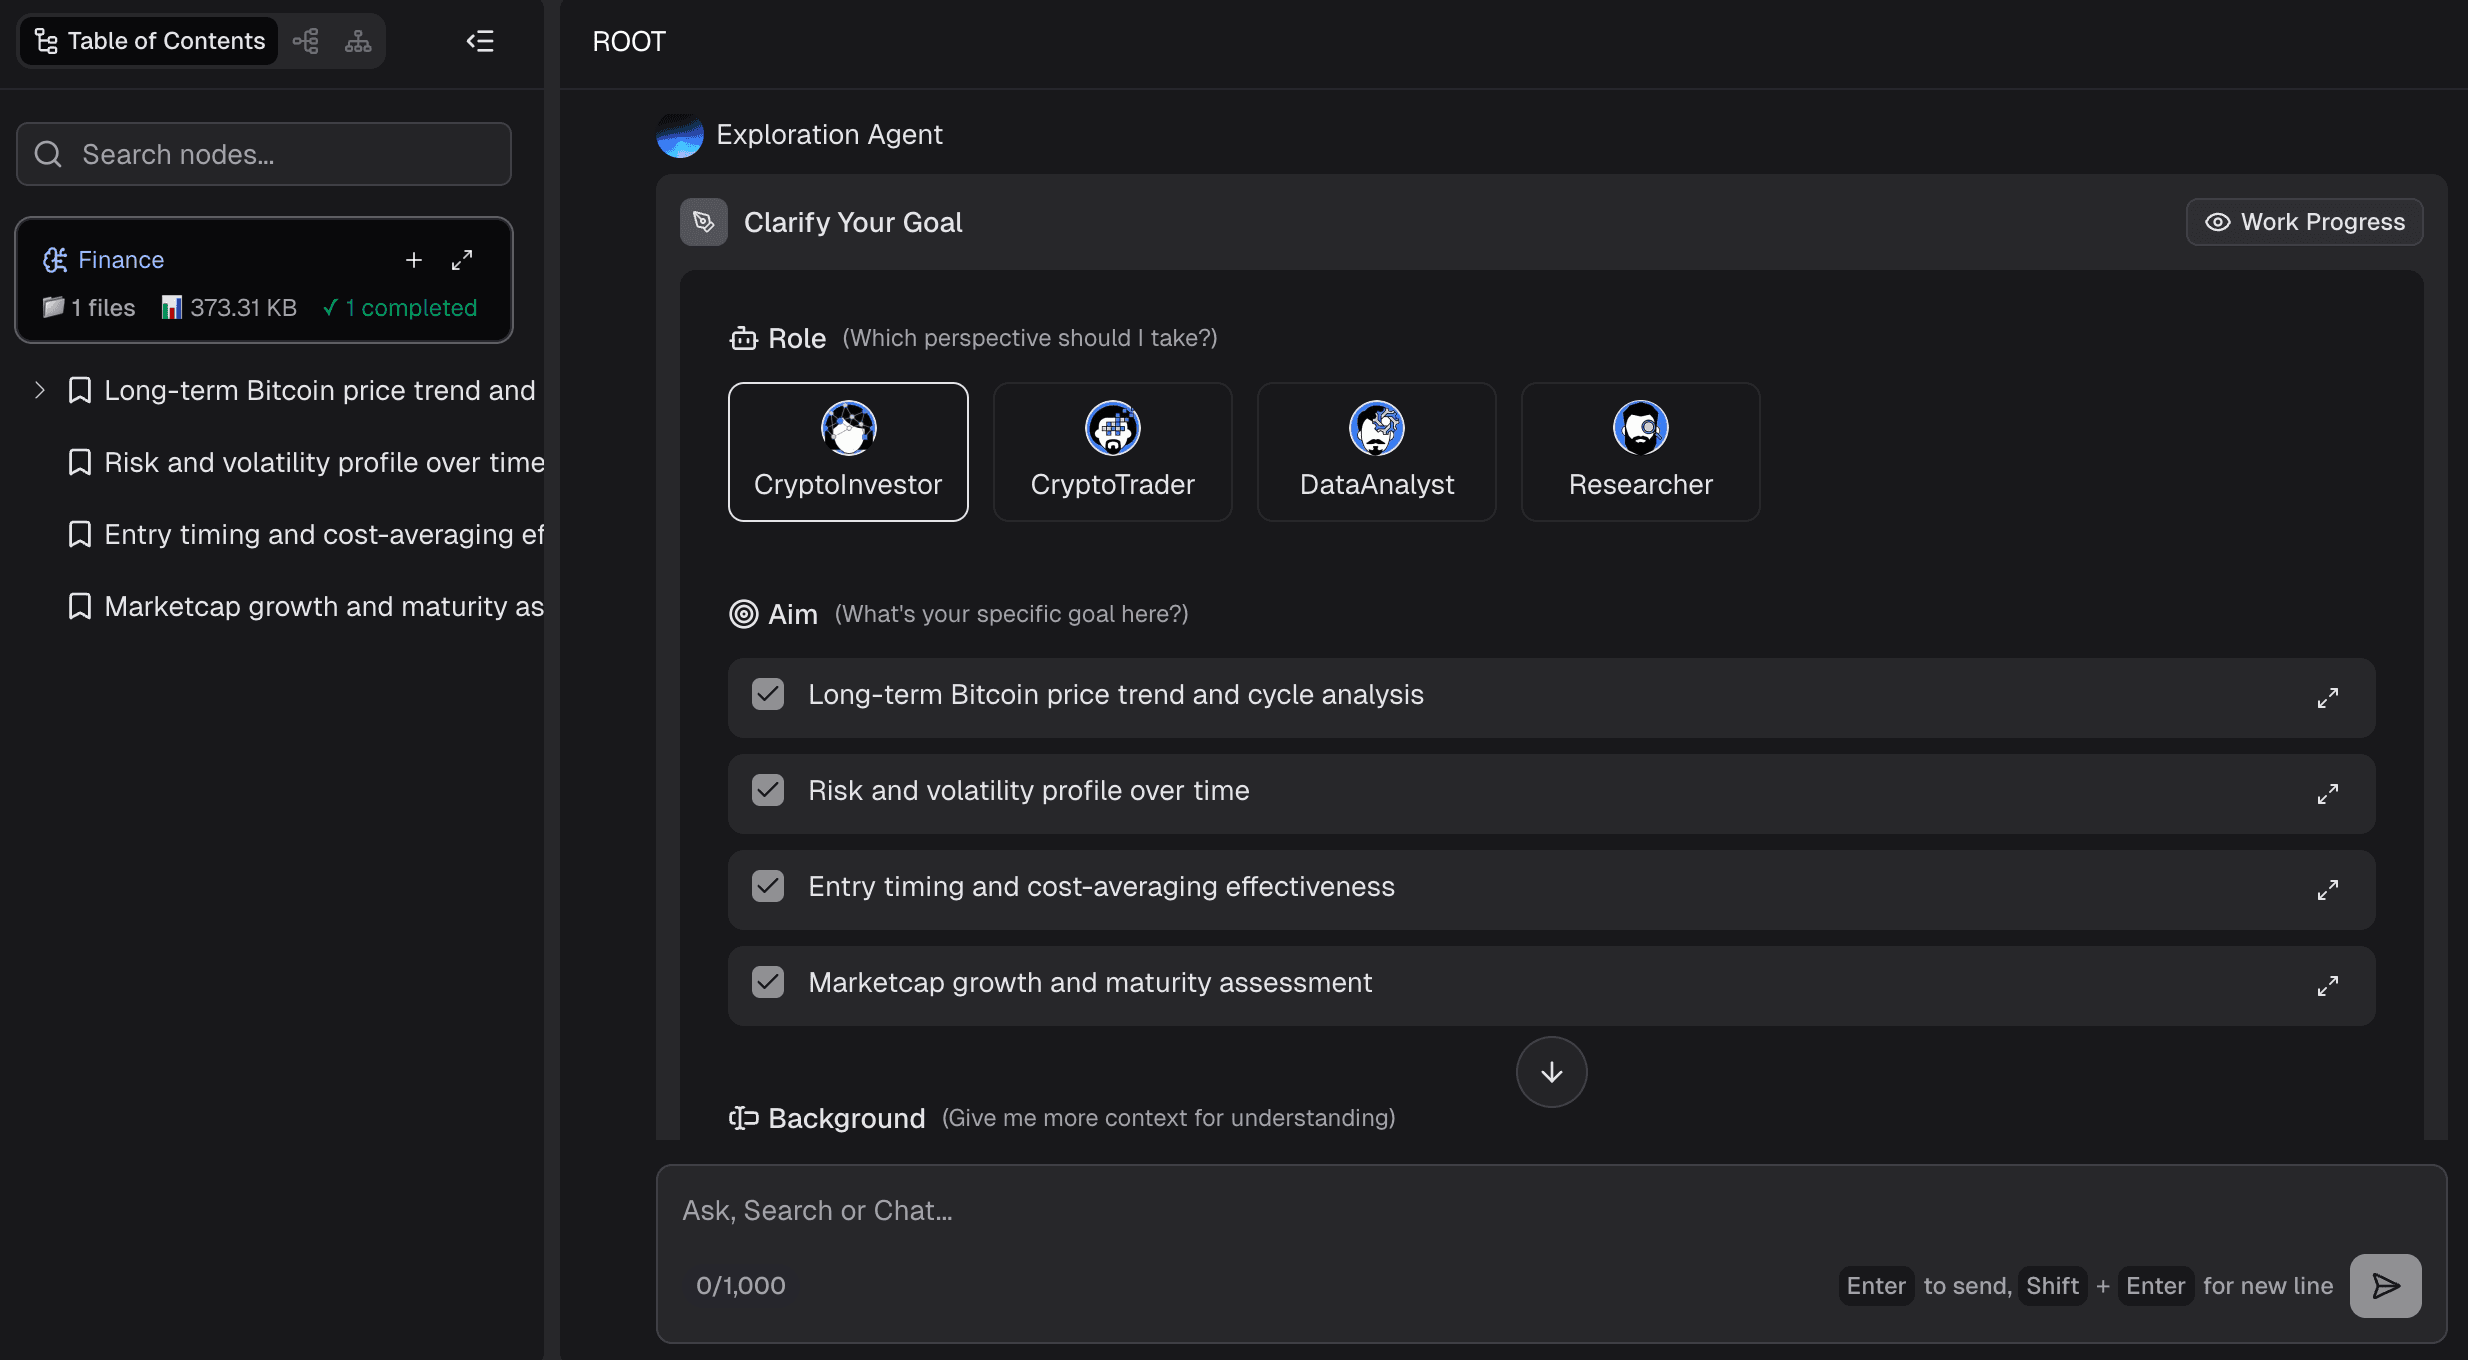
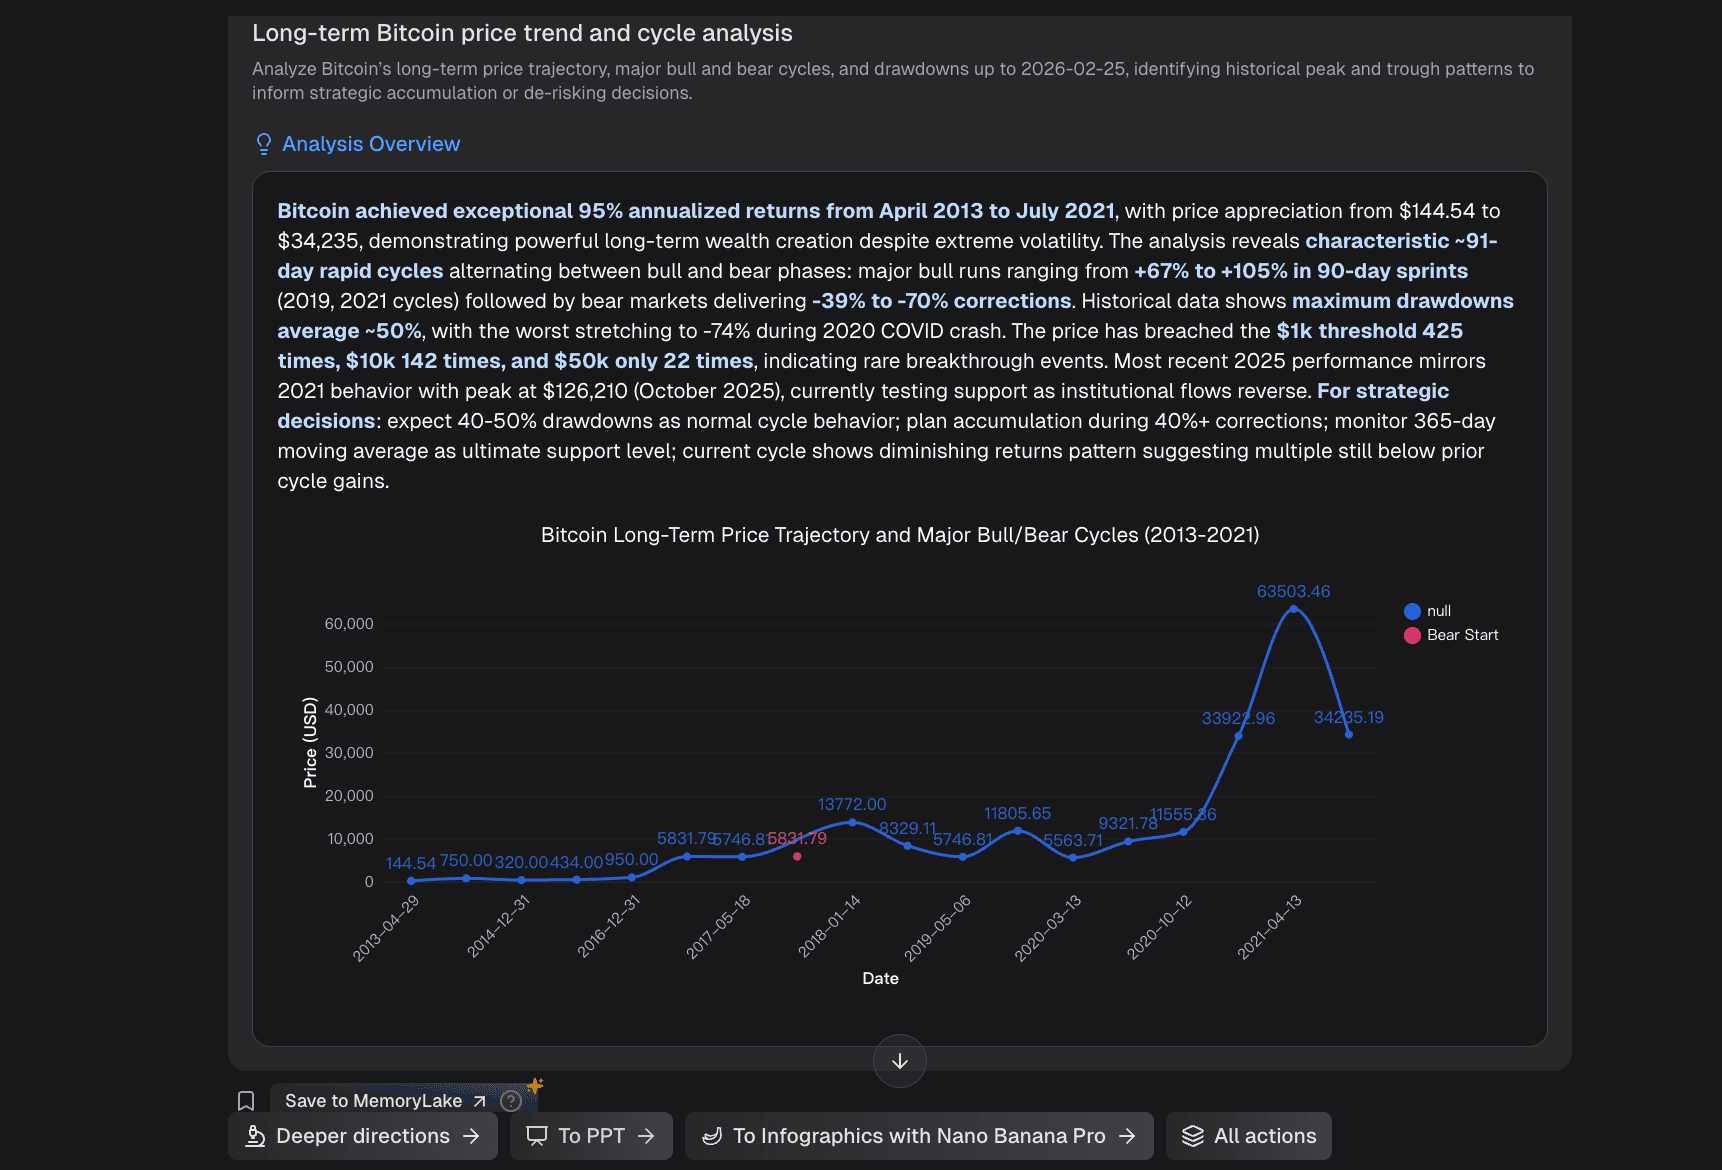
Step 3: AI Exploration & Chart Generation
Watch as the AI deeply explores data trends and instantly recommends the optimal visual format. With a single click, it generates perfectly calibrated bar charts, line graphs, pie charts, or complex infographics tailored to your specific metrics.
Step 4: Export & Share
Once you have the perfect visualization, export your polished visuals directly. You can download them as high-res images or embed them directly into your reporting workflows, delivering powerful business insights to your team.
Automated PPT Generation
What sets modern AI apart is that it doesn't stop at a single chart. Powerdrill Bloom features an Automated PPT Generation capability. It transforms your raw data directly into a fully structured, multi-slide presentation. The AI automatically populates the slides with the generated charts, adds valuable contextual insights, and creates executive summaries—all requiring absolutely no design skills.
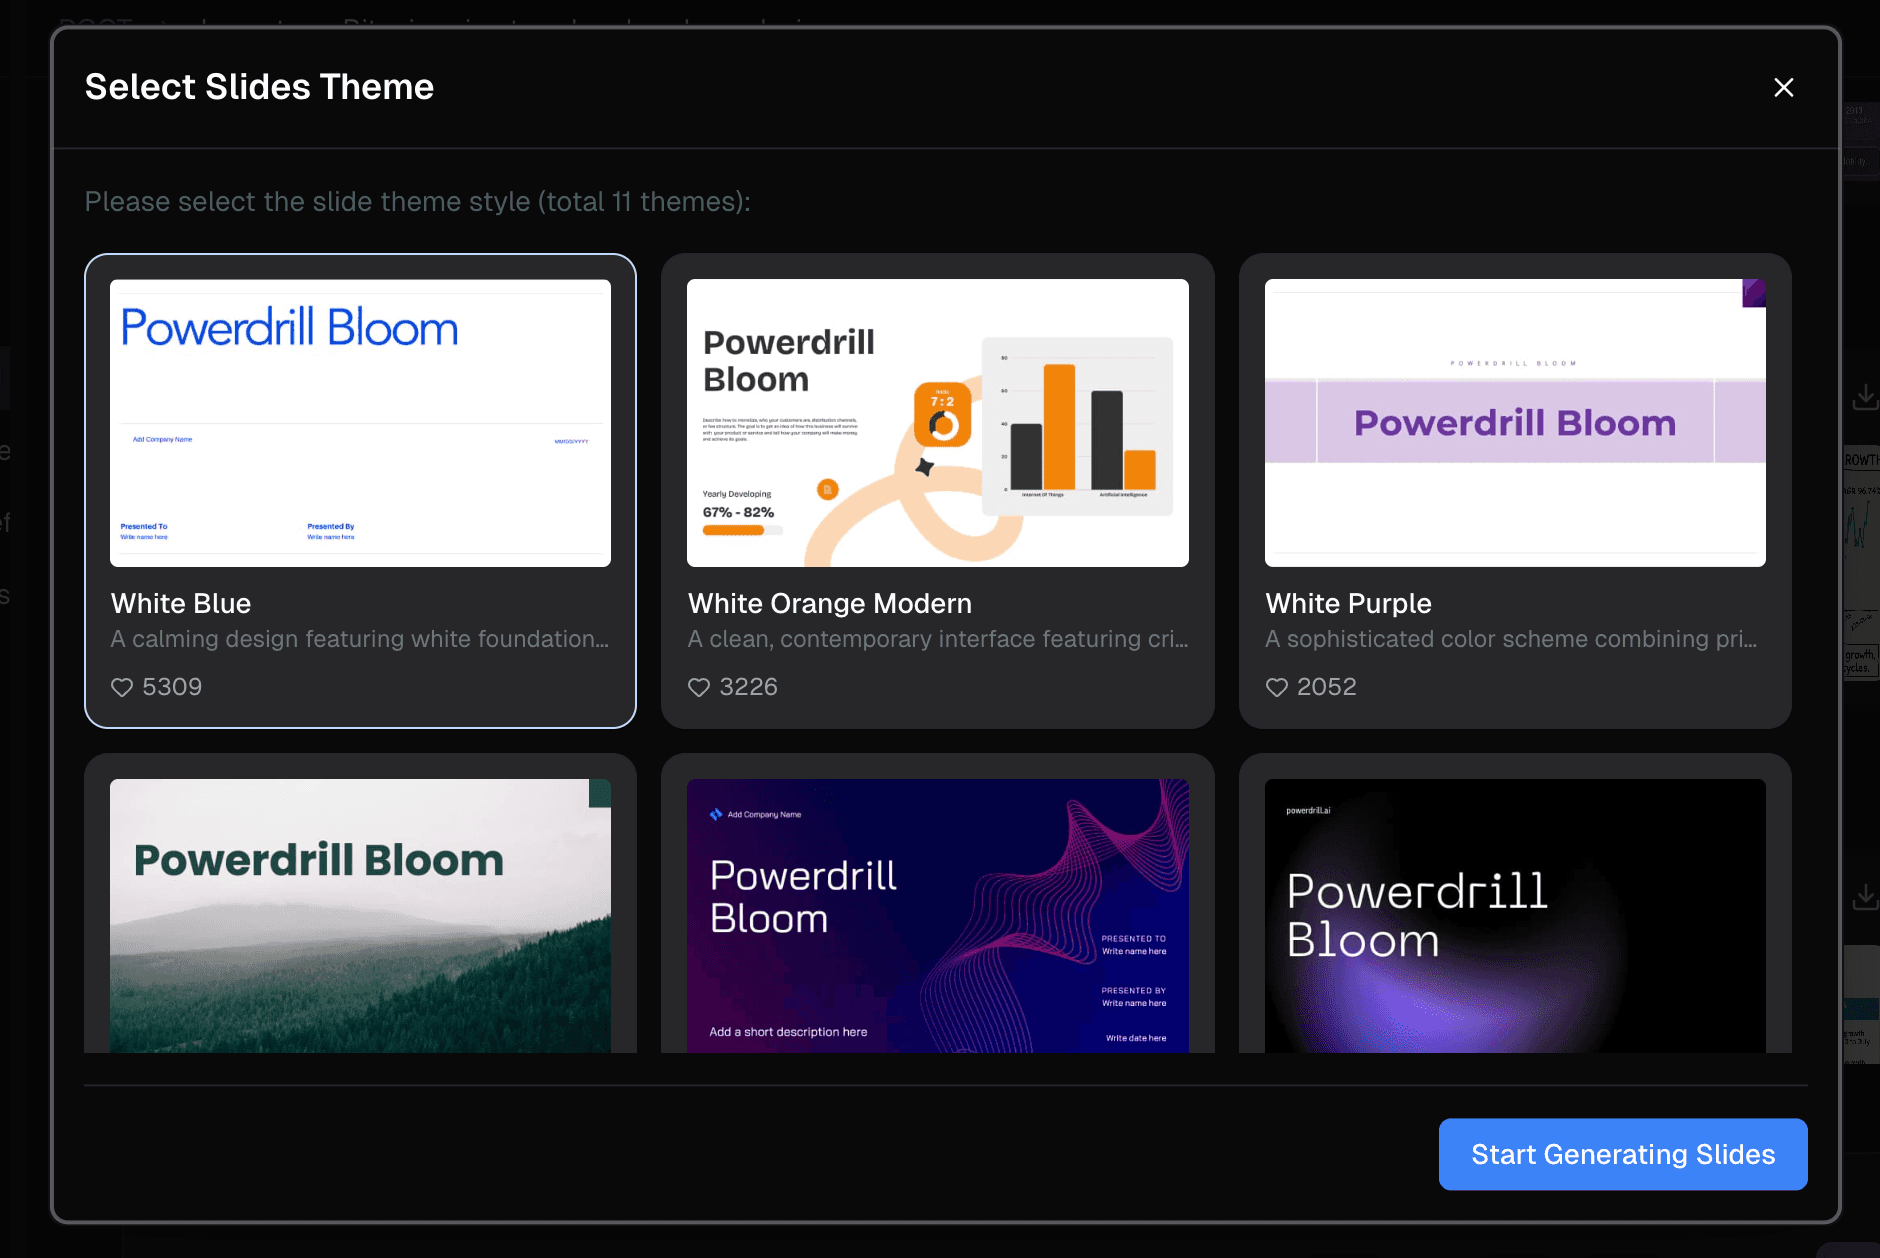
Elevate Your Presentation with Nano Banana Pro
To make your data truly stand out in the boardroom, Powerdrill Bloom is embedded with the Nano Banana Pro visual engine.
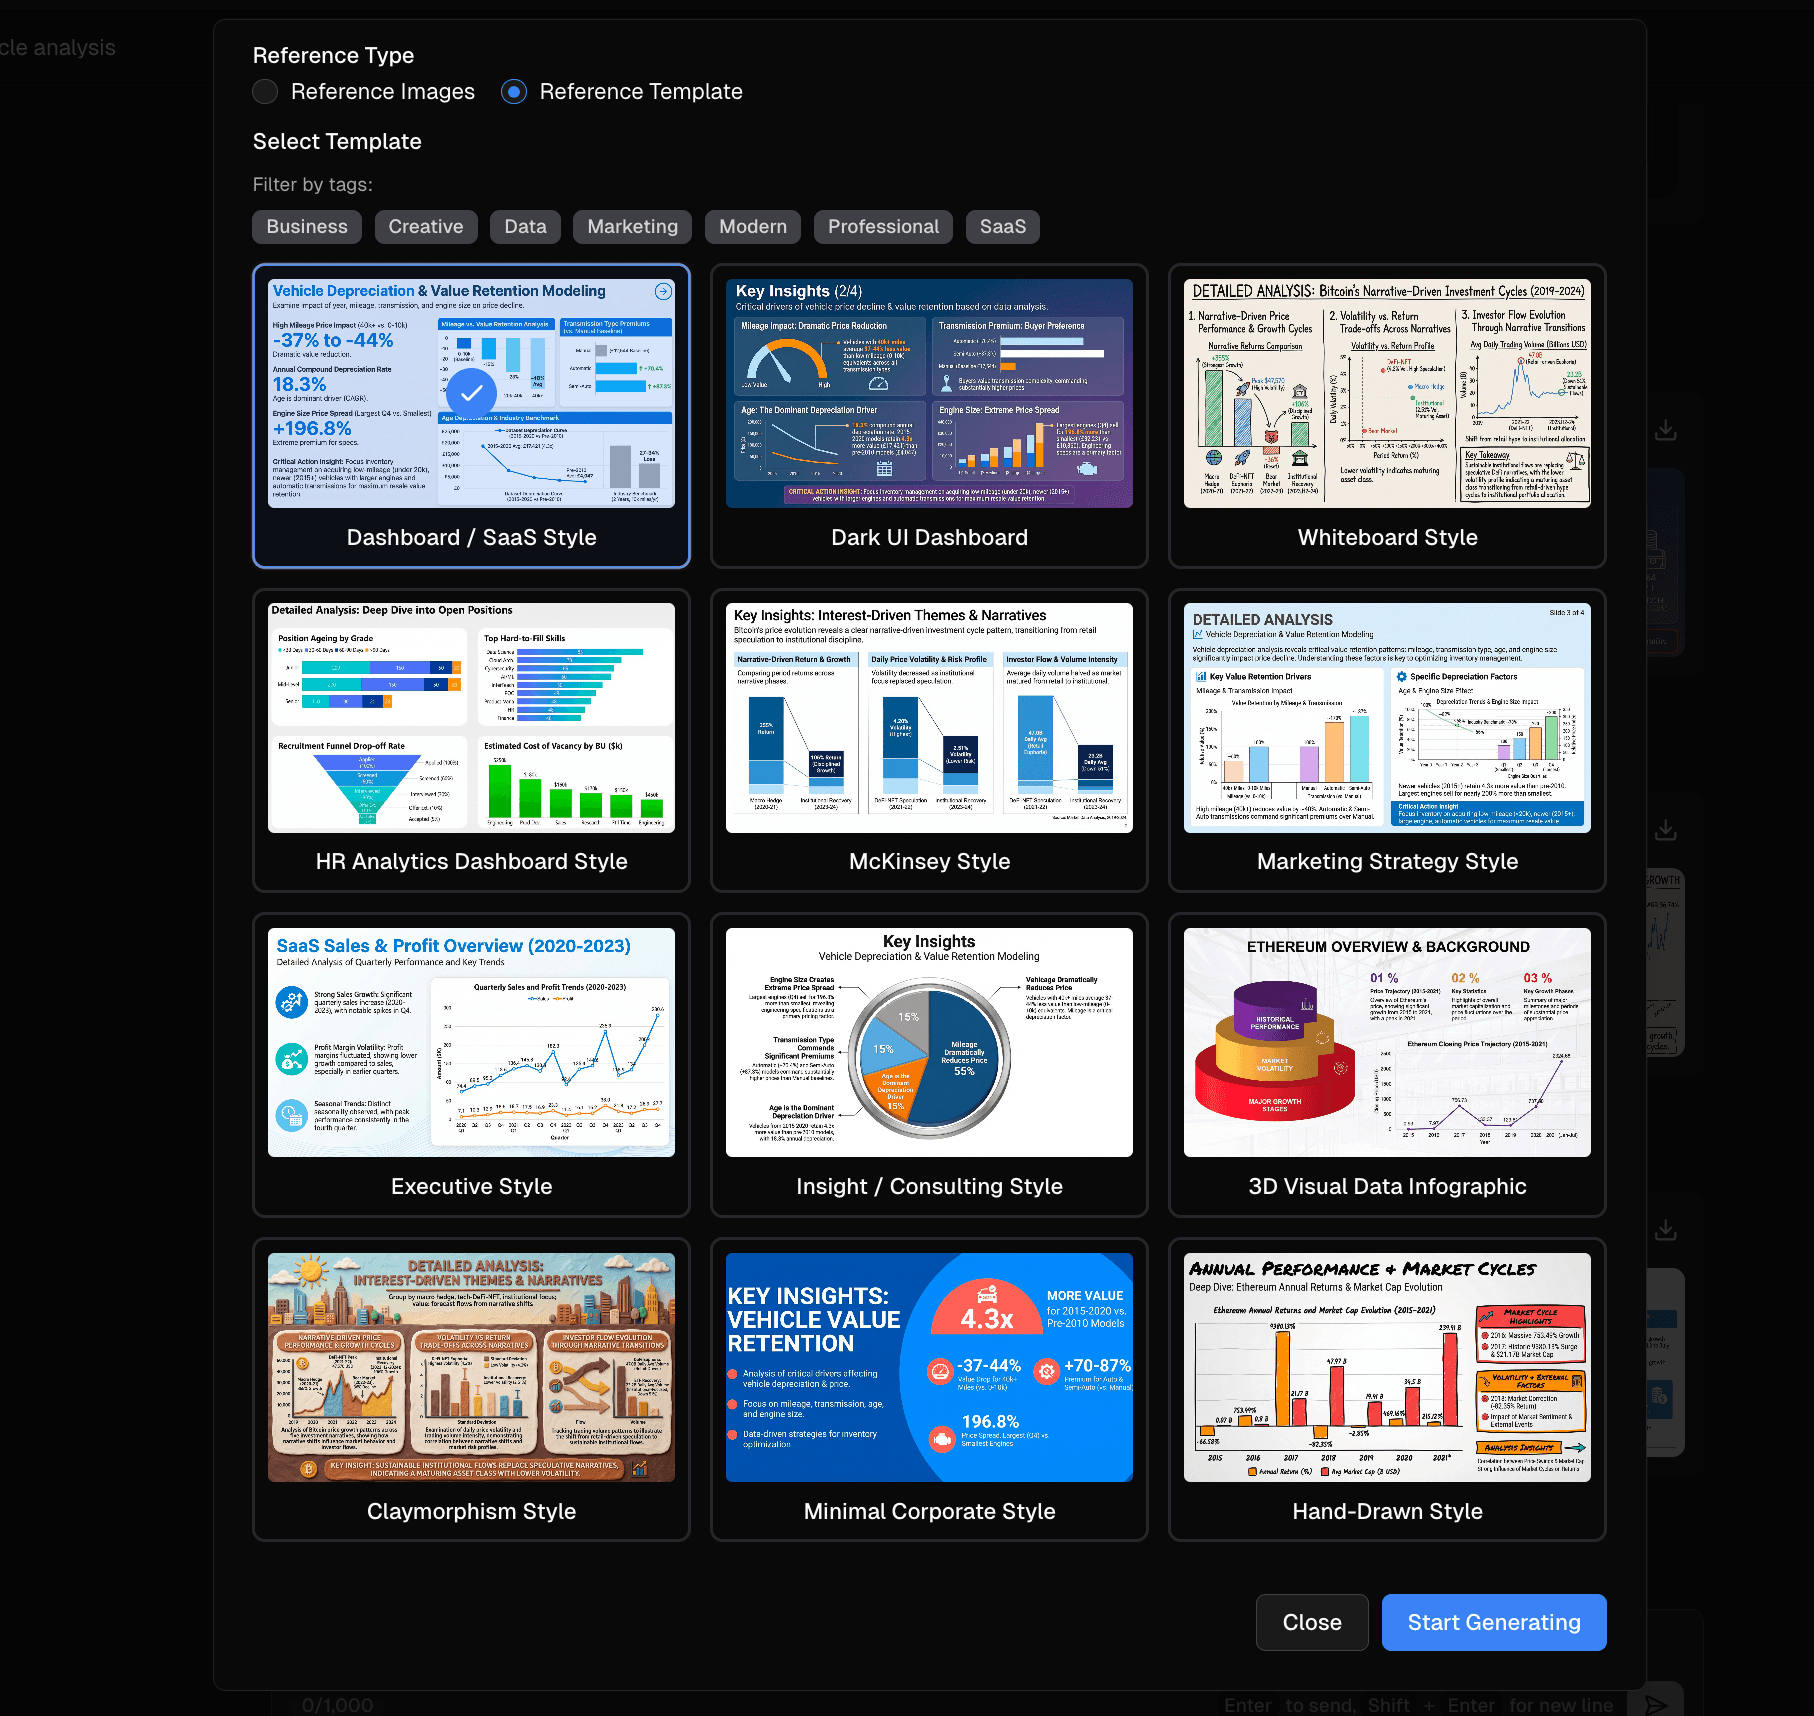
This engine is designed to generate highly professional, "business-fancy" slides and infographics that look like they were crafted by a top-tier design agency. You can seamlessly switch between distinct template styles tailored for specific scenarios:
Business: Clean, corporate layouts for executive summaries and board meetings.
Finance: High-contrast, precise templates optimized for revenue tracking and P&L reports.
Data Analysis: Detailed, multi-layered visual structures for deep dives into metrics.
SaaS Dashboard: Modern, sleek UI/UX aesthetics perfect for tech startups and software metrics.
Common mistakes to avoid
Even with powerful AI, beginners often stumble. Here are 3 common mistakes and how AI helps you avoid them:
Mistake 1: Unclear Data Goals. Uploading data without knowing what you want to solve leads to noise. AI Fix: Powerdrill Bloom automatically detects key patterns and suggests relevant questions to ask your data.
Mistake 2: Choosing the Wrong Chart Type. Using a pie chart for trend data is a classic error. AI Fix: The AI natively understands data relationships and automatically applies the optimal chart type (e.g., line charts for time-series data).
Mistake 3: Overcrowding the Visuals. Too much data on one graph confuses the audience. AI Fix: The engine intuitively filters out non-essential variables to keep the visualization crisp and impactful.
Why Powerdrill Bloom Makes AI Data Visualization Effortless
Powerdrill Bloom consolidates your entire workflow into one intuitive platform. Here is how it fundamentally changes data analysis:
Free AI Excel Analysis Tool: Automated Insights & Visualization
Upload your Excel files, and the AI will automatically explore the data, detect critical patterns, and generate actionable insights with clear visualizations in seconds.Create PPT Slides from Any Topic or File with AI
Whether you input a text topic or upload an Excel, CSV, or PDF file, the AI comprehends the context and autonomously builds a professional PowerPoint presentation.Generate Stunning AI-Powered Reports from Excel, CSV, or PDF or a Specific Topic in Seconds
Stop wasting hours on formatting. Instantly turn your files or ideas into clear, insightful reports that are ready to share with your team.
Ready to use AI to go from data to graph without the manual work? Try Powerdrill Bloom for free today.
Frequently Asked Questions
What is "Turn Data Into Graphs With AI"?
Turning data into graphs with AI is the process of using artificial intelligence algorithms to automatically analyze raw datasets, identify hidden trends, and instantly generate the most optimal visual representations (such as charts, graphs, and infographics). This drastically improves both operational efficiency and data accuracy compared to manual chart creation.
Can I create graphs from Excel files using an AI tool like Powerdrill Bloom?
Yes, absolutely. Powerdrill Bloom allows you to create stunning graphs directly from Excel files. It supports multiple formats (including CSV and PDF) and automatically cleans and structures your complex raw data before visualization, saving you hours of formatting.
Do I need coding skills to turn data into graphs using AI?
No, you do not need any coding skills. Modern AI tools are specifically designed for marketers, business teams, and non-technical users. You can process data and generate charts using natural language commands (plain English), entirely eliminating the need for SQL, Python, or advanced Excel formula knowledge.