10 Best AI Tools for Generating Infographics in 2026

Introduction
Standing here in 2026, looking back at the evolution of content marketing, one thing is clear: text alone no longer cuts it. In the peak of the "Attention Economy," Data Visualization and Visual Storytelling have become the currency of corporate communication.
I have just completed a rigorous closed-beta test of dozens of AI Tools for Generating Infographics. If you are tired of manually tweaking color palettes or staring blankly at massive Excel sheets, this article is for you. I have identified 10 tools that are not just "canvases," but intelligent assistants that truly "understand your data."
Comparison Table
After extensive testing, here is the Top 10 list for this year:
Tool Name | AI Ease of Use | Best For | Pricing Model |
★★★★★ | Business Data Analysis & Automated Visual Storytelling | Freemium / Pro | |
★★★★☆ | Reports & Long-form Infographics | Freemium | |
★★★★☆ | Interactive Charts & Presentations | Freemium | |
★★★★★ | Social Media & Lightweight Design | Freemium | |
★★★☆☆ | B2B Internal Communication | Freemium | |
★★★☆☆ | Media & News Data Visualization | Freemium | |
★★★★☆ | Automated Presentation Formatting | Subscription | |
★★★★☆ | Quick Social Media Graphics | Freemium | |
★★★☆☆ | Basic Posters & Flyers | Freemium | |
★★★★☆ | Creative Professionals | Freemium |
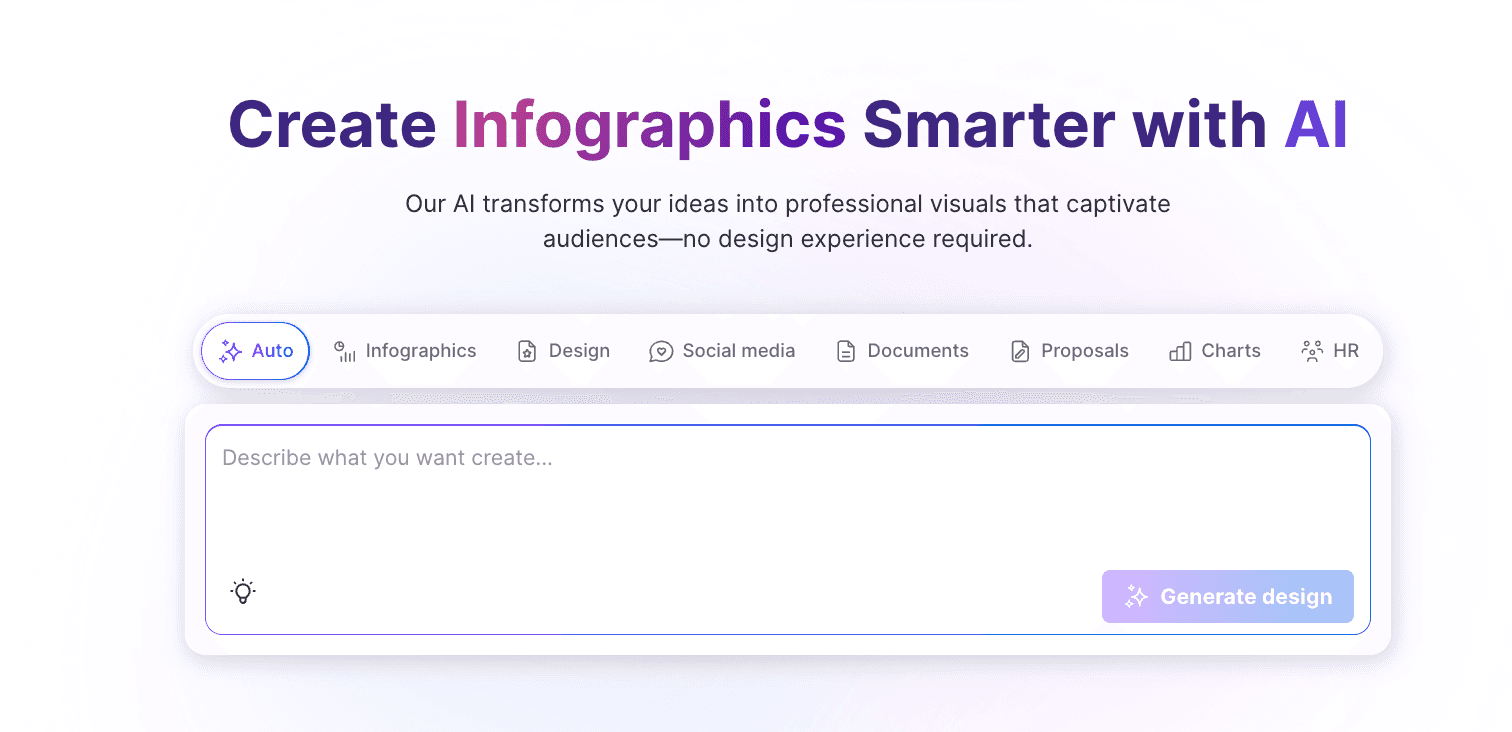
1. Powerdrill Bloom
An all-in-one data exploration and visual storytelling agent designed to transform complex business data into compelling visual narratives.
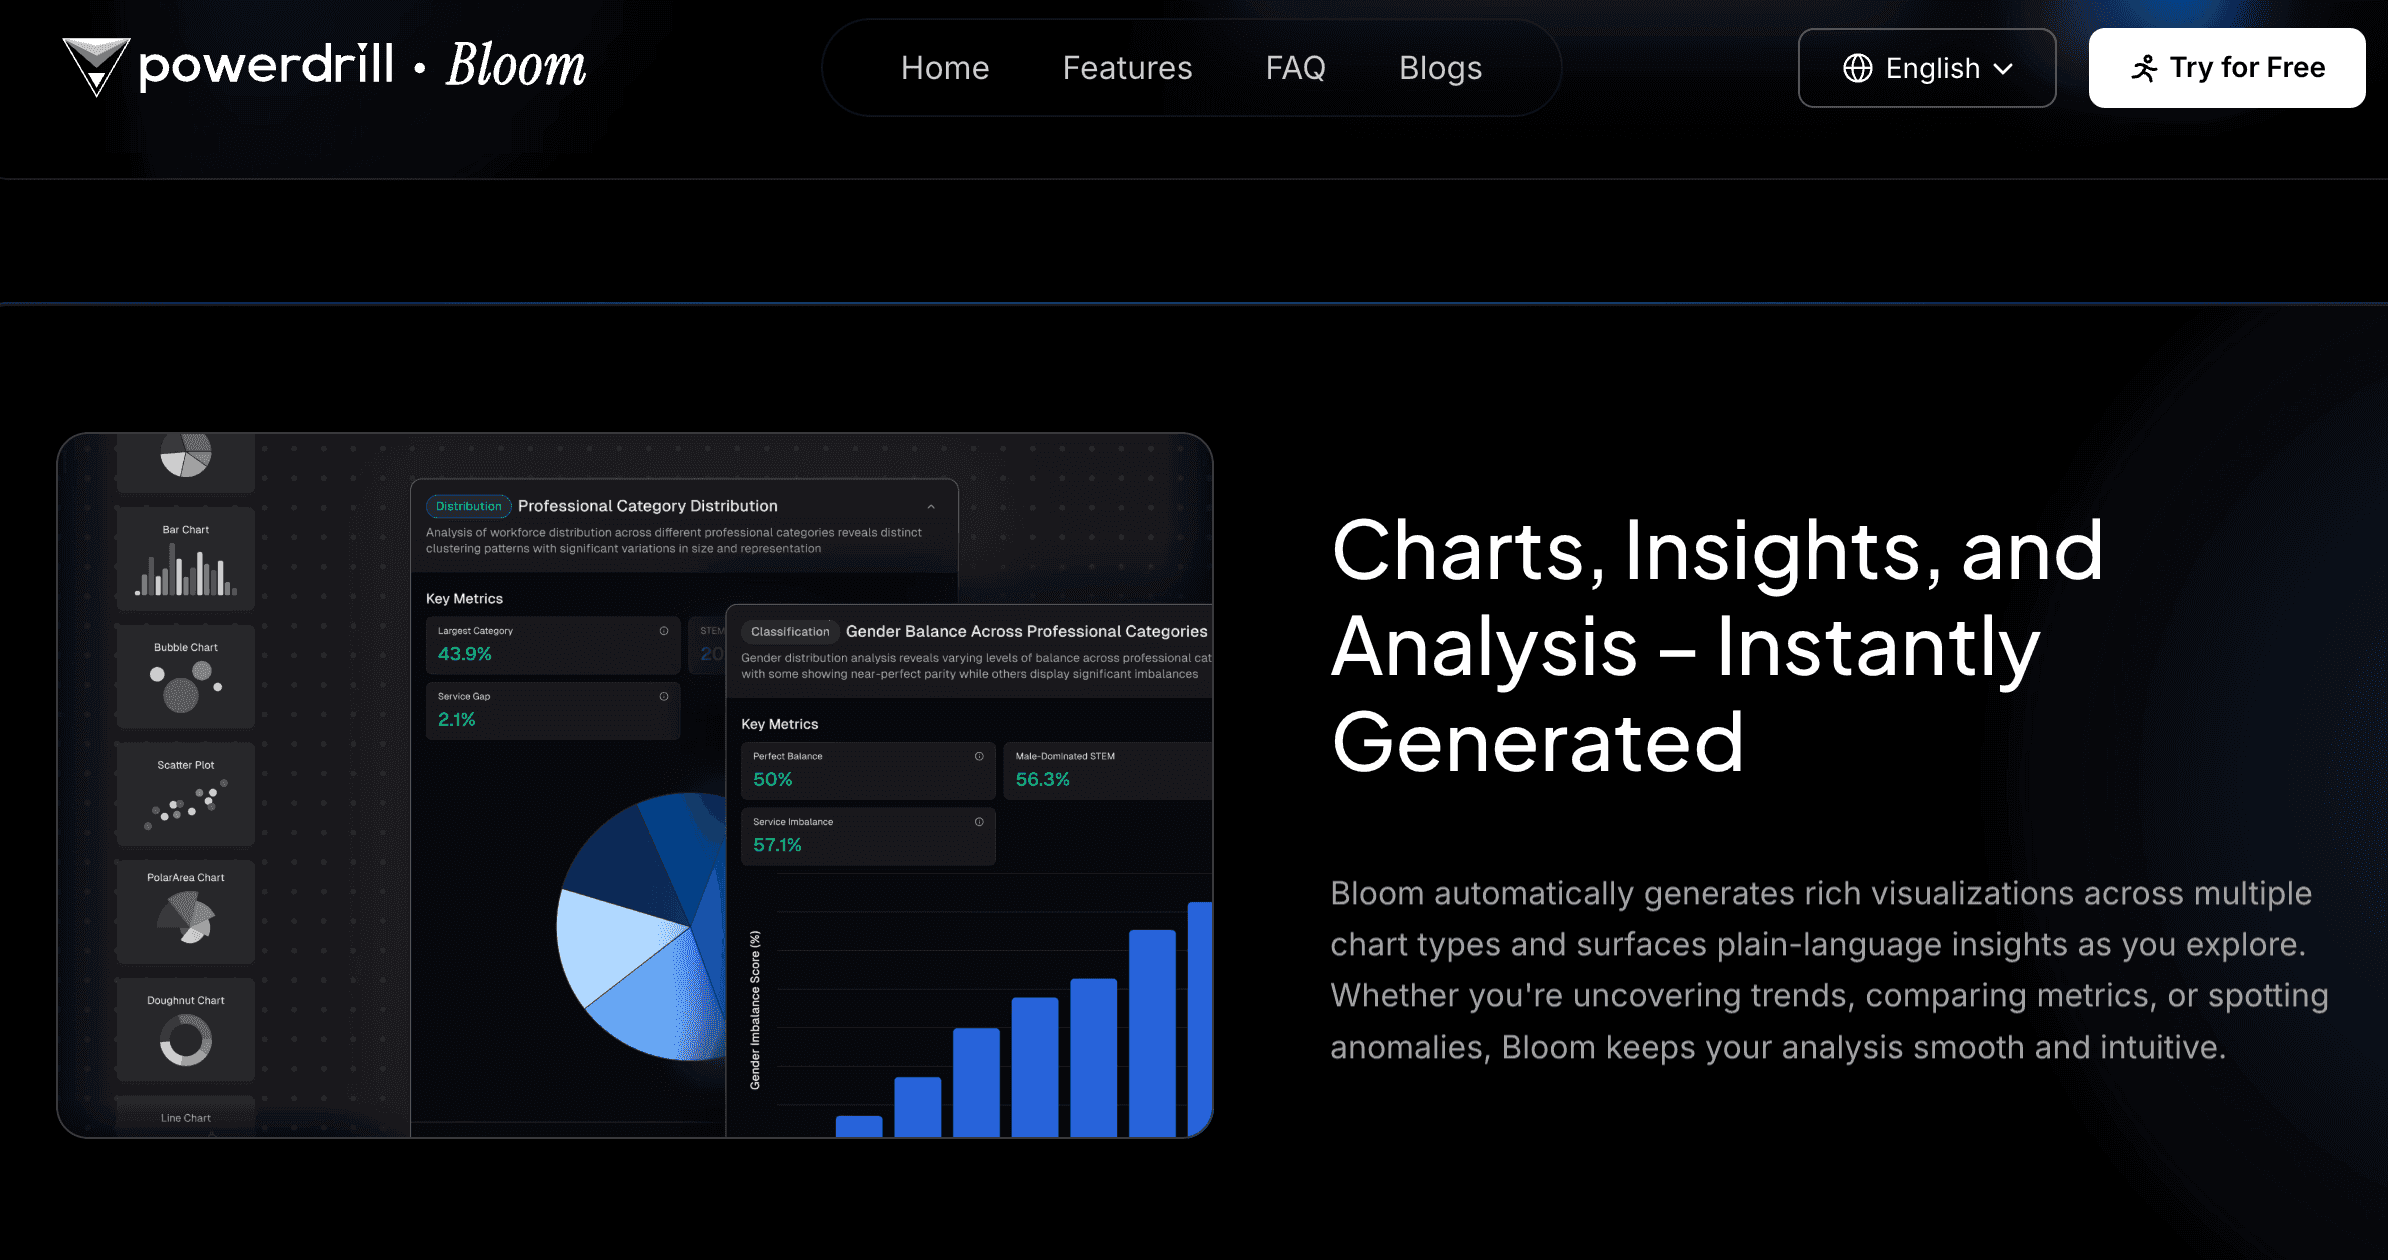
Key Features:
Universal Data Access & Deep Insights: Supports direct Excel/CSV/PDF uploads. AI automatically cleans data and performs multi-dimensional trend analysis (Extract Insights), giving non-analysts professional-grade understanding.
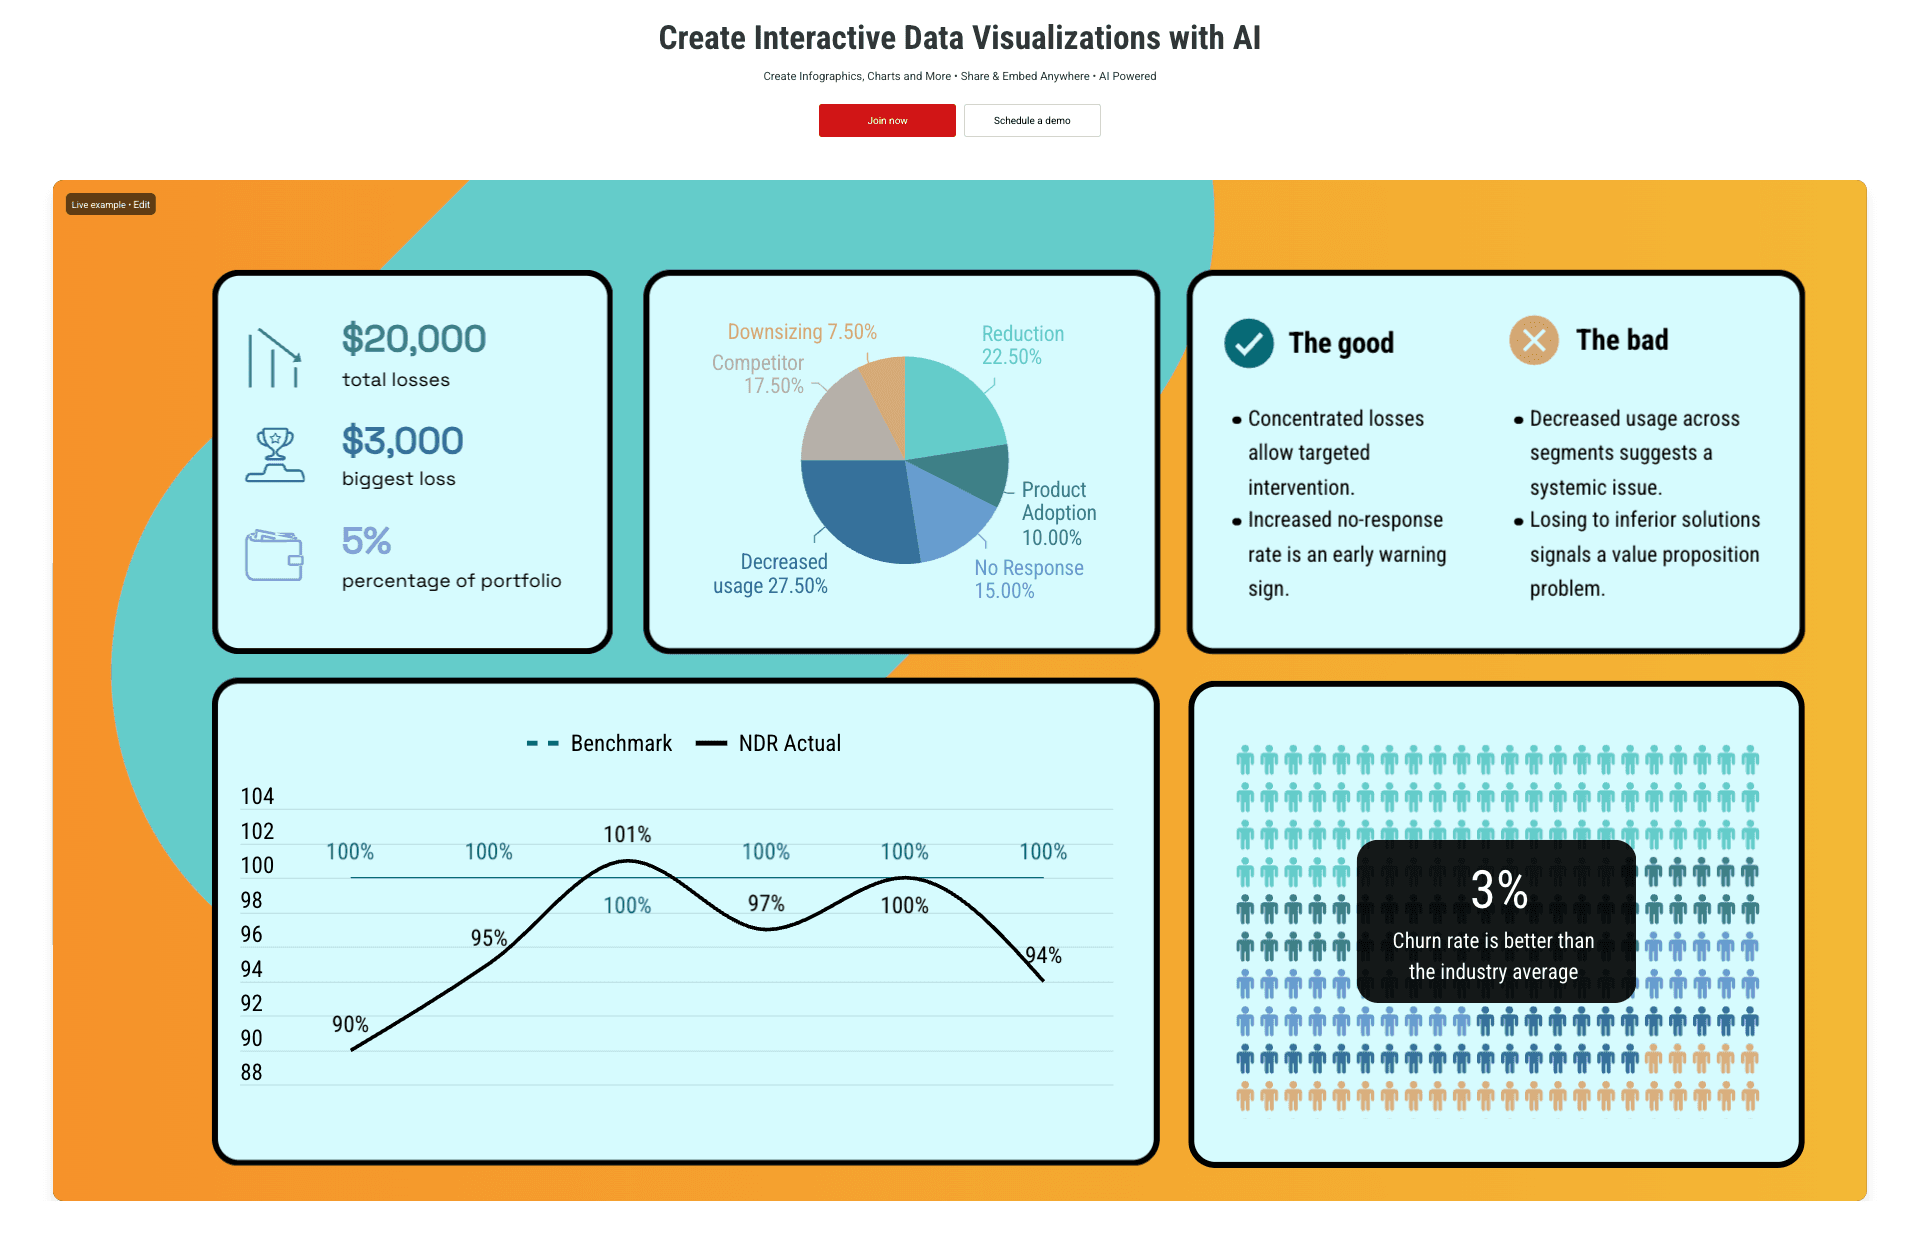
Nano Banana Pro Visual Engine: A powerful embedded engine that generates business-ready Slides and Data Preview Images in real-time based on data conclusions, requiring zero design skills.
Natural Language Interaction (NLP): Simply command, "Analyze this financial report and generate a growth trend chart," to handle the entire process from analysis to design.
Pros:
End-to-end automation (raw data to final chart); Nano Banana Pro visuals are highly persuasive for business; excellent multilingual support.
Cons:
Less focused on artistic/illustrative creation, more focused on data and business contexts.
Pricing:
Offers a free trial; advanced features require a Pro subscription.
2. Piktochart AI
A veteran tool focused on converting dry documents into engaging long-form infographics.
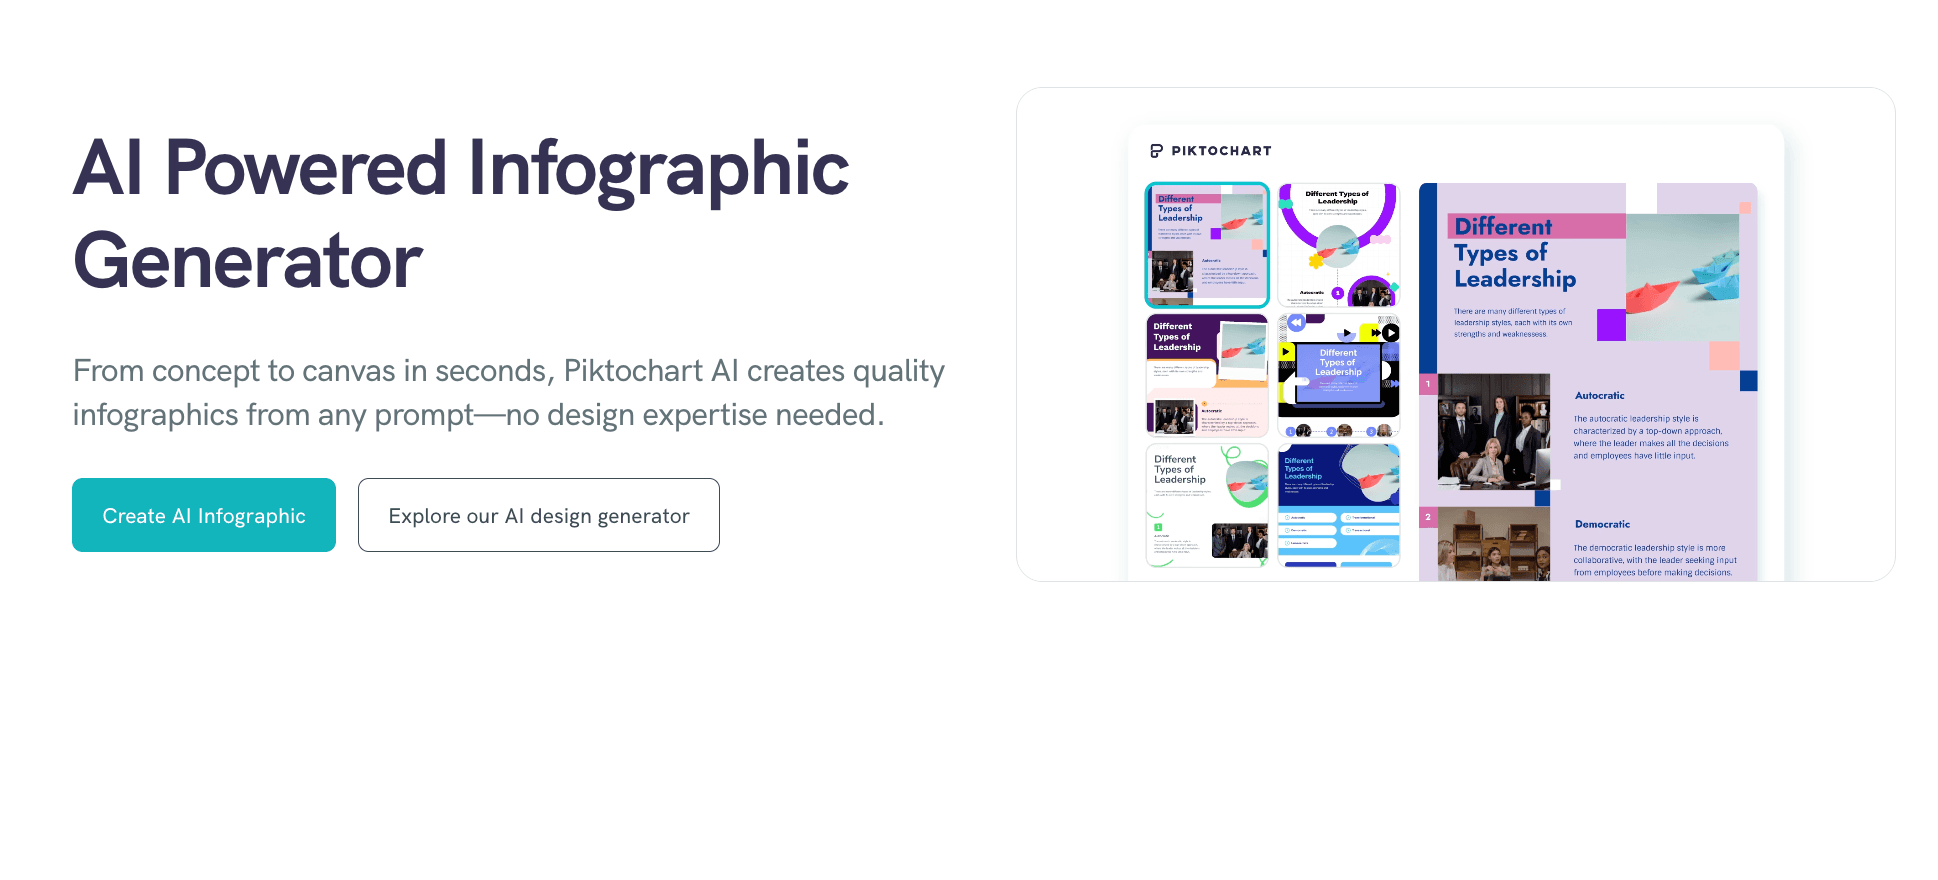
Key Features:
Strong long-form scrolling capabilities; rich educational and HR templates; one-click document-to-chart conversion.
Pros:
Perfect for blog graphics or recruitment posters; intuitive interface.
Cons:
Weak data processing capabilities; does not support complex data analysis.
Pricing:
Freemium, Pro subscription available.
3. Visme
An all-around design platform emphasizing interactivity, ideal for web-embedded charts.
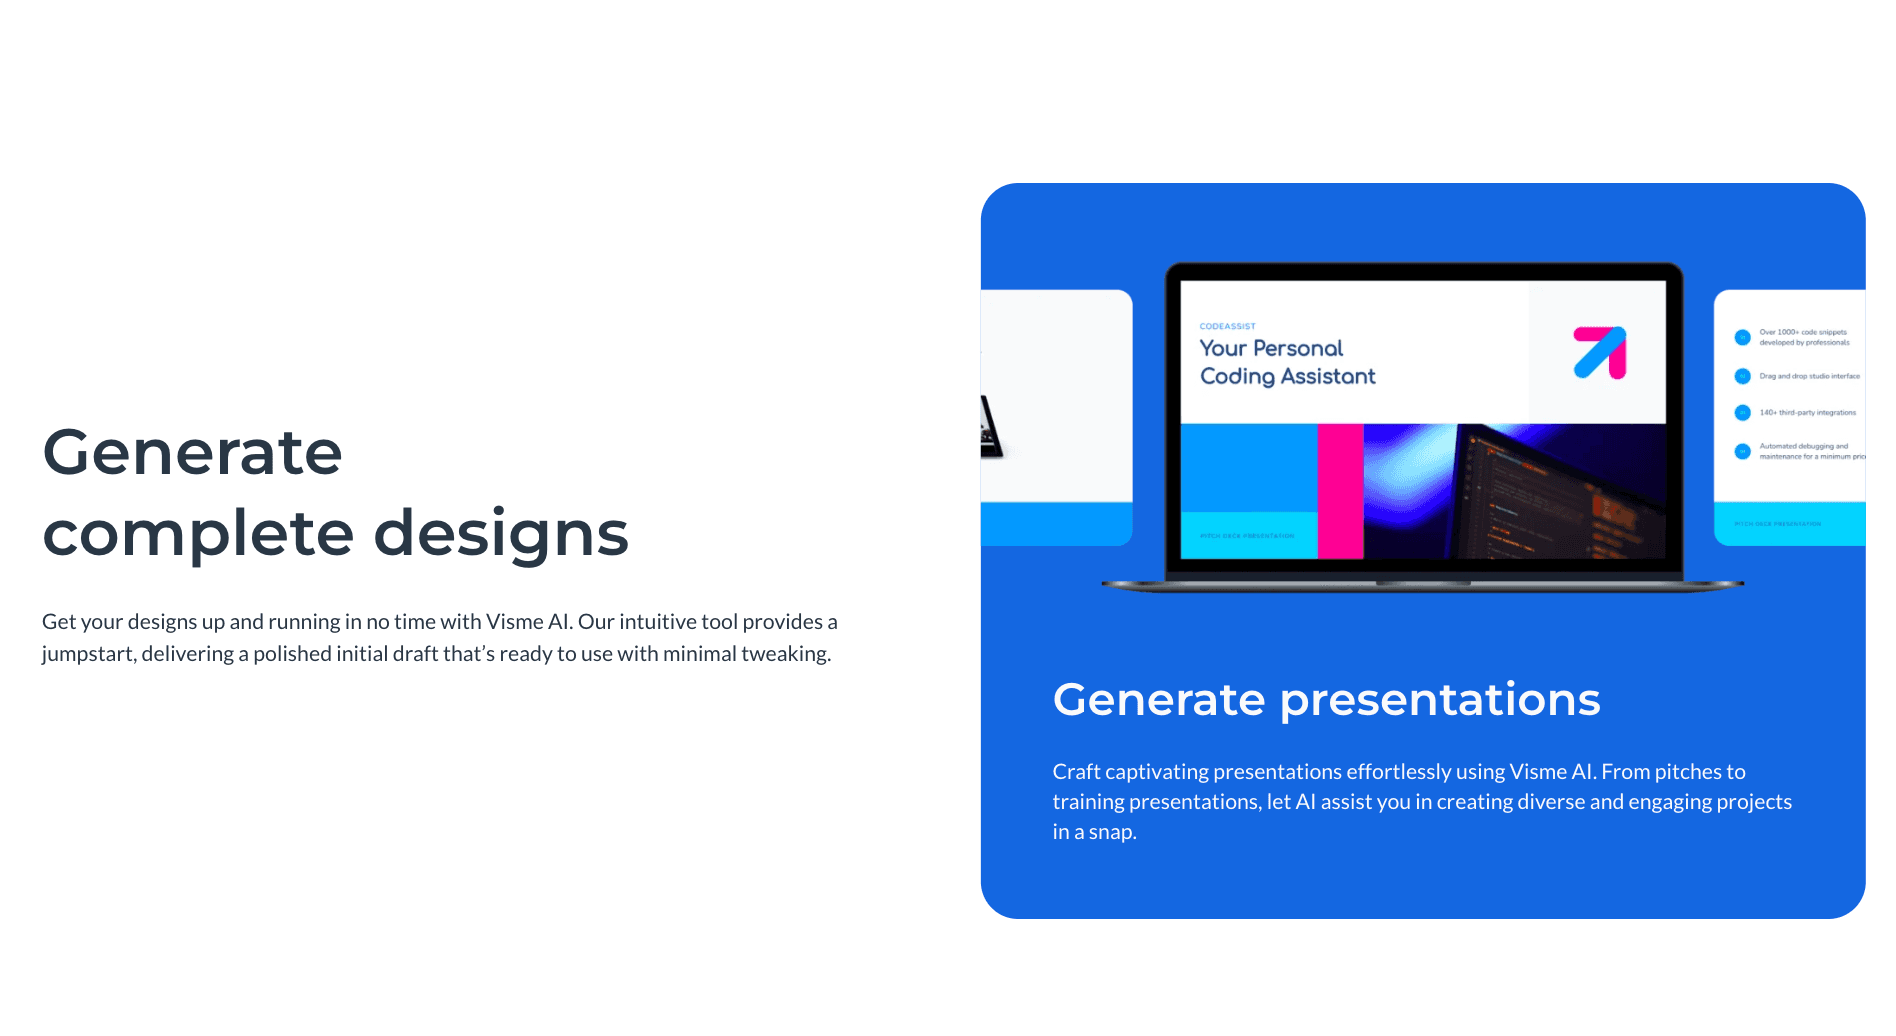
Key Features:
Animation and interactive components; brand asset management; extensive third-party integrations.
Pros:
Rich motion effects for charts; strong team collaboration features.
Cons:
Editor can be slow to load; steeper learning curve compared to others.
Pricing:
Limited free version; business plans are higher priced.
4. Canva
The world's largest online design platform, with AI focused on asset generation and layout optimization.
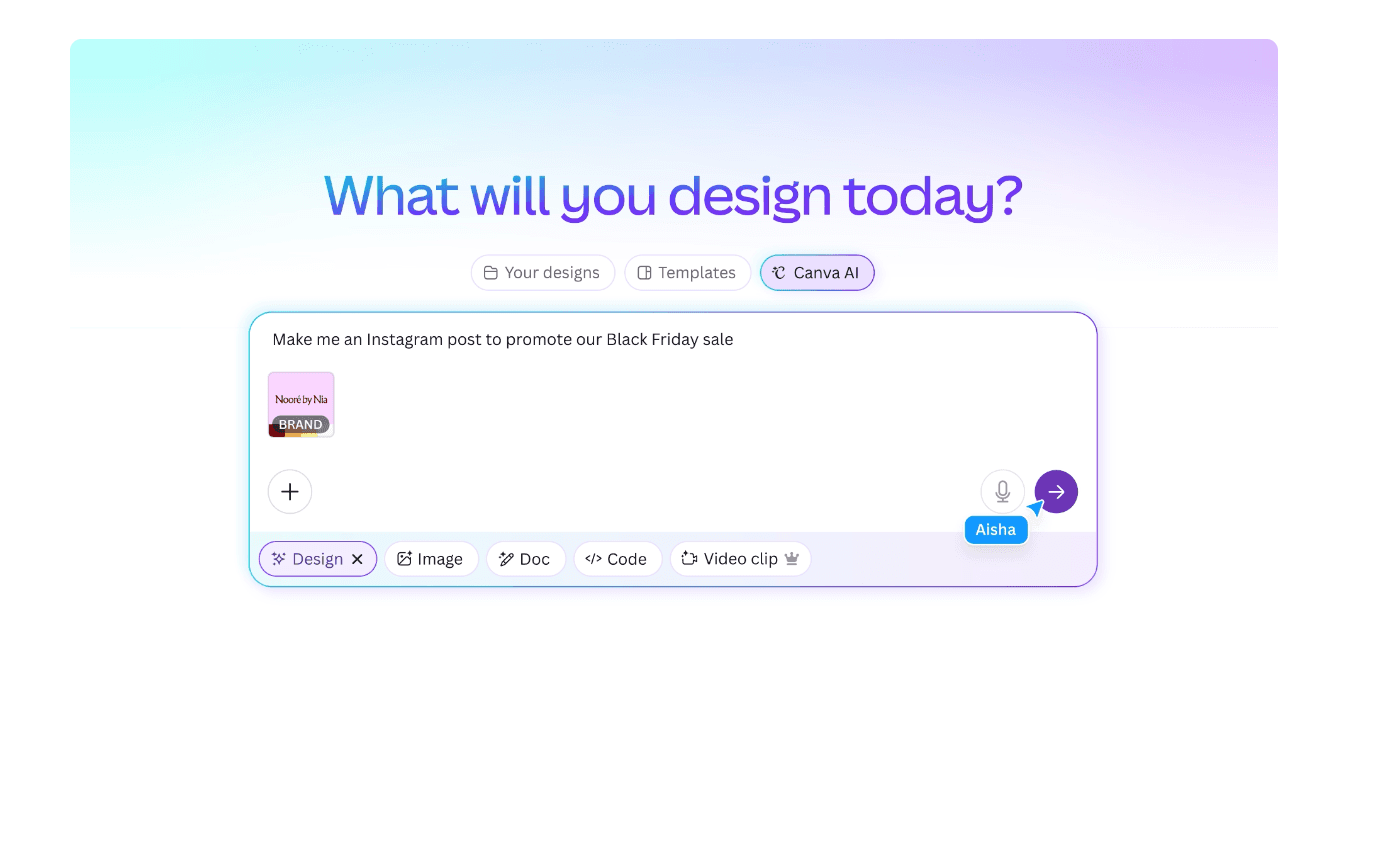
Key Features:
Magic Switch (instant resizing); massive stock library; simple drag-and-drop operation.
Pros:
Extremely easy to use; massive ecosystem; great for quick social media posts.
Cons:
Charting functions are basic; lacks deep data analysis capabilities.
Pricing:
Robust free version; high-value Pro plan.
5. Venngage
A chart tool designed specifically for business communication, emphasizing B2B professionalism.
Key Features:
Smart Diagrams; automated brand kit application; enterprise-grade security and collaboration.
Pros:
Templates are highly suitable for corporate reports and whitepapers; detailed categorization.
Cons:
Free version is very restrictive; AI generation lags slightly behind competitors.
Pricing:
Free version for trial only; push towards paid subscriptions.
6. Infogram
The top choice for media and news industries, focusing on precise data visualization.
Key Features:
Real-time data connection (Google Sheets, etc.); responsive chart design; map visualizations.
Pros:
Extremely rich chart types (35+); excellent for geographical data.
Cons:
Low design freedom; focuses on the chart itself rather than the overall design.
Pricing:
Basic version is free; advanced interactive features are paid.
7. Beautiful.ai
An intelligent presentation tool that automatically adjusts layout via a rules engine.
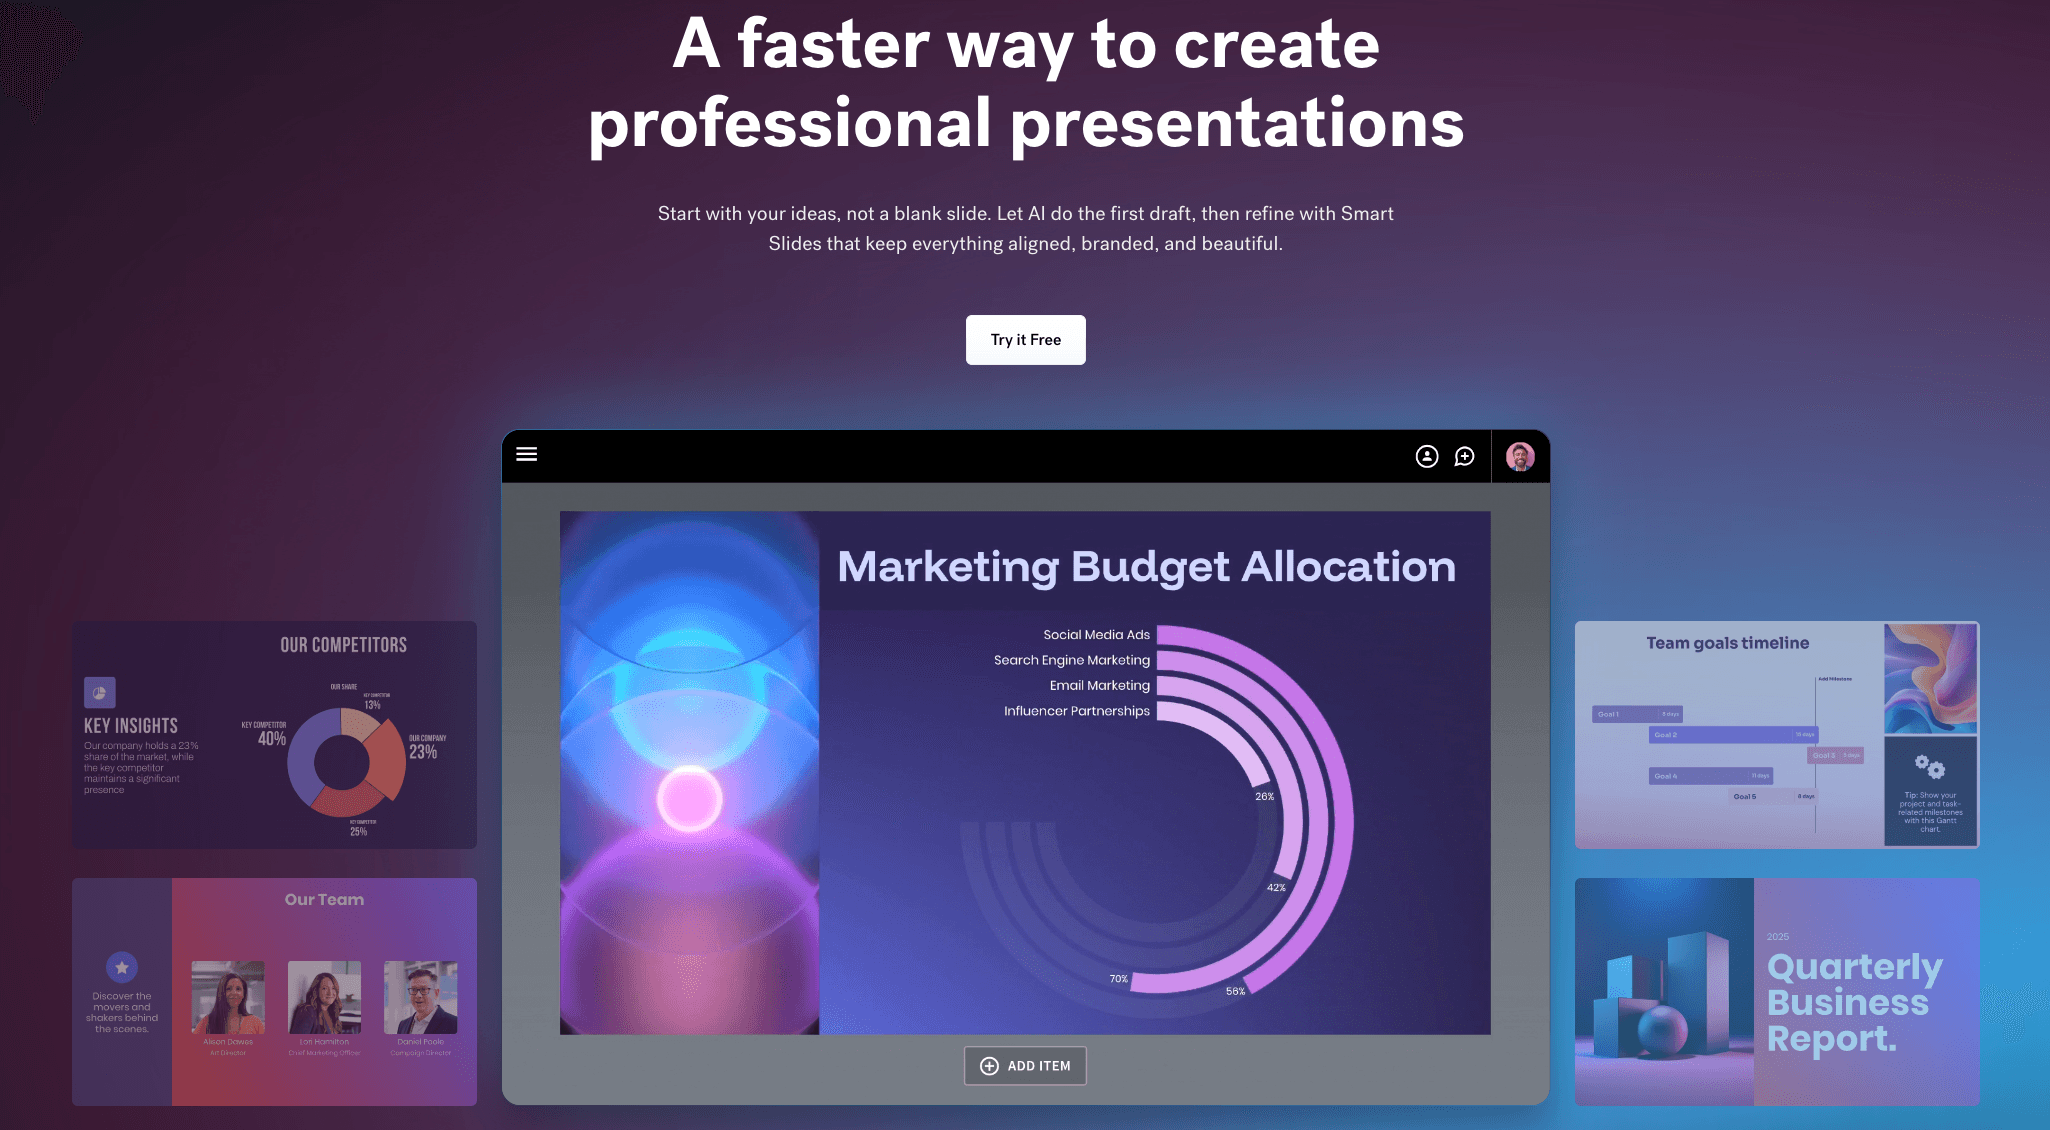
Key Features:
Smart slide templates; auto-adjusting content layout; DesignerBot (text-to-slide).
Pros:
Layouts remain beautiful no matter how you edit content; saves immense formatting time.
Cons:
Limited export formats; geared more towards PPTs than standalone infographics.
Pricing:
Paid subscription required after trial.
8. Snappa
A minimalist design tool built for non-designers who need graphics fast.
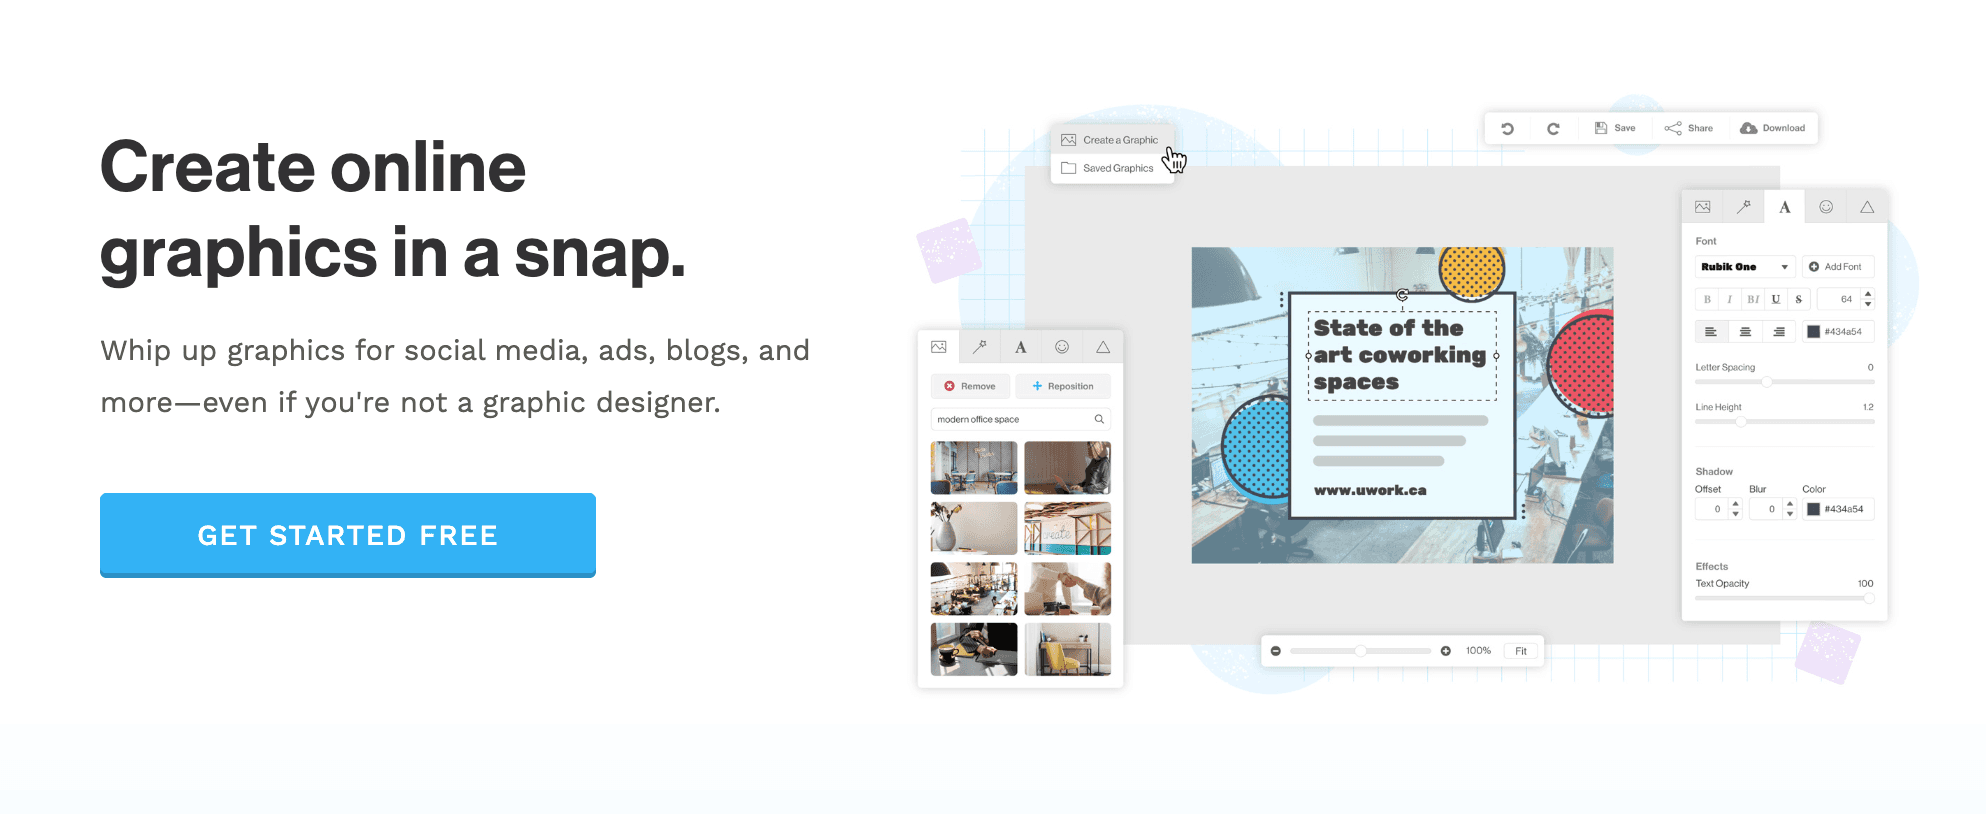
Key Features:
Pre-sized social media templates; royalty-free HD stock photos; one-click background remover.
Pros:
Lightning fast; near-zero learning curve; uncluttered interface.
Cons:
Too simple for complex tasks; lacks AI data processing.
Pricing:
Generous free version; affordable Pro plan.
9. DesignCap
An online poster and flyer maker offering basic infographic capabilities.
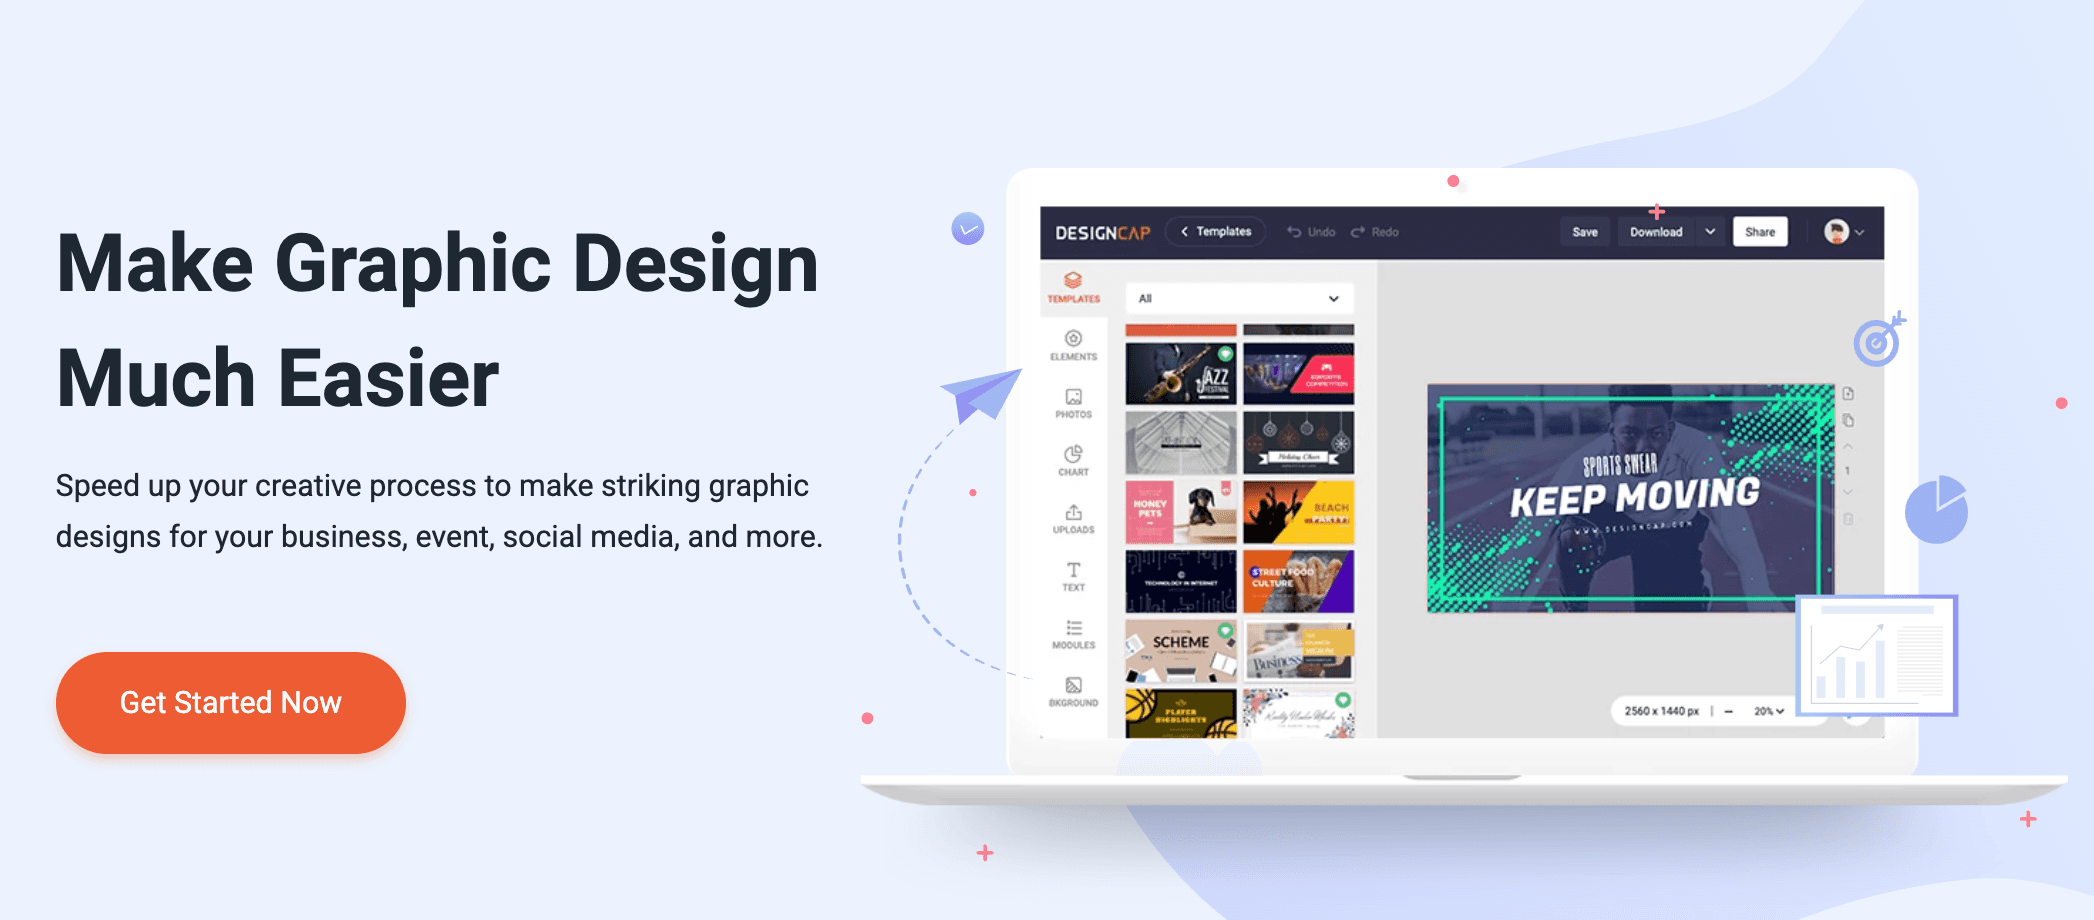
Key Features:
Clearly categorized marketing templates; chart editing modules; localized element support.
Pros:
Smooth operation; suitable for offline print materials.
Cons:
Low AI intelligence; relies heavily on template application.
Pricing:
Freemium model.
10. Adobe Express
Adobe's lightweight design tool integrating Firefly generative AI technology.
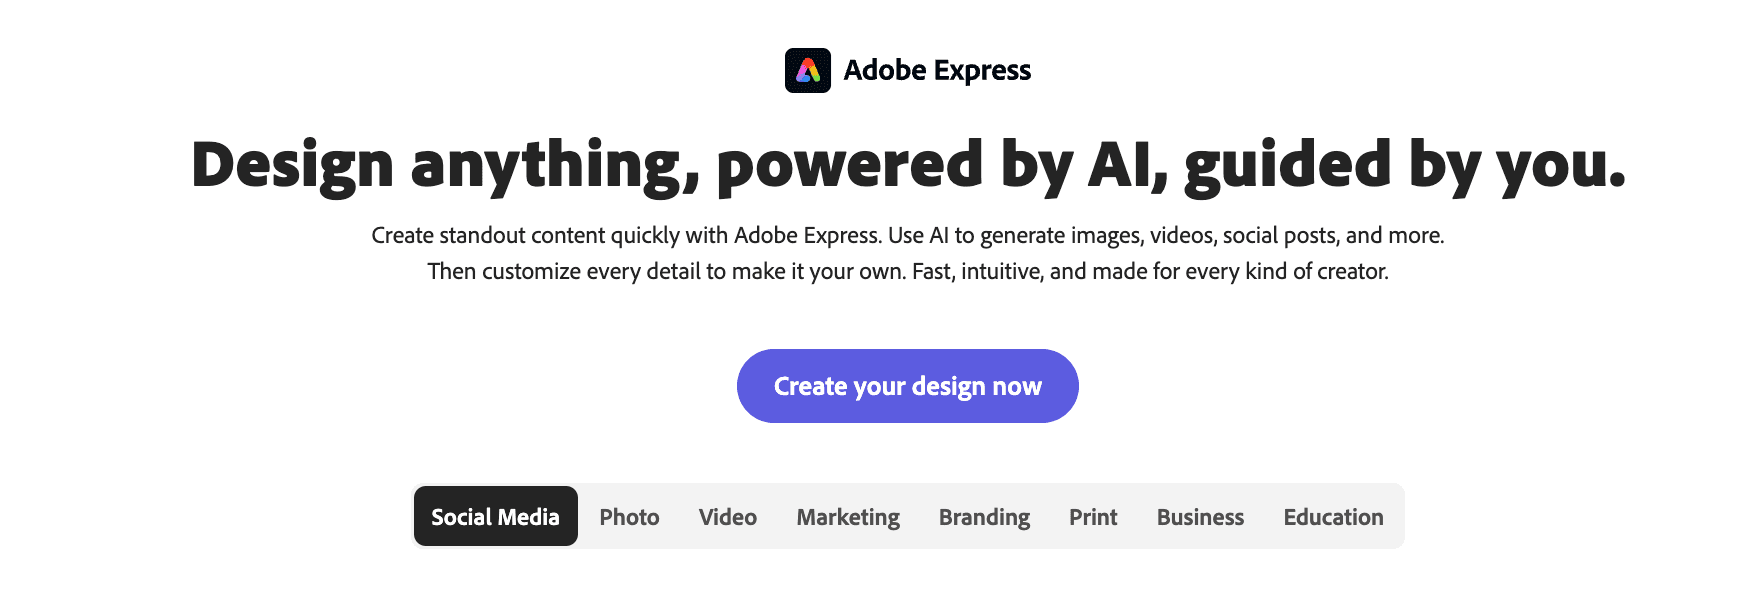
Key Features:
Text-to-image/effect generation; integration with Photoshop/Illustrator; video editing.
Pros:
High-quality AI image generation backed by Adobe tech; cloud syncing.
Cons:
Less specialized in pure data visualization compared to Powerdrill or Infogram.
Pricing:
Basic features free; advanced features included in Creative Cloud.
Buying Guide: Which Tool Should You Choose?
Social Media Managers: If you need simple quote posters for Instagram, Canva or Snappa are your best bets due to their trendy templates.
Web Developers: For highly interactive charts embedded in websites, Visme is the top contender.
Business Leaders & Analysts: However, if you are a business user holding Excel/CSV data and want to use natural language to "instantly generate persuasive business infographics and slides," Powerdrill Bloom is the absolute winner in 2026. It solves the core pain point: bridging the gap between data analysis and graphic design.
How Powerdrill Bloom Accelerates Infographic Generation
Powerdrill Bloom is not just a drawing tool; it is a closed-loop intelligent workflow:
Data Ingestion: Upload complex Excel or PDF reports.
AI Cleaning & Insights: The system understands data structure, cleans messy data, and predicts business metrics you care about (e.g., "Q3 Sales Growth").
Nano Banana Pro Engine: This is the secret weapon. It recommends the best chart type and automatically matches the design style based on the data's sentiment, generating Data Preview Images and professional Slides in real-time.
Export & Share: Deliver not just images, but complete narratives ready for presentation.
Frequently asked questions
What are AI Tools for Generating Infographics?
These are tools that leverage artificial intelligence to analyze text or data and automatically arrange them into visual charts, diagrams, or complete infographics, reducing design barriers and improving communication efficiency.
Which AI tool best converts raw Excel data into visual infographics?
Powerdrill Bloom is currently the best choice. It directly reads Excel/CSV files, understands data logic, and uses the Nano Banana Pro engine to generate professional charts without manual data entry.
How do AI Infographic tools help data analytics teams?
They enable analysts with no design skills to produce high-quality visual reports. By automating layout and color schemes, teams can focus more on "extracting value from data" rather than formatting slides.
Conclusion
2026 is the year of "Visual Storytelling." No matter how accurate your data is, its value diminishes if it cannot be "seen" and "understood." Among the 10 tools reviewed, Powerdrill Bloom, with its Nano Banana Pro engine, redefines the standard from data to story. Choose it to conquer your audience with data in every presentation.