Self-Supervised Learning for Time Series: A Review & Critique of FITS
Andreas Løvendahl Eefsen, Nicholas Erup Larsen, Oliver Glozmann Bork Hansen, Thor Højhus Avenstrup·October 23, 2024
Summary
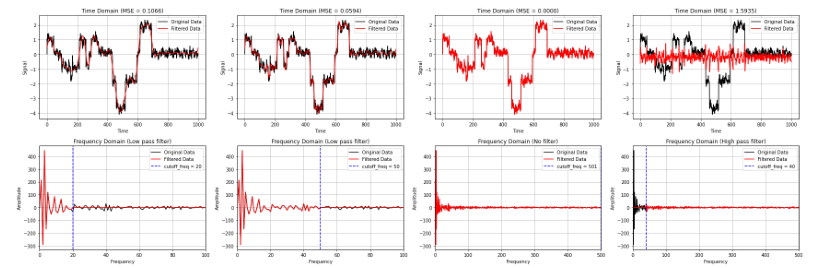
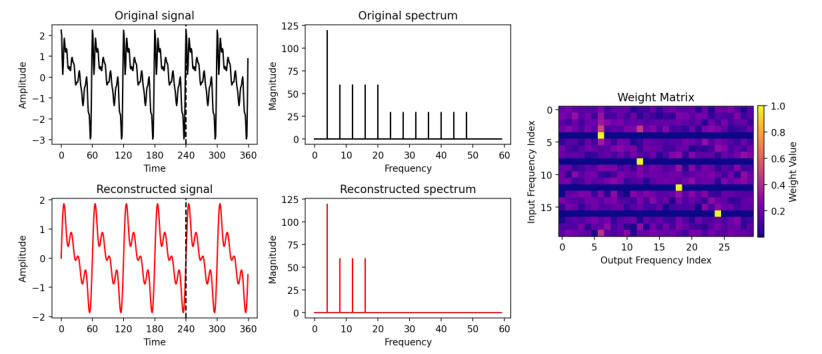
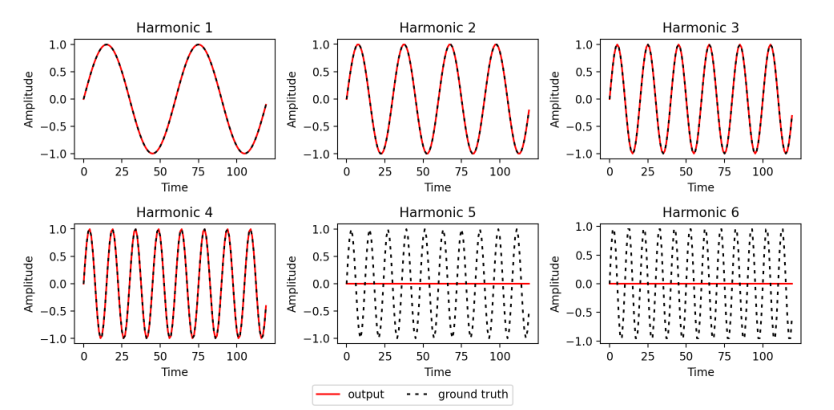
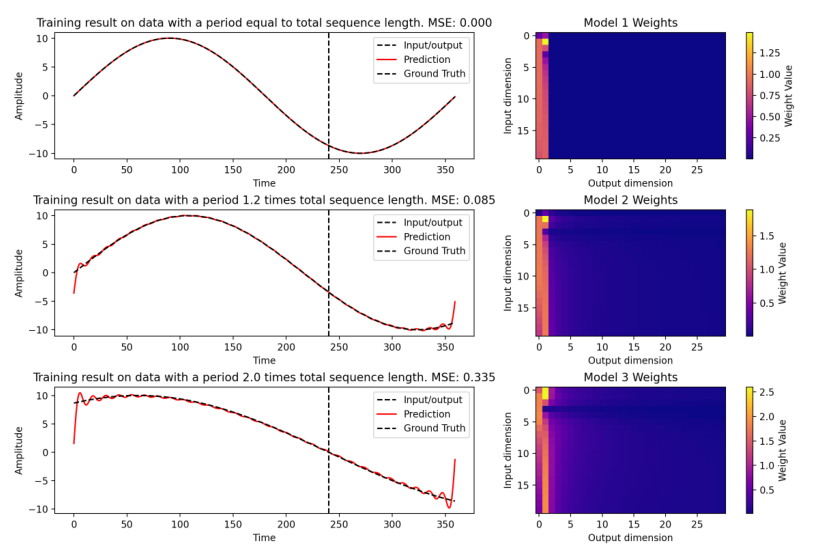
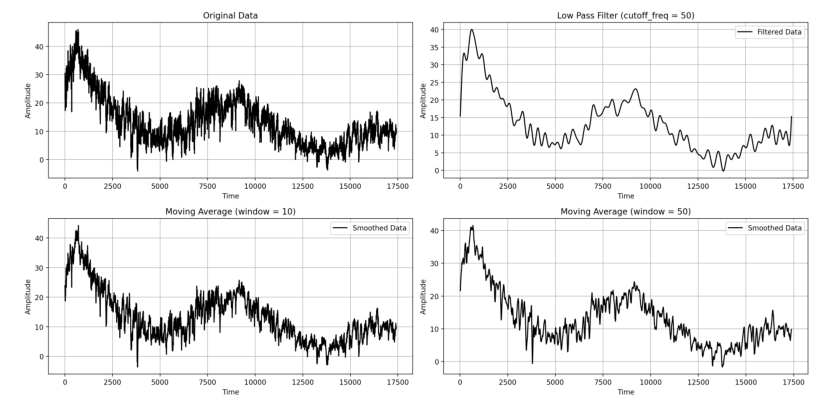
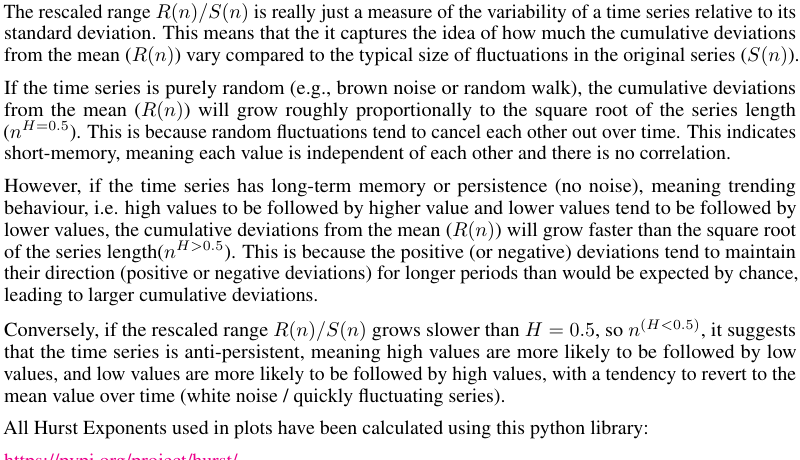
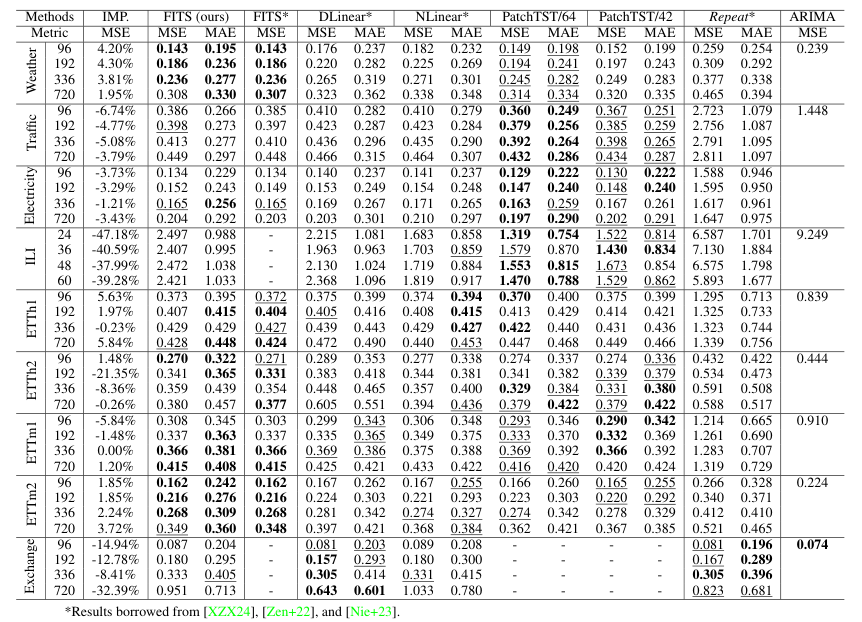
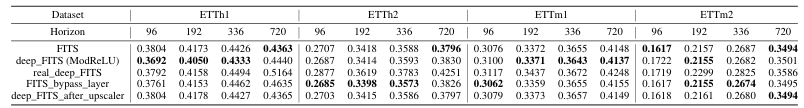
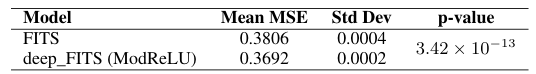
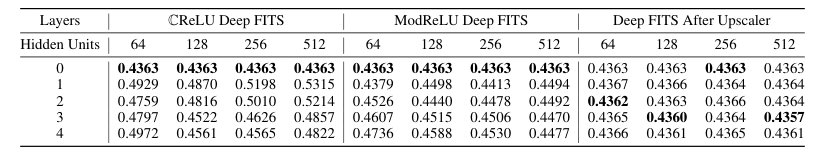
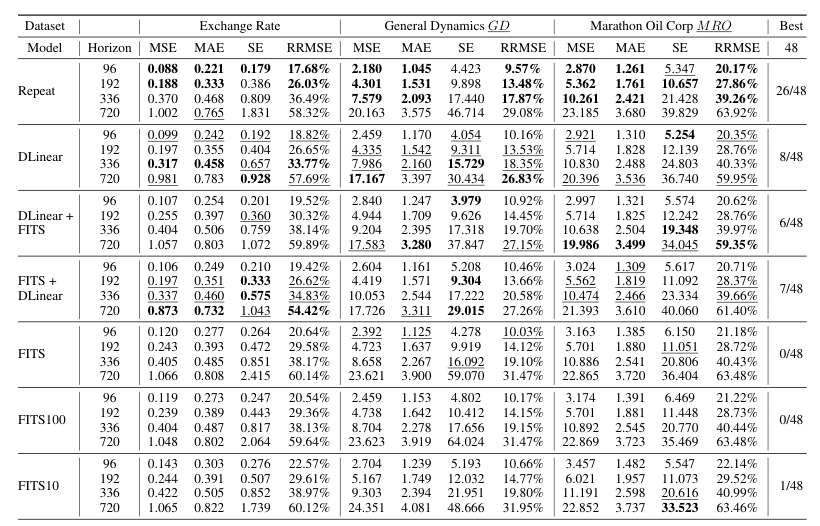
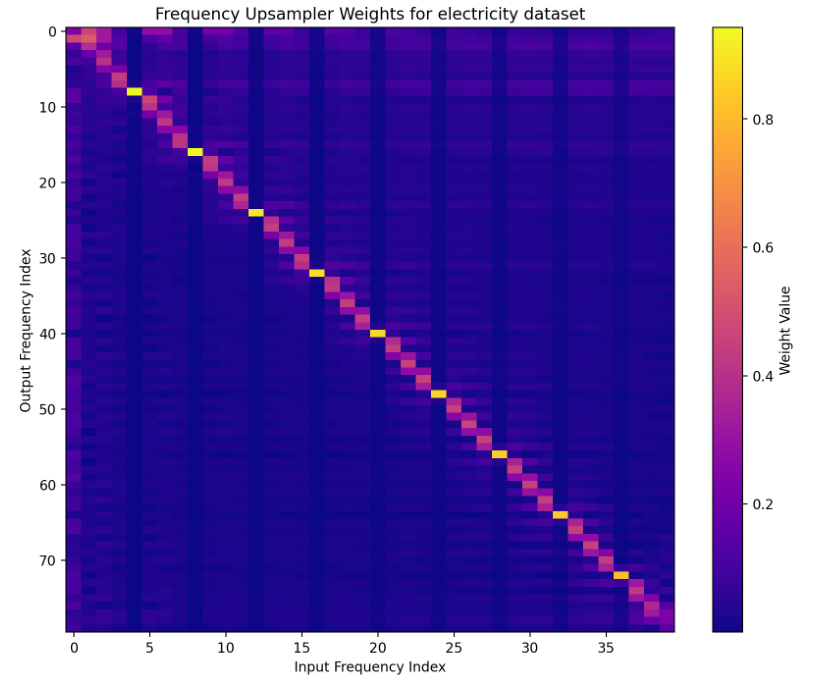
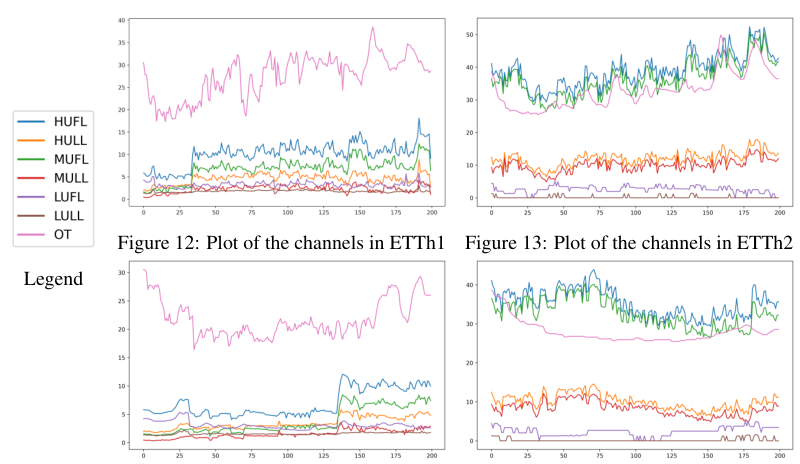
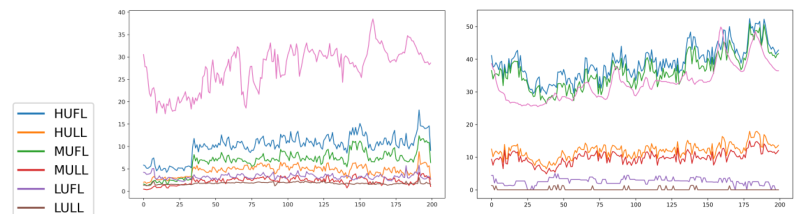
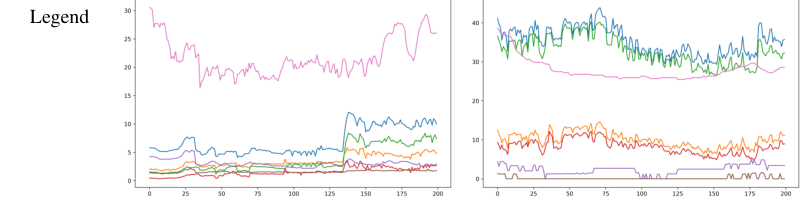
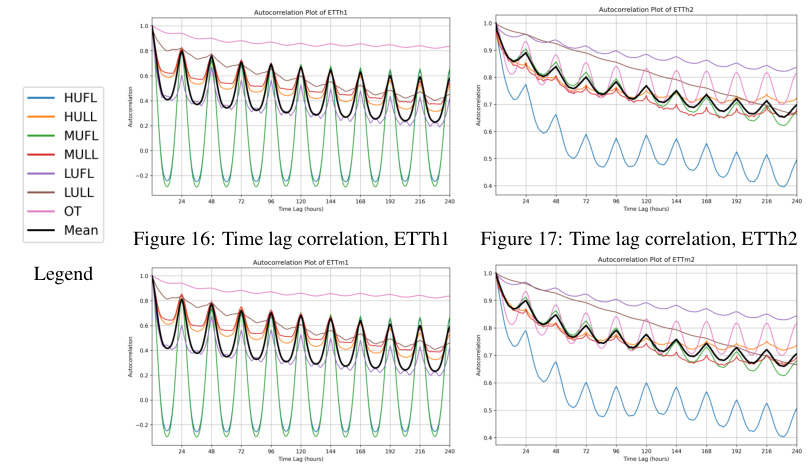
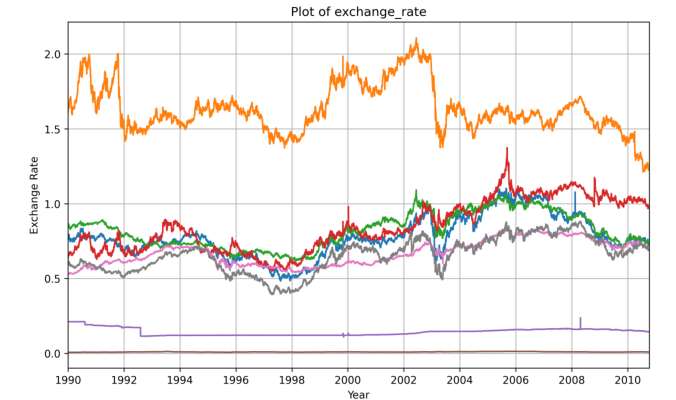
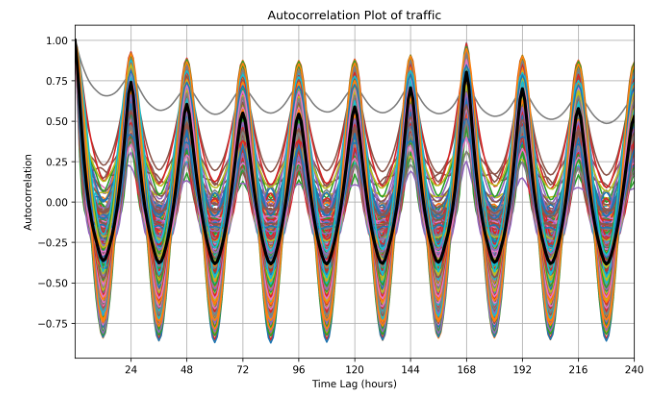
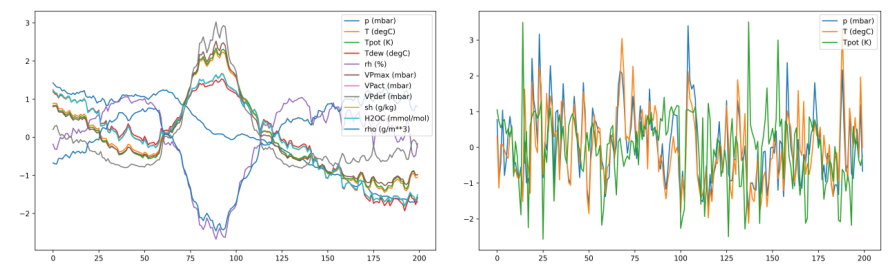
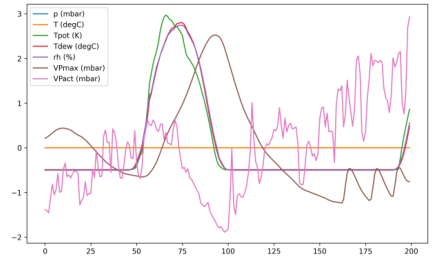
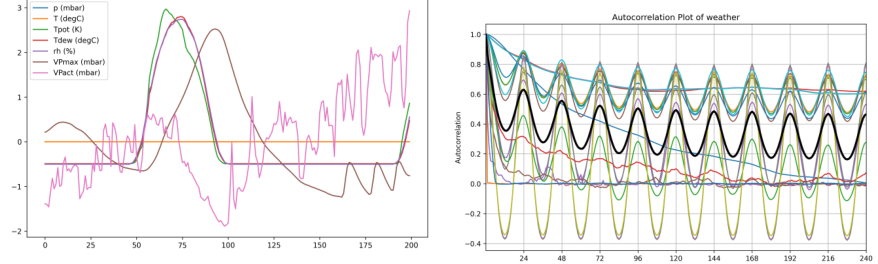
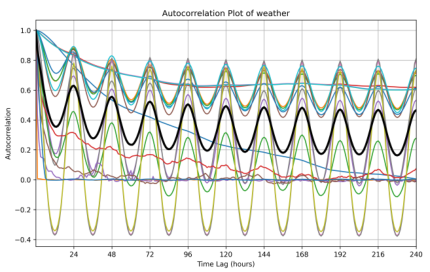
FITS, a model with reduced parameters, performs competitively in time series forecasting, especially excelling at capturing periodic patterns. However, it struggles with trending, non-periodic, or random data. Hybrid approaches combining FITS with DLinear improve results in multivariate and price datasets, surpassing FITS' standalone performance. The project's code is available on GitHub. The text discusses improvements to the FITS model for time series forecasting, including deep variants with multiple linear layers, ReLU-like activations, and dropout. FITS is compared to DLinear, which decomposes input into trend and seasonal components for separate linear modeling. The text explores the impact of randomness in datasets on model performance, suggesting that for random data, simple models may outperform complex ones. It introduces the Hurst exponent as a measure of data unpredictability. The text discusses various neural network models and activation functions, including ModReLU and CReLU, which are introduced to adapt FITS for complex numbers. The text outlines a baseline model for benchmarking more complex forecasting models, using the mean of observed time series values as a simple forecast. The text presents results from various models and baselines on different datasets, focusing on multivariate input and output. The text presents MSE results for CReLU Deep FITS, ModReLU Deep FITS, and Deep FITS after upscaler on ETTh1 dataset. The text presents a comparison of different models using metrics like MSE, MAE, SE, and RRMSE across various horizons with a set lookback-window of 336. The text discusses issues with dataset documentation, affecting assumptions about future behavior. The text discusses ETT and price datasets, including ETTh1, ETTh2, ETTm1, and ETTm2, which are visualized in figures 12-15. The text discusses weather dataset visualizations, including time plots with a 10-minute interval on the X-axis, and time lag correlations among dataset channels, showing high correlation and periodicity, especially between water content and dew point channels.


Advanced features