

Understanding where U.S. tariff revenue is headed requires more than headline numbers. It demands disciplined data synthesis, probabilistic thinking, and a clear separation between political rhetoric and fiscal reality.
In my own forecasting workflow, tools like Powerdrill Bloom help structure that complexity — but the conclusions below stand on the underlying evidence itself.
As of January 2026, one thing is already clear: the United States has entered a structurally different tariff regime. What remains uncertain is not whether revenues will stay elevated, but how much erosion policy, courts, and behavior will impose over time.
1. Core Forecast and Central Revenue Outlook
Based on realized collections, effective rate data, and forward-looking institutional models, my central view is straightforward:
U.S. tariff revenues are likely to remain historically elevated through at least 2027, but will fall meaningfully short of the most aggressive early projections, with clear downside risk over the next decade.
Near-Term Outlook (2025–2026)
2025 net customs duties are on track to land in the $170–$210 billion range, more than double the pre-2025 norm of roughly $80–90 billion annually.
2026 receipts are likely to be flat to modestly higher in nominal terms (approximately $180–$230 billion), assuming current tariffs remain in force.
The key reason growth stalls is not arithmetic. It’s friction:
Import substitution and demand destruction
Expanding exemptions and carve-outs
Rising non-compliance and valuation strategies
Higher statutory rates are increasingly offset by a shrinking effective base.
Medium-Term Outlook (10-Year Horizon)
Across credible external scorekeepers — Yale Budget Lab, Penn Wharton, CBO, and the Tax Foundation — dynamic 10-year revenue estimates cluster between $2.0 and $3.0 trillion, consistently 15–25% below static projections.
My central estimate sits in the lower half of that range: ~$2.0–$2.4 trillion in realized tariff revenue over 10 years (nominal)
This assumes:
No full rollback, but partial trimming after 2026
Legal constraints on the broadest emergency-based tariffs
Gradual erosion through trade diversion and compliance leakage
2. Probability-Weighted Revenue Scenarios
Rather than treating tariff revenue as a point forecast, I frame it as a distribution shaped by policy durability and behavioral response.
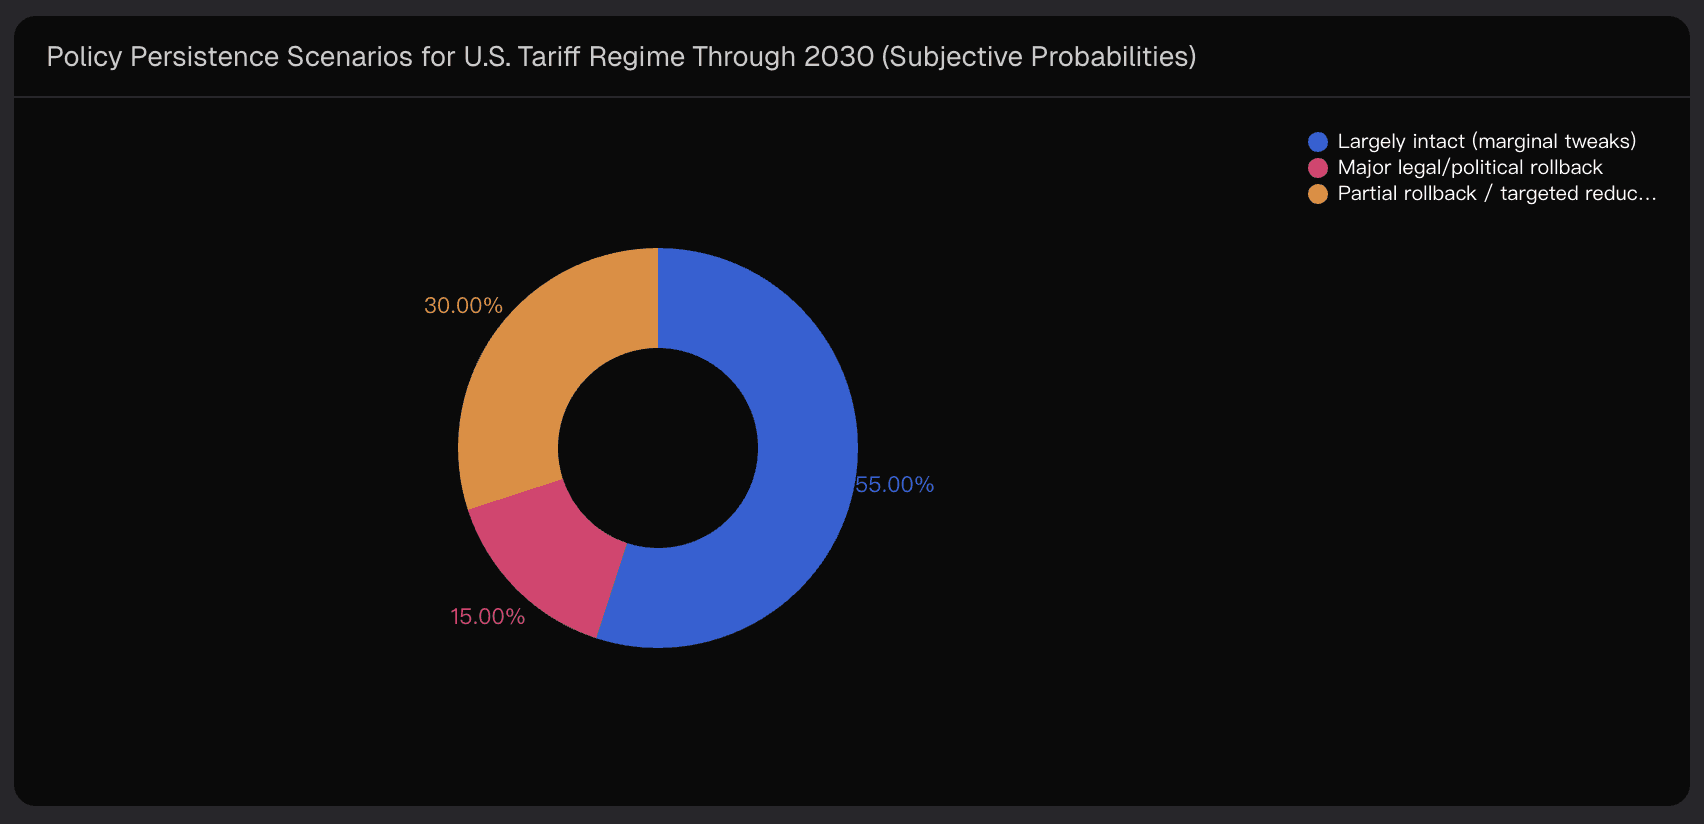
Policy Persistence Scenarios (Subjective Probabilities)
Tariff regime largely intact through 2030: ~55%
Partial rollback or targeted reductions: ~30%
Major legal or political rollback: ~15%
Revenue Outcomes Conditional on Policy
If tariffs largely persist: probability that 10-year dynamic revenue exceeds $2.3T: ~75%
If partially rolled back: probability exceeds $2.3T: ~40%
If broadly invalidated: probability exceeds $2.3T: <10%
When these branches are combined, the result is a ~62% probability that cumulative 10-year tariff revenue exceeds $2.3 trillion, and only a 25–30% chance that it pushes meaningfully beyond $2.7 trillion.
3. Supporting Evidence Driving the Forecast
3.1 Actual Collections Signal a Regime Shift
By mid-2025, realized collections had already surged:
Monthly customs revenues roughly tripled versus the pre-2025 baseline
Total 2025 collections reached levels consistent with mid-hundreds of billions annualized
Fiscal-year data aligns closely with academic and Treasury estimates
This is not noise. It reflects a genuine structural break.
3.2 Effective Tariff Rates Tell the Real Story
While statutory rates climbed into the high-teens, effective rates settled closer to 10–12%, revealing early erosion:
Carve-outs for politically sensitive sectors
Front-loading ahead of hikes
Measurable non-compliance (often estimated at 10–15%)
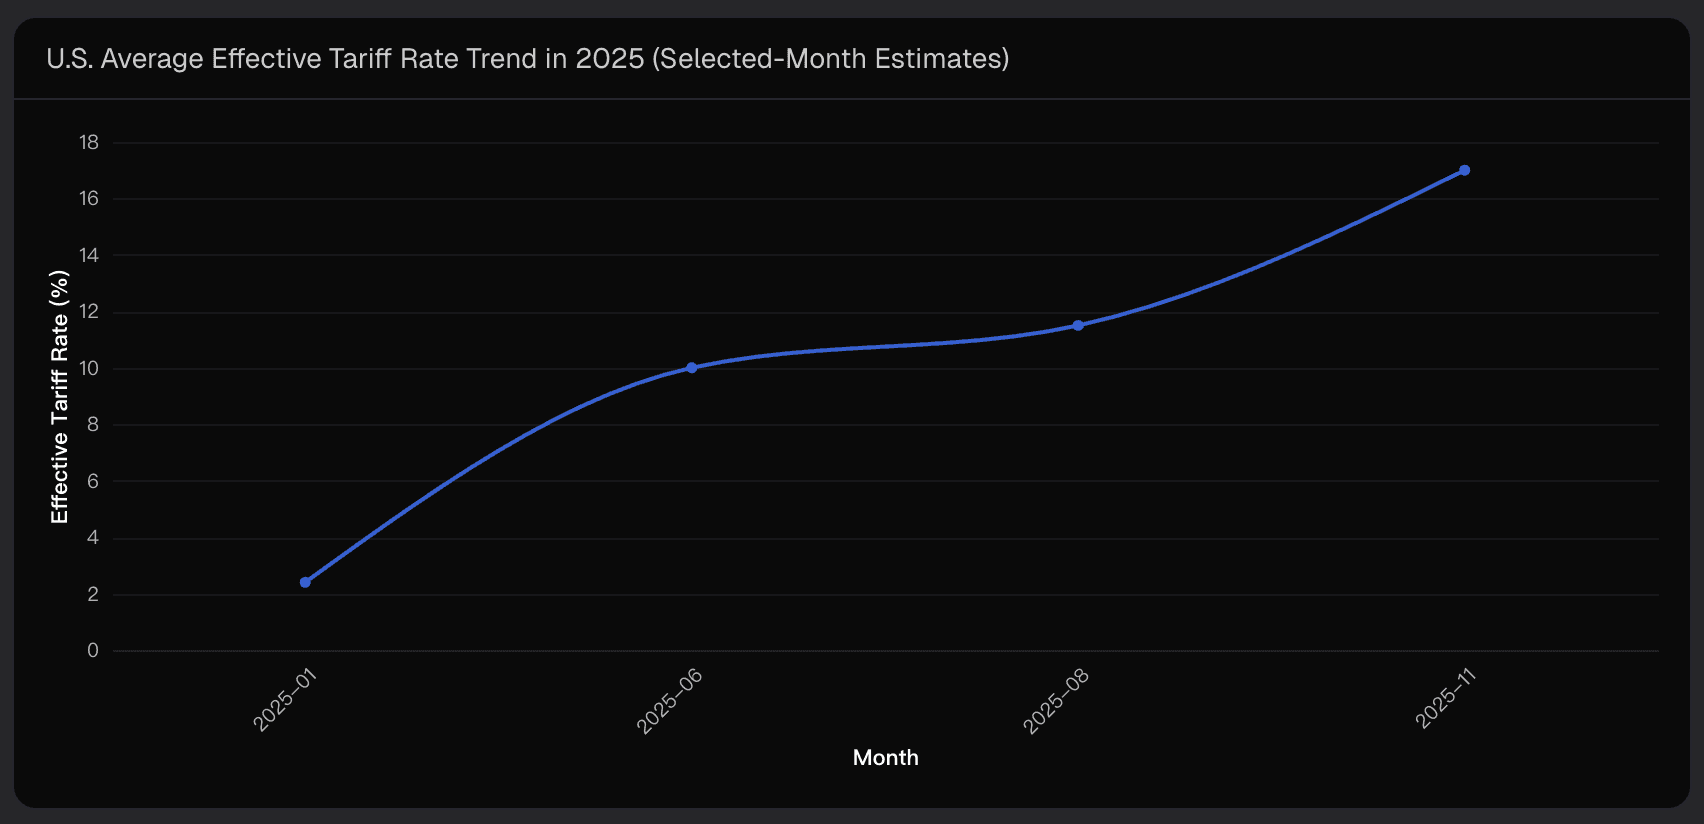
Even so, moving from a 2–3% effective rate to double digits is sufficient to keep revenues structurally elevated — even with substantial leakage.
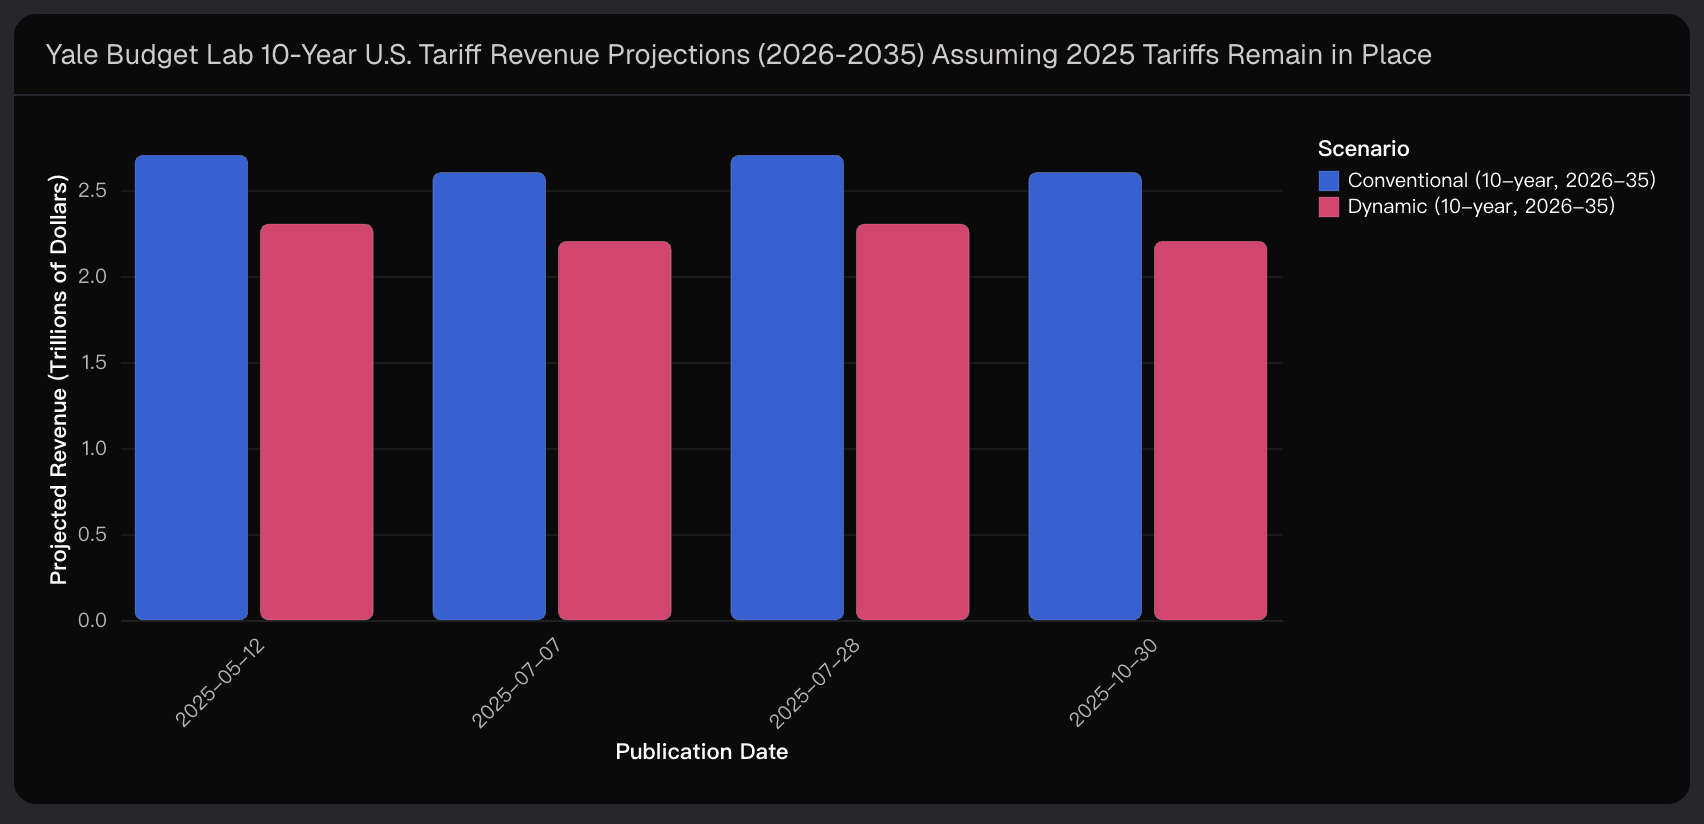
3.3 Forward Scores Are Remarkably Stable
Despite multiple updates throughout 2025, long-range projections converged:
Static 10-year revenue: ~$2.6–$2.7T
Dynamic 10-year revenue: ~$2.2–$2.3T
The consistency across updates tells us something important: the main uncertainty is no longer the size of the tariff base — it’s the durability of the regime.
4. Key Uncertainties and Downside Risk Factors
Legal Risk Is the Largest Downside Tail
A significant portion of current tariffs relies on emergency authority. If courts permanently constrain that power:
Annual revenue could drop dramatically
10-year revenue losses could exceed $1 trillion
This binary legal risk is often underweighted in casual forecasts.
Behavioral Erosion Will Likely Worsen, Not Improve
Over time, firms adapt:
Production re-routing through lower-tariff jurisdictions
Classification and valuation optimization
Lobbying-driven exemptions
History suggests collection efficiency deteriorates as regimes mature.
Macro Conditions Matter More Than Headlines
Tariffs do not operate in isolation. Revenue outcomes are jointly determined by:
Global growth
Exchange rates
Domestic demand
A mild “stagflation-lite” environment would pressure both political support and the import base itself.
5. Key Indicators to Monitor Going Forward
For professionals, the edge is not in repeating headline totals. It lies in monitoring two live indicators:
Legal durability of the emergency tariff framework
The gap between statutory and effective rates
If that gap continues to widen — as early data suggests — realized revenue will track toward the lower bound of current dynamic estimates, even without dramatic policy reversals.
That is why my forecast remains firm but restrained: high revenues, capped by erosion.
Final Takeaway
U.S. tariff revenues have already entered historic territory, and they are likely to stay there for several years. But when behavioral response, legal limits, retaliation, and macro drag are properly accounted for, the most realistic outcome over the next decade is material but bounded revenue — not the outsized figures often cited in political narratives.
Used correctly, analytical frameworks — and platforms like Powerdrill Bloom — help cut through that noise and focus attention where it actually belongs: on durability, incentives, and real-world adaptation.
Disclaimer: This article is for informational and analytical purposes only and does not constitute financial, legal, or policy advice.
Related Post

Jan 14, 2026
/
Post by

Jan 9, 2026
/
Post by
Molly

Dec 26, 2025
/
Post by
fox