

As I review the macro data heading into early 2026, one question keeps resurfacing: how strong was U.S. economic growth in the final quarter of 2025, really?
Between sharply diverging model-based nowcasts, conservative institutional forecasts, and an increasingly visible wave of AI-driven investment, the signal has been anything but clean.
To make sense of this divergence, I synthesized real-time releases, survey expectations, and structural drivers using Powerdrill Bloom, allowing me to evaluate competing signals side by side rather than in isolation.
What emerges is not a single-point forecast, but a probability-weighted view of growth—one that sits meaningfully above trend, yet falls short of the most optimistic narratives.
1. Core Forecast: Above Trend, Not a Boom
Based on the balance of evidence available as of early January 2026, my central estimate for U.S. real GDP growth in Q4 2025 is:
~3.5% SAAR (quarter-on-quarter, annualized)
80% confidence interval: 1.0% – 5.5%
Most likely range: 2.5% – 4.5%
This places late-2025 growth clearly above the economy’s estimated potential (~1.8%–2.0%), but below the most aggressive nowcasts calling for 5%+ growth. In other words, the data suggest a solid, above-trend quarter—stronger than conservative baseline projections, yet not a late-cycle boom.
2. Reconciling Conflicting Signals: A Probabilistic View
Rather than treating forecasts as competing truths, I frame them as inputs into a distribution. When I map the available information into growth buckets, the implied probabilities look roughly like this:
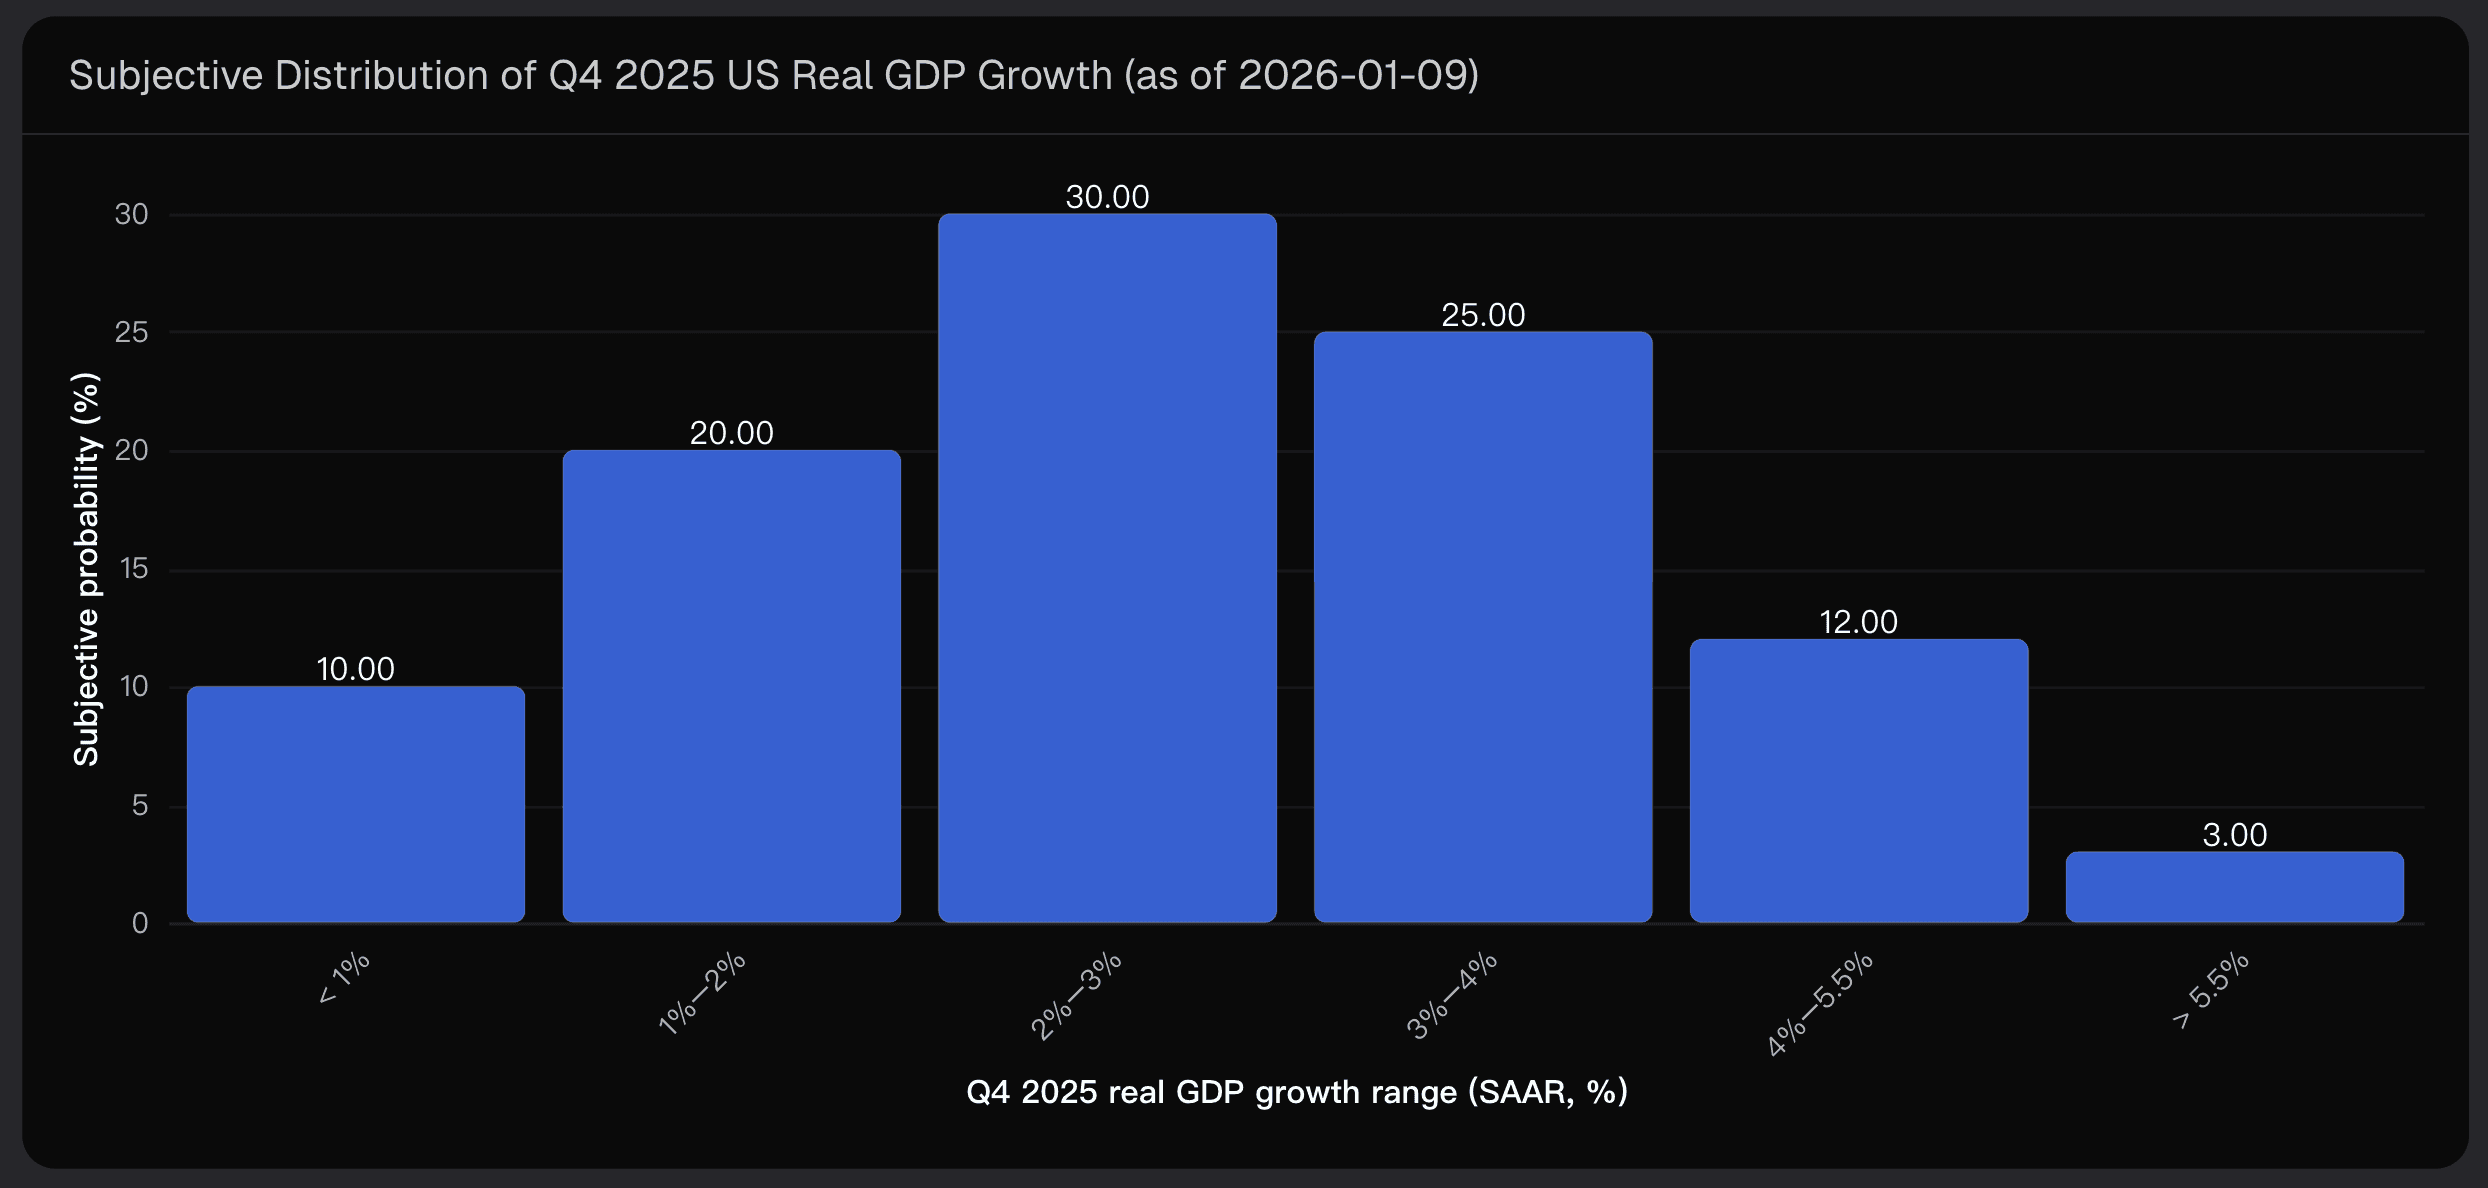
This implies:
~70% probability that growth exceeded 2%
~40% probability it exceeded 3%
~15% probability of 4%+ growth
These probabilities reconcile three very different forces at work:
High-frequency nowcasts tilted strongly upward late in the quarter
Survey and institutional forecasts anchored near modest growth
Structural macro data, particularly AI-related investment and trade, pointing to a temporary upside surprise
3. Visualizing Model Divergence: Range of Q4 2025 Forecasts
To make the divergence across models and institutions explicit, I summarized the key point estimates for Q4 2025 real GDP growth as of early January 2026:
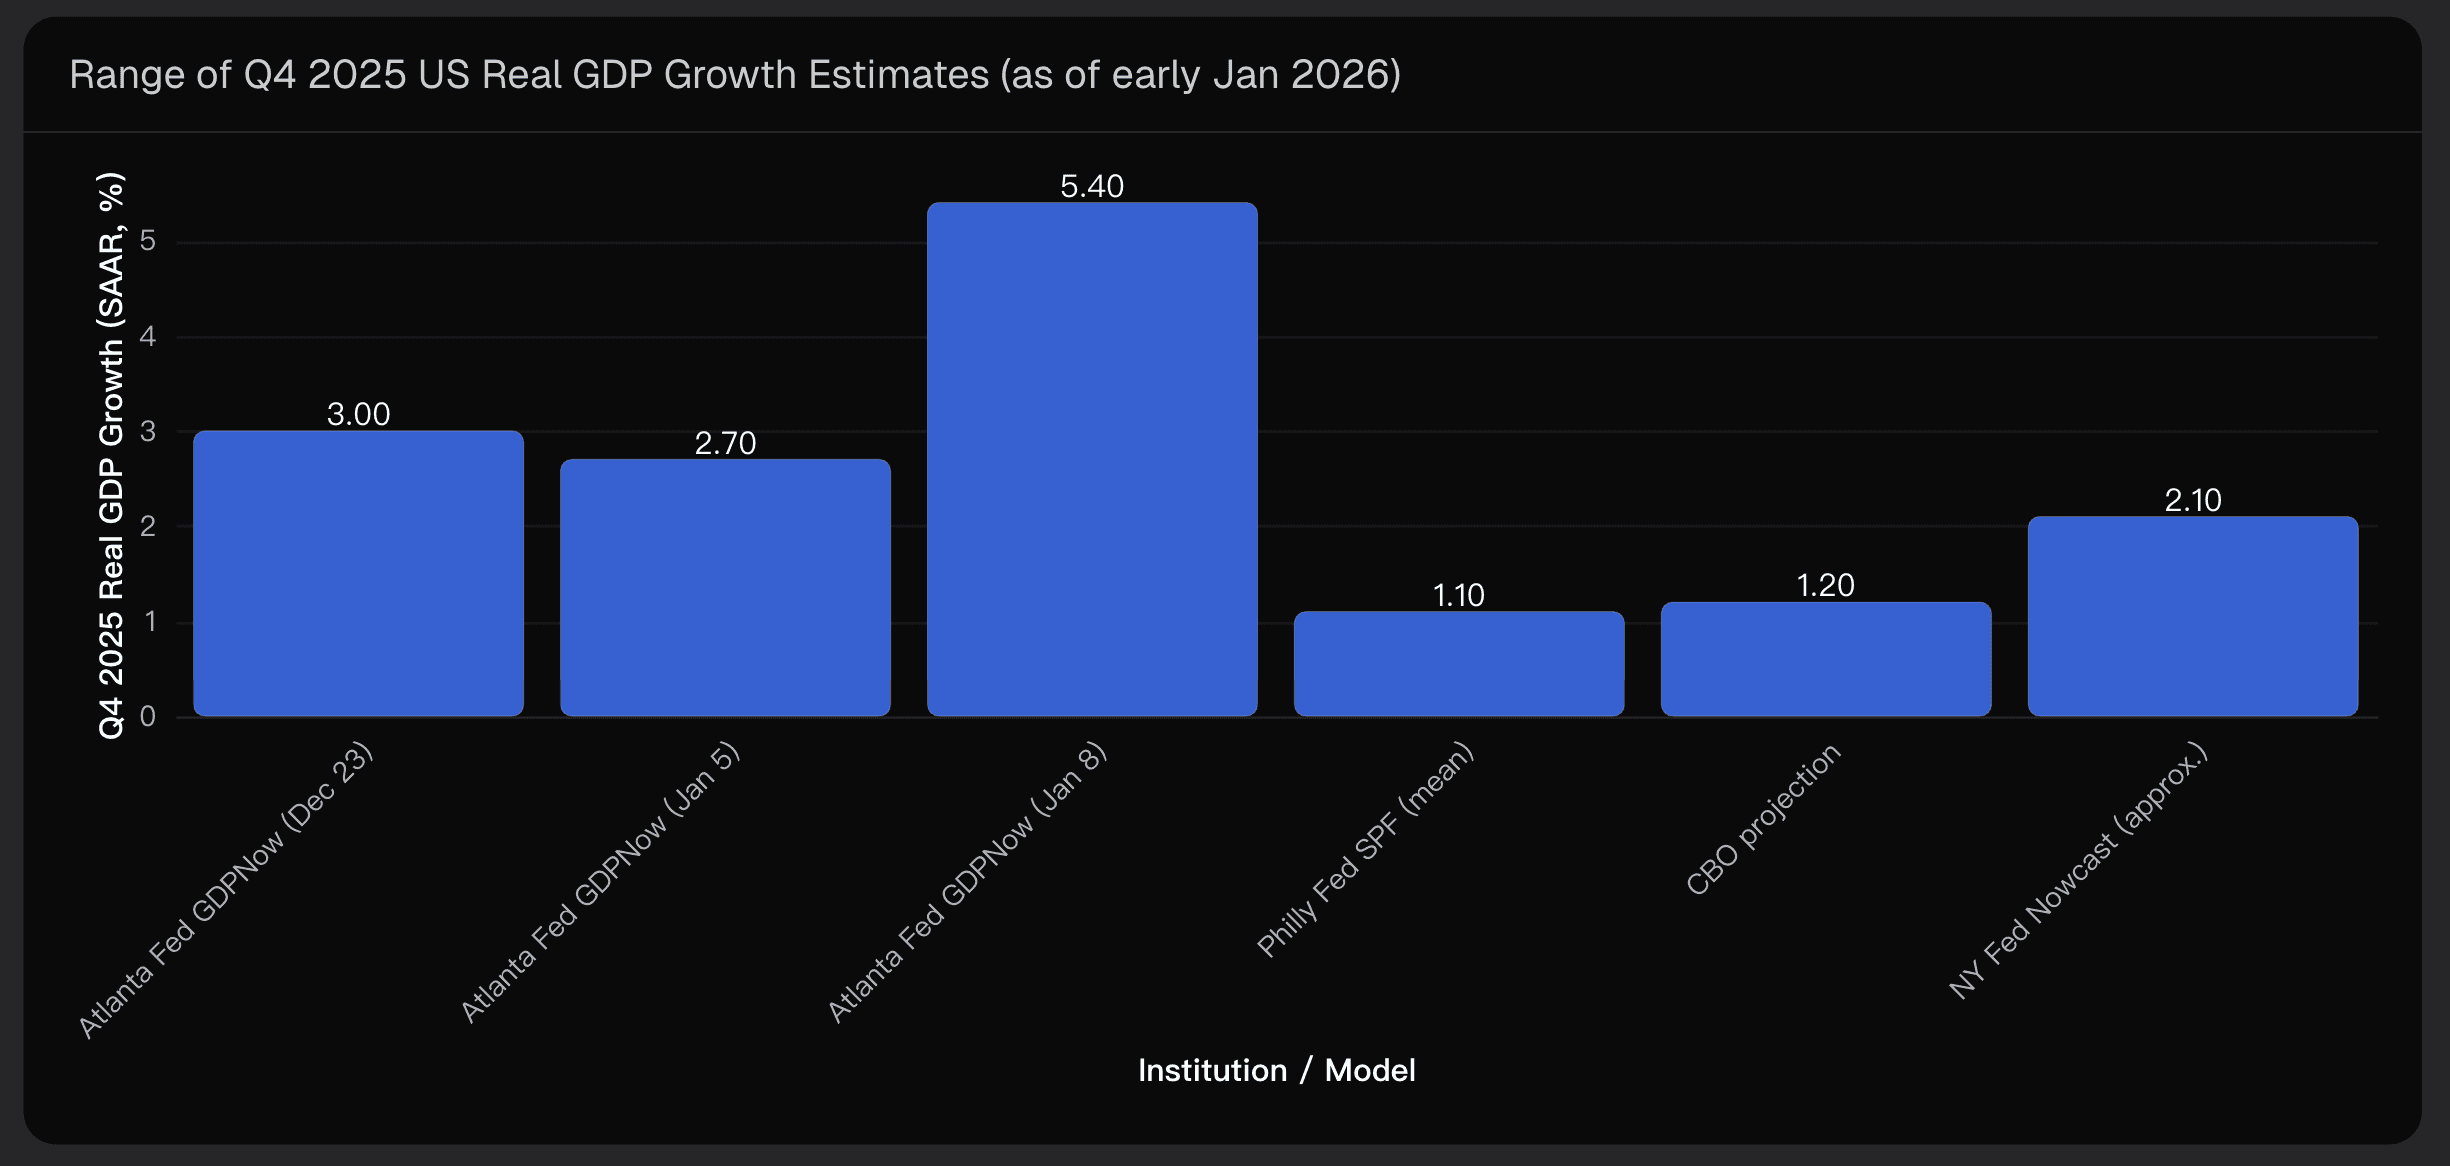
The contrast is striking: GDPNow ranges from roughly 2.7% to 5.4%, while survey-based and institutional forecasts, such as the SPF (1.1%) and CBO (~1.2%), remain firmly anchored near modest growth. Fed-style nowcasts sit between these extremes, around ~2.1%.
This unusually wide spread is precisely what motivates a probabilistic framing rather than a single-number forecast. With credible signals spanning from near-stall conditions to a one-off 5%+ outcome, the distribution naturally centers around ~3.5%, with meaningful mass from ~1% up to ~5.5% SAAR.
4. Drivers Behind the Forecast
4.1 Model-Based Nowcasts: Strong, But Mechanically So
The Atlanta Fed’s GDPNow model jumped from roughly 2.7% to 5.4% SAAR in early January. The revision was driven primarily by:
Net exports swinging from a drag to nearly +2pp contribution
Real personal consumption growth rising from 2.4% to 3.0%
While this establishes a credible upside tail, GDPNow is mechanical, with an average historical error of ~1pp. I therefore treat 5.4% as a plausible upper bound, not the modal outcome.
4.2 Surveys and Institutional Baselines: Conservative Anchors
Philadelphia Fed SPF forecasts Q4 growth near 1.1%, while the CBO projects ~1.2%. These forecasts were finalized before late-quarter trade and consumption strength, suggesting they may understate momentum heading into year-end.
4.3 AI-Driven Investment as a Tailwind
Business investment, particularly in AI-related equipment, software, and intellectual property, surged in late 2025:
Real business fixed investment revisions for Q2 2025 jumped from 1.9% → 7.3% annualized
Deloitte projects 2025 business investment growth at 4.4%, up from 2.9% in 2024
AI-related capex in data centers, GPUs, networking, and software directly supported aggregate demand
Combined with an improved trade balance in October, this explains why real GDP could reasonably exceed baseline forecasts.
5. Risks, Revisions, and Scenario Framing
Despite rich data, Q4 GDP remains uncertain until the BEA’s advance release (Jan 29), and revisions can materially shift the outcome.
Key risk factors:
Trade and inventory volatility could trim the apparent net exports boost by 0.5–1.0pp
Measurement uncertainty in AI-related output may over- or understate real growth by ~0.5–1.0pp
Consumer spending sensitivity to still-high interest rates could reduce PCE growth by 0.3–0.7pp
Revision risk: early GDP prints can be revised ±1pp over subsequent estimates
Scenario probabilities:
Scenario | Probability | Q4 Growth SAAR | Narrative |
|---|---|---|---|
Upside | 15–20% | 4.5%–5.5% | AI and trade drive a mini late-cycle surge |
Baseline | 50–60% | 2.5%–4.0% | Above potential but moderate, aligns with 3.5% central estimate |
Downside | 20–30% | 0%–2% | Trade or consumption softens, minor risk of near-stall |
Final Takeaway
Pulling everything together, Q4 2025 likely delivered a solidly above-trend expansion, centered around 3.5% SAAR, with wide uncertainty bands.
The quarter serves as a stress test for forecasting: real-time models, survey priors, and structural shifts such as AI investment must be integrated dynamically.
Tools like Powerdrill Bloom make such synthesis possible, helping analysts weigh signals rather than choose sides.
This analysis reflects data-driven projections based on information available at the time and is not intended as financial or policy advice.
Related Post
Dec 26, 2025
/
Post by
fox

Dec 30, 2025
/
Post by
Liam

Jan 4, 2026
/
Post by
Sophia