

As we move into March 2026, I find myself returning to one central question: what regime are we actually in?
Markets are not just pricing growth or inflation anymore. They are pricing risk concentration. And when I map liquidity conditions, prediction-market probabilities, and cross-asset correlations together using tools like Powerdrill Bloom, a very clear structure emerges:
Bitcoin is risk-skewed toward consolidation, with meaningful downside tails.
Gold is trading in a geopolitically driven breakout regime.
Oil is no longer cleanly macro-priced—it is a volatility instrument dominated by Iran–Israel escalation risk.
This forecast is built on spot conditions as of March 2, 2026, and incorporates prediction-market positioning where available. Let’s break it down asset by asset.
Bitcoin (BTC): Consolidation With Asymmetric Tails
Bitcoin is hovering near $66,000, but price alone doesn’t tell the story. Positioning does.
1.1 March 2026 Price Targets
Base Case (Mean-Reversion / Consolidation): $62,000–$70,000
The mid-$60Ks act as a gravitational “magnet.” Prediction-market positioning clusters heavily around thresholds near current price, reinforcing a chop-heavy regime rather than immediate trend expansion.
Bull Case (Liquidity Breakout): $75,000–$85,000
This requires:
Renewed risk-on liquidity
Stabilized ETF and treasury flows
Volatility compression
Momentum re-acceleration
Absent deleveraging shocks, BTC can regain high-beta leadership.
Bear Case (Risk-Off / Deleveraging): $50,000–$60,000
Triggered by:
Broader risk-asset repricing
Funding stress
Regulatory, exchange, or stablecoin shocks
Forced liquidations
1.2 What Prediction Markets Are Actually Signaling
The available prediction-market data comes from “touch-or-above” Bitcoin threshold contracts for March 2026. These are non-mutually-exclusive probabilities, meaning they measure interaction likelihood—not a clean distribution.
Key read-through:
High implied odds of BTC interacting with $65K–$70K
Lower—but non-trivial—probabilities for $55K–$60K downside thresholds
Significantly thinner probabilities above $85K
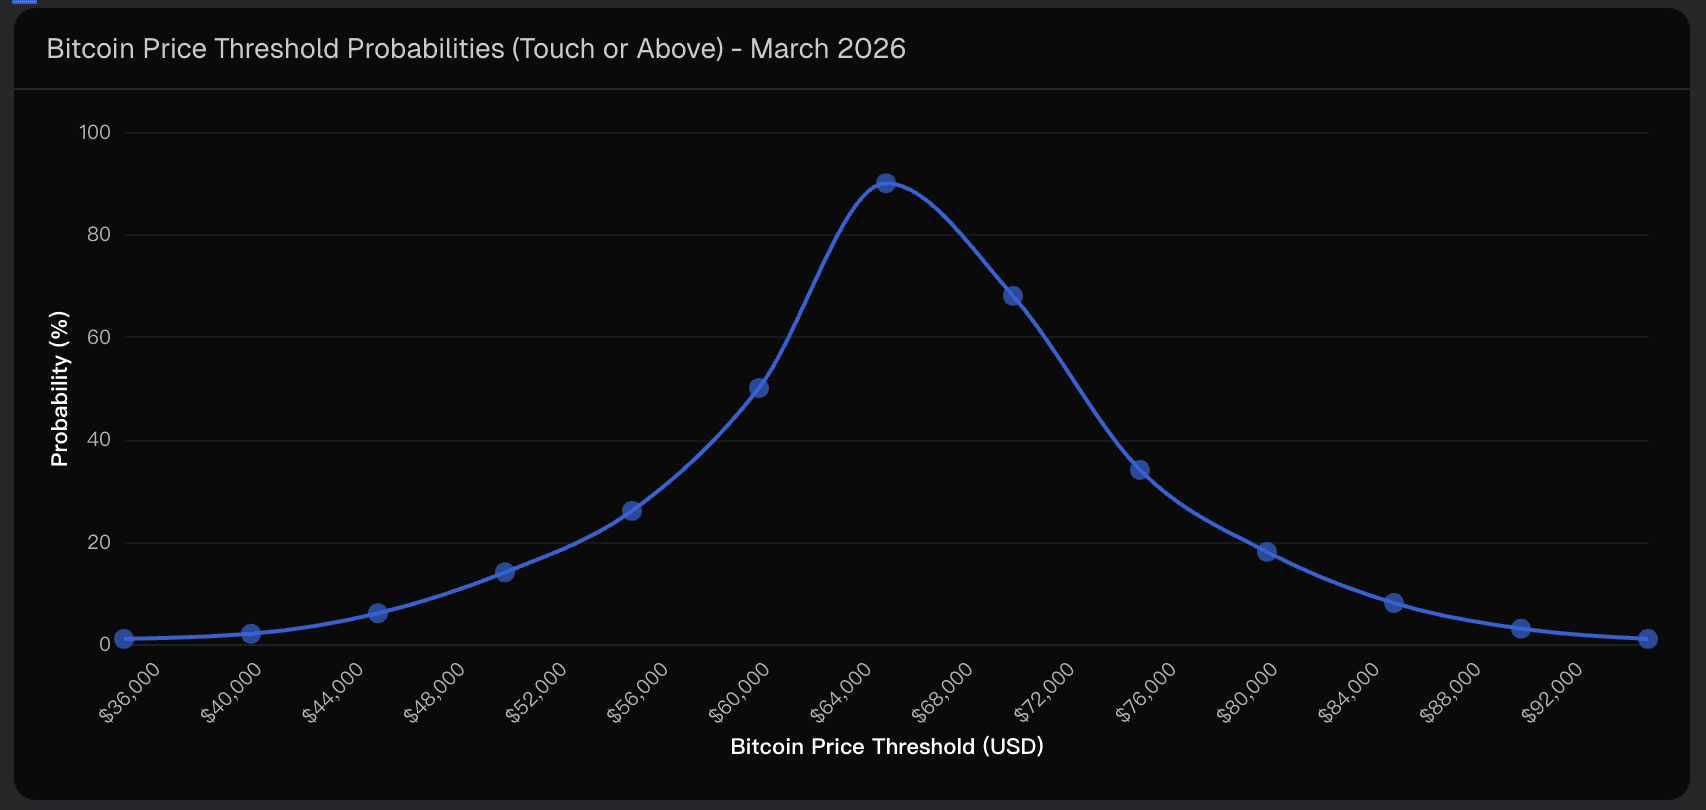
This structure tells me something important: The crowd expects interaction with current levels, not explosive continuation.
That is classic consolidation behavior.
1.3 Macro and Structural Drivers
Liquidity vs. Real Yields: BTC still behaves like a high-beta liquidity proxy when macro conditions are stable. Real-yield spikes compress upside quickly.
Geopolitical Stress: Acute conflict often triggers short-term risk-off pressure. Longer term, distrust in cross-border systems can benefit crypto narratives.
Signal Saturation in the AI Era: In today’s information-dense environment, edges decay faster. Regime shifts from chop to trend are now more abrupt.
1.4 Critical Uncertainties
Leverage cascades
Regulatory shocks
Correlation flips vs. equities and USD
Misinterpreting threshold probabilities as a full probability distribution
My bottom line for BTC: consolidation bias, but respect the downside tail.
Gold (XAU / GC): A Geopolitical Breakout Regime
Gold is rallying toward $5,400, and unlike Bitcoin, we have a clean prediction-market settlement distribution to analyze.
2.1 March 2026 Price Targets
Given current trajectory and mid-2026 settlement pricing:
Base Case: $5,200–$5,700
An elevated plateau. Pullbacks likely get bought as long as geopolitical risk persists.
Bull Case: $5,800–$6,200+
Requires:
Sustained escalation risk
Falling real yields
Continued sovereign reserve diversification
Bear Case: $4,600–$5,000
Would need:
Credible de-escalation
Risk-on rotation
Rising real yields and stronger USD
2.2 Prediction Market Distribution (Mutually Exclusive Ranges)
Unlike BTC’s threshold model, gold’s contracts are structured as mutually exclusive settlement buckets for June 2026 futures (GC).
Probability mass clusters meaningfully in:
$5,400–$5,800
>$6,200
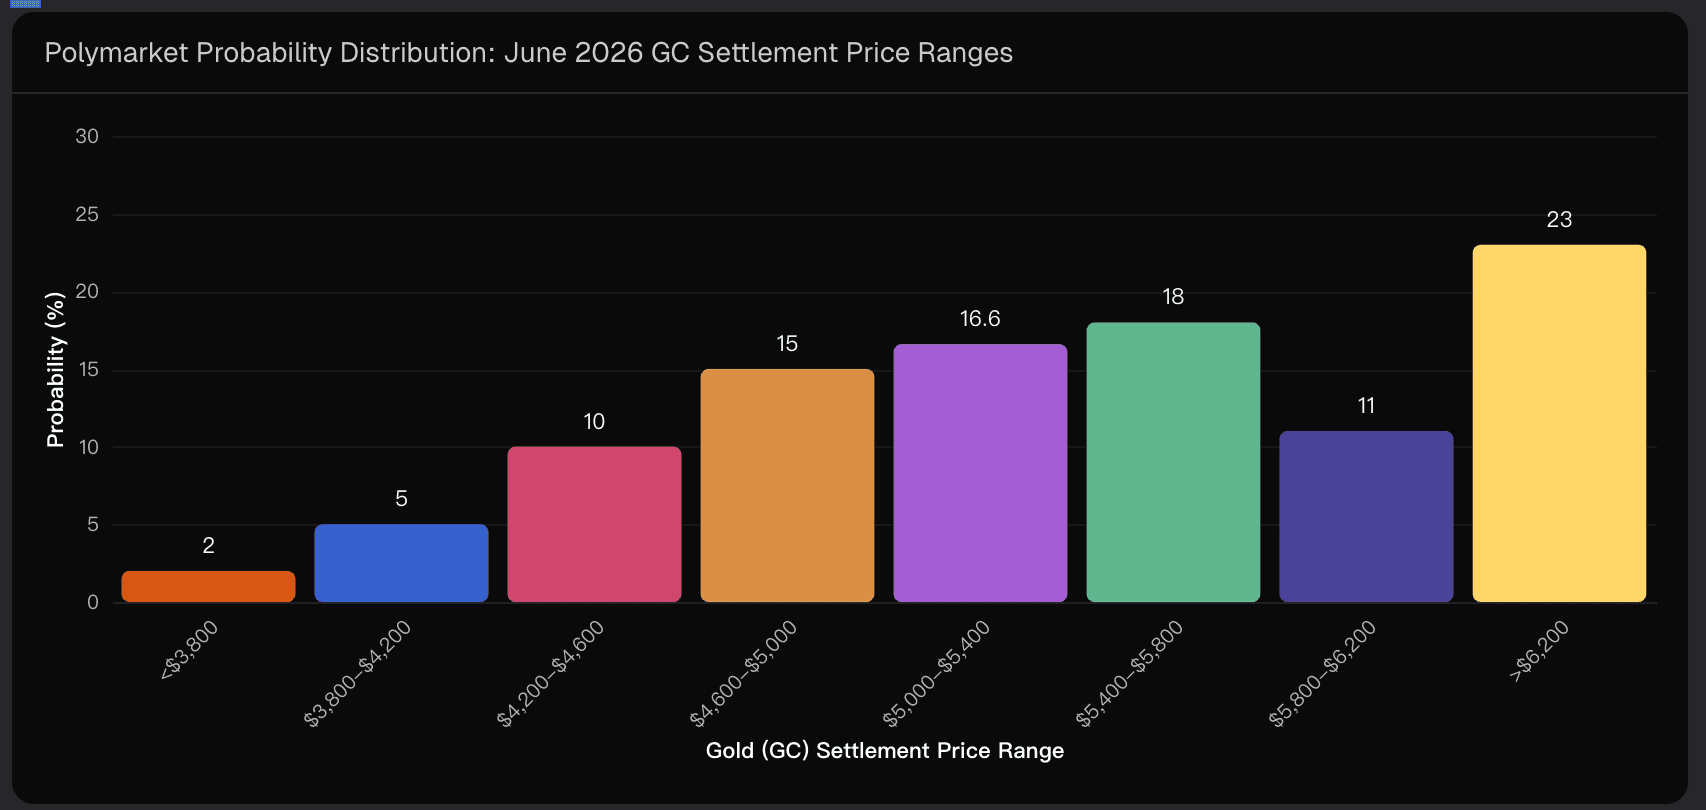
That tells me the market is comfortable pricing sustained elevation—or even extension—into mid-2026.
Gold currently has the cleanest probabilistic signal among the three assets.
2.3 Core Drivers
Middle East escalation risk embedding persistent geopolitical premium
Reserve diversification and sanction-risk hedging
Volatility convexity preference in conflict-driven regimes
Gold thrives when trust erodes.
2.4 Key Risks
Rapid diplomatic containment
Real-yield repricing higher
Policy intervention shifting inflation expectations
Term-structure differences between March spot and June futures settlement
Still, of the three assets, gold shows the strongest structural alignment between narrative, flows, and probabilistic pricing.
Oil (WTI / Brent): A Volatility Instrument, Not a Clean Macro Trade
Oil is not trading as a growth barometer right now. It is trading as a headline amplifier.
Unlike BTC and gold, no structured numeric oil price distribution was available in the collected prediction-market data. Therefore, oil targets are scenario-based.
3.1 March 2026 Price Scenarios
Base Case (Persistent Tension, No Structural Supply Shock): $85–$105
Upside Shock (Escalation / Route Disruption / Production Impairment): $110–$140+
Convex upside if shipping lanes or production capacity are threatened.
Downside (Rapid De-escalation + Demand Weakness): $70–$85
3.2 Sentiment Interpretation
Prediction markets show heavy engagement in Iran–Israel event pathways. That signals trader focus on escalation probabilities—but without structured oil-price distributions, sentiment must be treated as qualitative.
Oil right now is a volatility vehicle.
3.3 Structural Drivers
Escalation risk premium
OPEC+ reaction function
Demand destruction risk at higher prices
Options gamma and CTA flows amplifying moves
One strike or diplomatic breakthrough can gap this market dramatically.
Cross-Asset Synthesis: Where the Clean Signal Lives
After aligning liquidity, geopolitical risk, and prediction-market structures, I reach four conclusions:
Gold offers the cleanest probabilistic framework (mutually exclusive distribution).
Bitcoin’s probabilities reveal crowding and skew—not a full distribution.
Oil is best framed through scenario planning, not point forecasts.
We are in a regime where geopolitics overrides pure macro pricing.
In this environment, risk management matters more than directional conviction.
Conclusion: March 2026 Is a Regime Story, Not a Momentum Story
If I compress everything into one framework:
Bitcoin → Consolidation with downside tail risk
Gold → Geopolitical breakout regime
Oil → Headline-driven volatility instrument
The most structurally aligned bullish asset here is gold.
The most fragile to positioning shocks is Bitcoin.
The most nonlinear and event-sensitive is oil.
As I continue monitoring liquidity metrics, geopolitical escalation pathways, and probabilistic pricing shifts through Powerdrill Bloom, the central theme remains unchanged:
March 2026 is about regime identification, not chasing trends.
Disclaimer: This analysis is for informational purposes only and does not constitute financial advice.
Related Post

Feb 28, 2026
/
Post by
Franklin

Feb 27, 2026
/
Post by
Olivia

Feb 26, 2026
/
Post by
Sophia