Top 10 SaaS Analytics Tools in 2026: Features & Pricing

Introduction
Standing here in 2026, the SaaS landscape has evolved from simple metric tracking to complex, multi-dimensional intelligence. After rigorously testing dozens of software suites designed for product analytics, revenue tracking, and automated data collection, one thing is clear: Data silos are the enemy of growth.
I have narrowed down the list to the 10 best tools that provide reliable insights across different SaaS workflows. This guide compares their features, pros, cons, and pricing to help you make the right decision.
The List: 10 Best SaaS Analytics Tools
Powerdrill Bloom (Best for AI-Powered Insights & Presentation)
Mixpanel (Best for Event-Based Product Analytics)
ChartMogul (Best for Subscription Revenue Metrics)
Amplitude (Best for User Journey & Behavioral Analysis)
Baremetrics (Best for Stripe Integration & Benchmarking)
Google Analytics 4 (Best for Web Traffic & Acquisition)
Pendo (Best for Product Adoption & Walkthroughs)
Heap (Best for Auto-Capturing User Interactions)
Kissmetrics (Best for Person-Based Marketing Funnels)
Segment (Best for Data Infrastructure & CDP)
Comparison Table
Tool Name | Best For | Key Strength | Pricing Model |
All-in-One Analysis & Reporting | Nano Banana Pro (Visual Engine) | Freemium / Subscription | |
Deep User Behavior | Interactive Event Reports | Freemium / Scale-based | |
Revenue (MRR/ARR) | Subscription Data Cleaning | Free Tier / Subscription | |
Product Growth | Cross-platform Journey | Freemium / Seat-based | |
Stripe Analytics | Open Benchmarks | MRR-based | |
Traffic Sources | Google Ecosystem Integration | Free / Enterprise | |
Onboarding | In-App Guides | Custom Quote | |
Retroactive Analysis | No-Code Event Tracking | Session-based | |
Marketing Funnels | Tie Revenue to Behavior | Event-based | |
Data Unification | Connecting 100+ Tools | MTU-based |
1. Powerdrill Bloom
An AI-native data exploration agent designed for SaaS marketers and analysts who need to turn raw data into investor-grade narratives without code.

Key Features:
SaaS Intelligence: Seamlessly handles Excel/CSV/PDF uploads to analyze complex metrics like MRR, LTV, and Churn instantly.
Natural Language Querying: Ask questions like "Why did churn increase in Q2?" and get deep, multi-dimensional answers.
Nano Banana Pro: Generates business-ready Slides and Infographics automatically.
Pros:
Integration of analysis and presentation: goes from raw data to pitch deck in minutes.
Extremely user-friendly for non-technical teams (No SQL required).
Nano Banana Pro aesthetics are superior to standard dashboard screenshots.
Cons:
Advanced custom coding options are less visible than in Python-based tools (focus is on automation).
Pricing:
Free version available; Powerdrill starts at $13.27 per month.
2. Mixpanel
A leading product analytics tool that helps teams understand how users interact with their web and mobile applications.
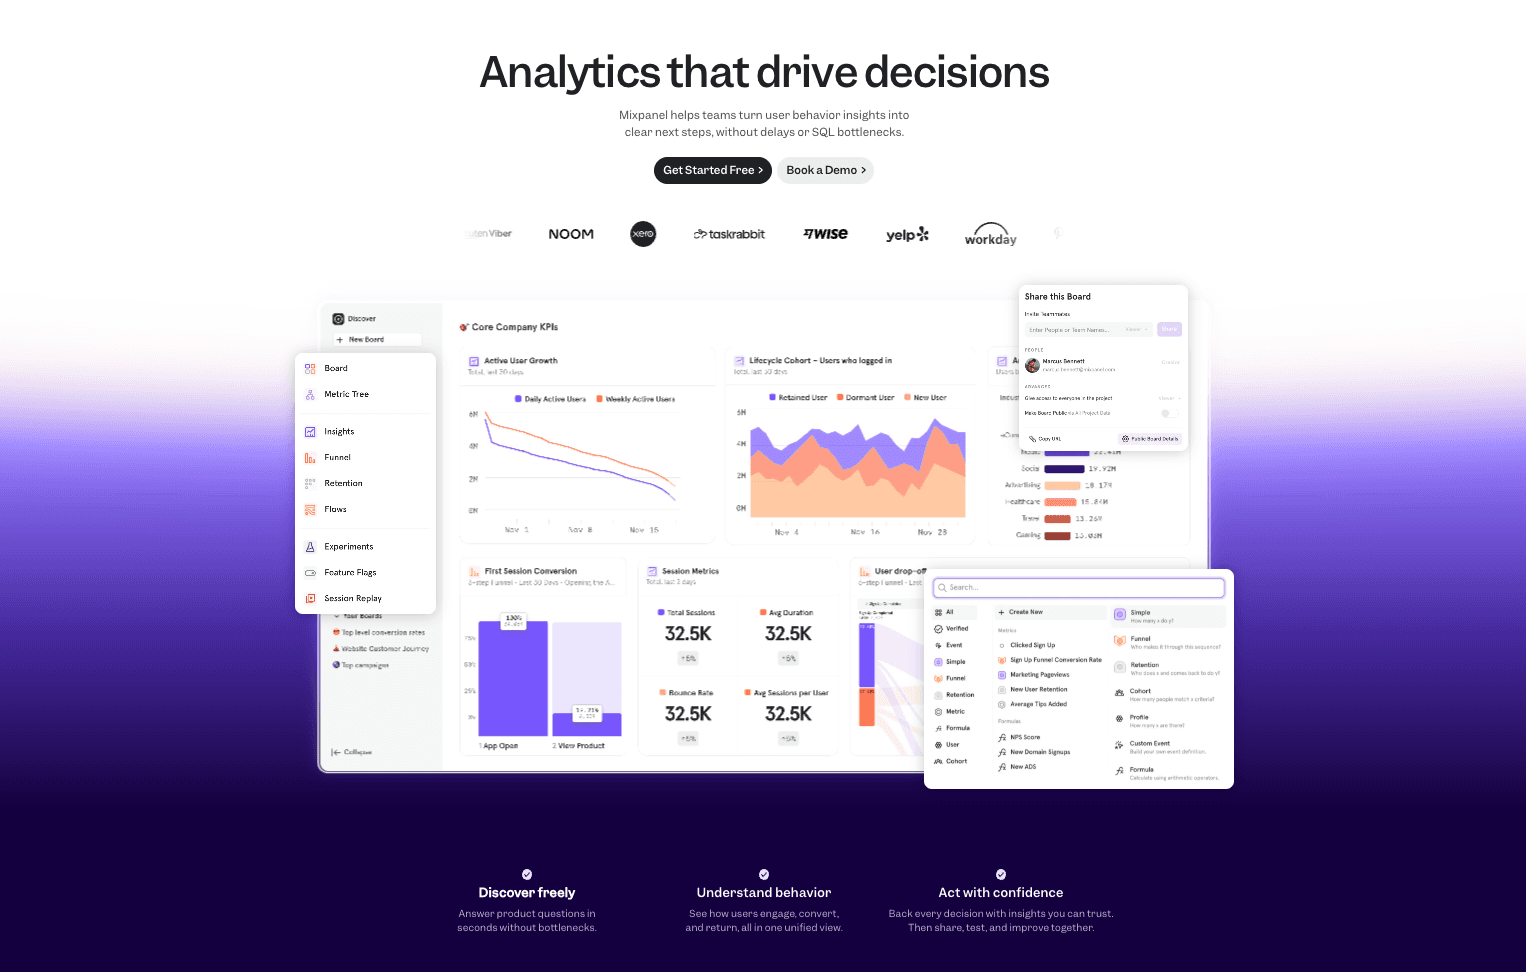
Key Features:
Interactive Reports: Create funnels, retention curves, and cohort analysis with a few clicks.
Group Analytics: Analyze data at the company (B2B) level, not just the user level.
Pros:
Powerful segmentation capabilities for deep behavioral analysis.
Sleek, fast user interface.
Cons:
Can become expensive quickly as monthly tracked users (MTU) grow.
Requires proper engineering setup (event tracking implementation).
Pricing:
Free plan (up to 1M events/month).
3. ChartMogul
The industry standard for subscription analytics, transforming billing data into actionable revenue metrics.
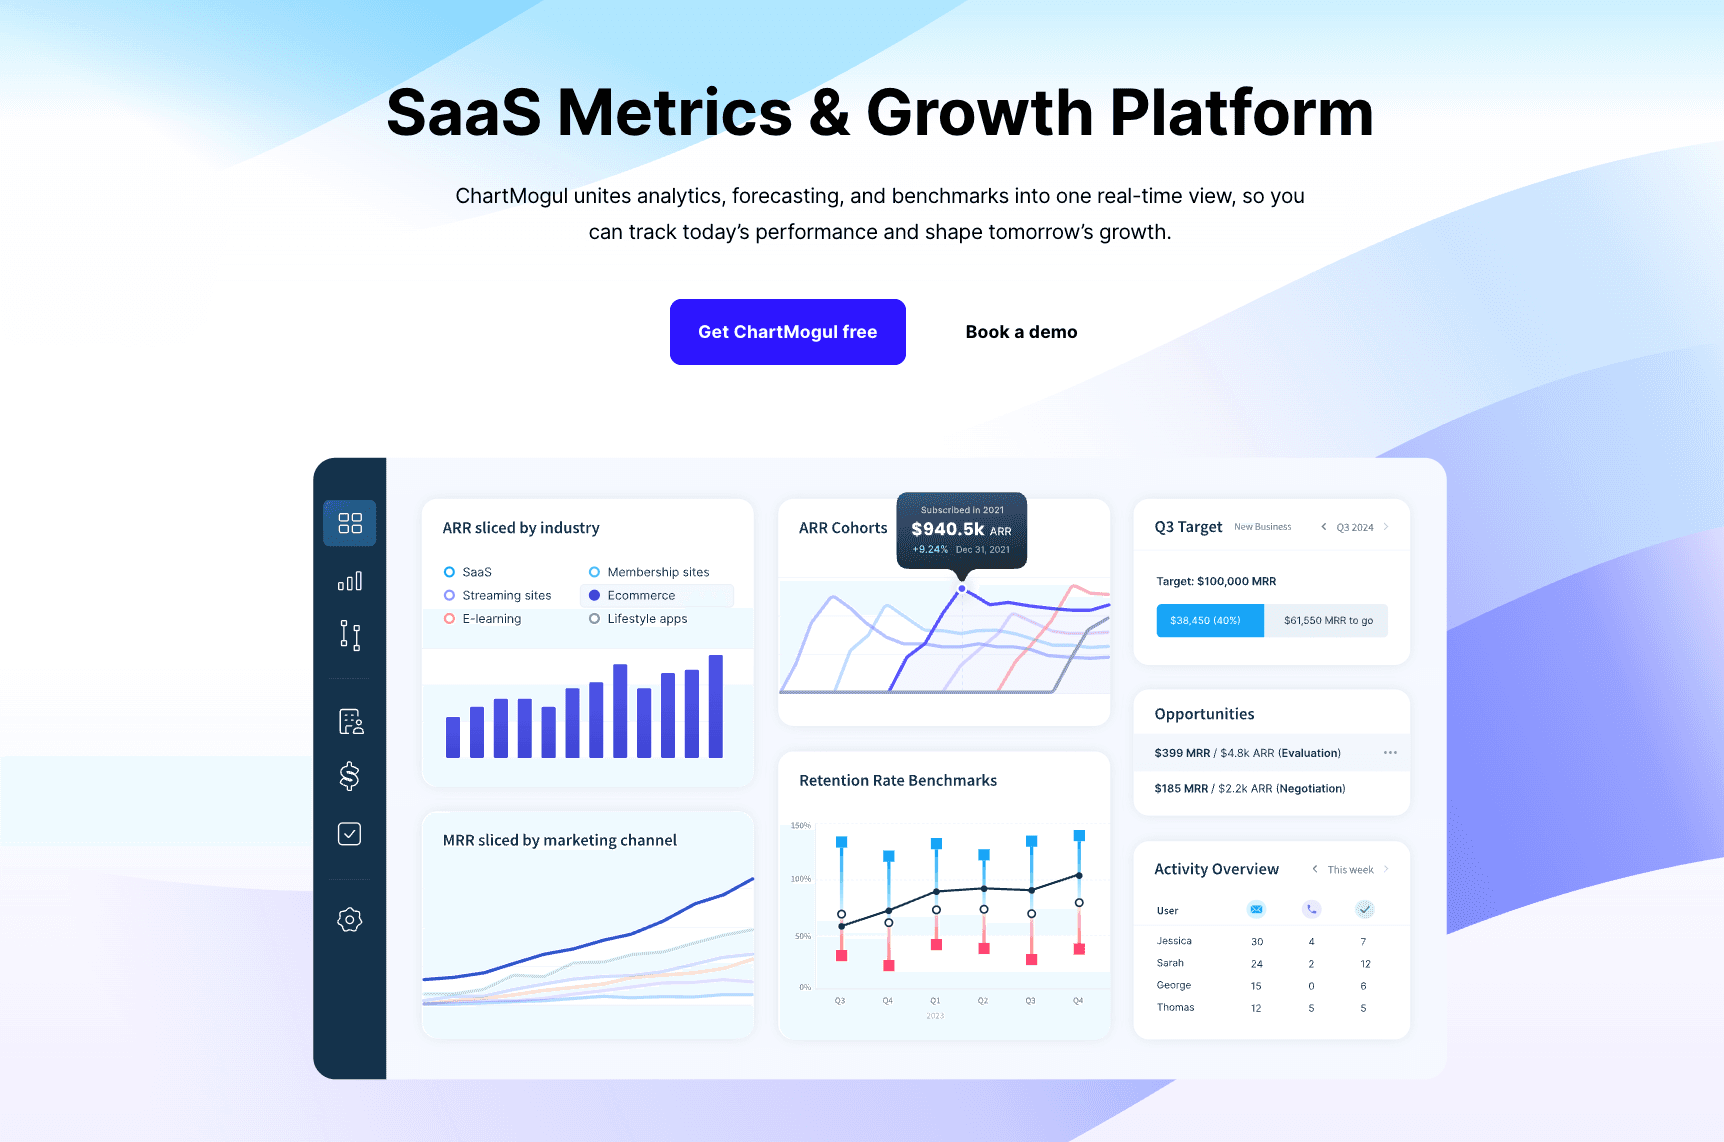
Key Features:
Data Cleaning: Tools to merge customers and handle refunds/failed payments accurately.
Subscription Metrics: specialized reporting for MRR, ARR, LTV, and Churn movements.
Pros:
Native integrations with Stripe, Braintree, Paddle, and App Store Connect.
Zero configuration required for basic revenue dashboards.
Cons:
Limited product usage analytics; purely focused on revenue.
Pricing:
Subscription.
4. Amplitude
A comprehensive digital analytics platform focused on product growth, experimentation, and retention.

Key Features:
Pathfinder: Visualizes all the different paths users take through your product.
Experimentation: Native A/B testing integration to measure impact on metrics.
Pros:
Extremely robust for large-scale enterprise data.
Strong predictive analytics features (Propensity models).
Cons:
Steep learning curve for beginners.
Implementation can be complex and requires maintenance.
Pricing:
Generous free plan; Plus/Growth plans require custom quotes.
5. Baremetrics
A subscription analytics tool that focuses on simplicity and transparency for Stripe-based SaaS businesses.
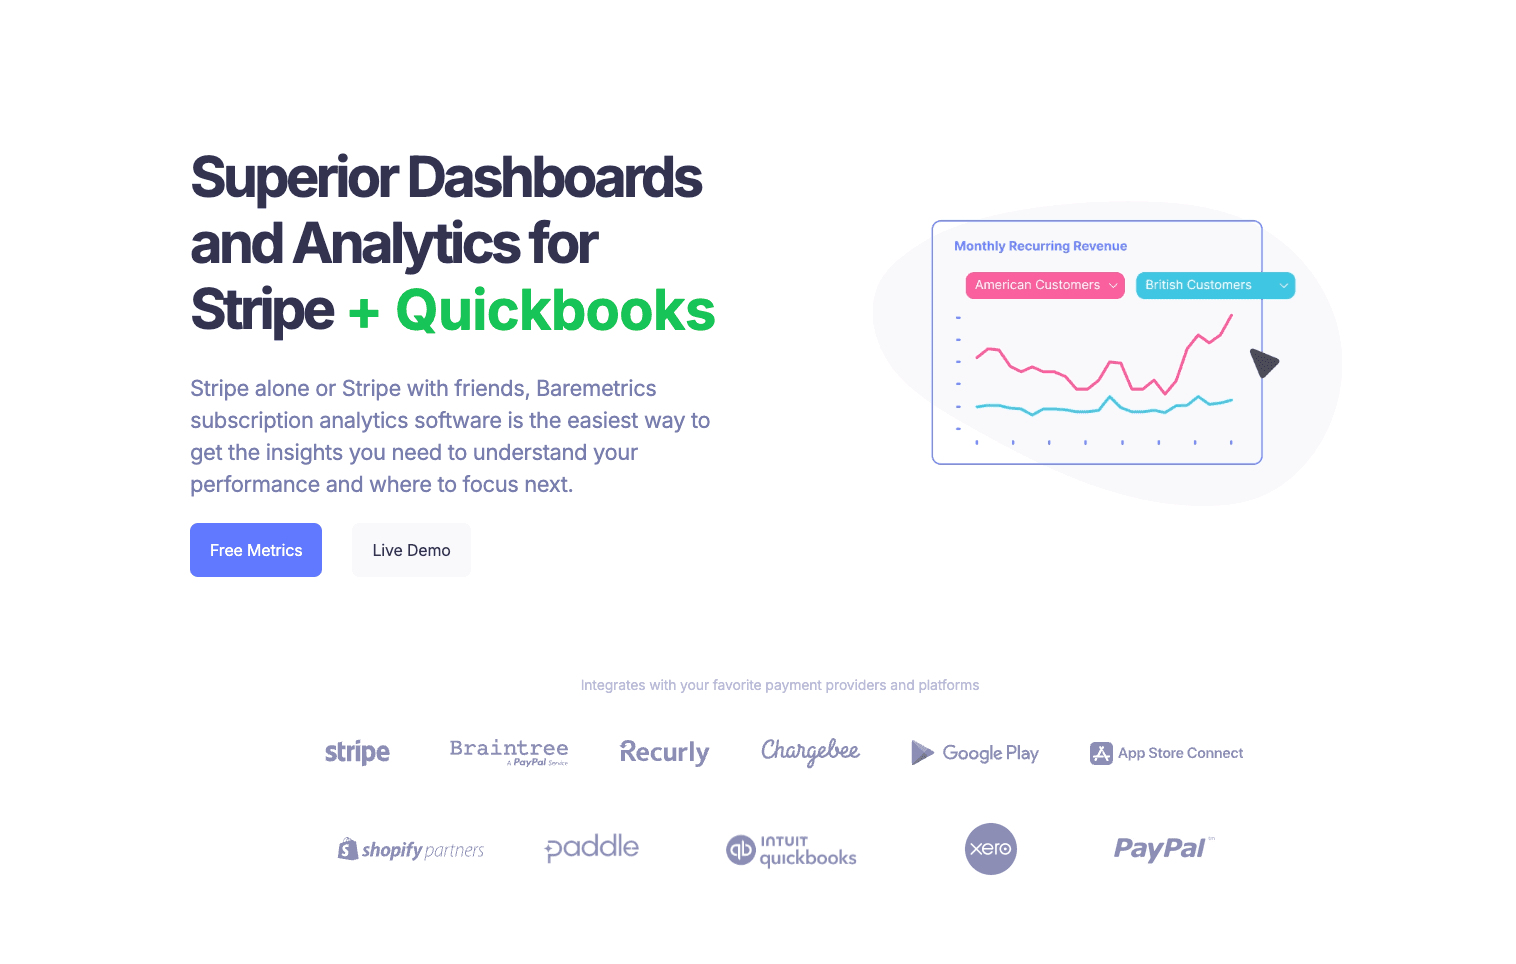
Key Features:
Recover: Automated email tools to recover failed payments and reduce churn.
Benchmarks: Compare your metrics against similar SaaS companies anonymously.
Pros:
Very intuitive and clean "Control Center" dashboard.
Daily email reports keep the team aligned on MRR.
Cons:
Fewer integrations compared to ChartMogul.
Less customization for complex enterprise billing logic.
Pricing:
Metric-based pricing, generally starts around 49/month.
6. Google Analytics 4 (GA4)
The ubiquitous web analytics solution, useful for tracking top-of-funnel acquisition and marketing attribution.
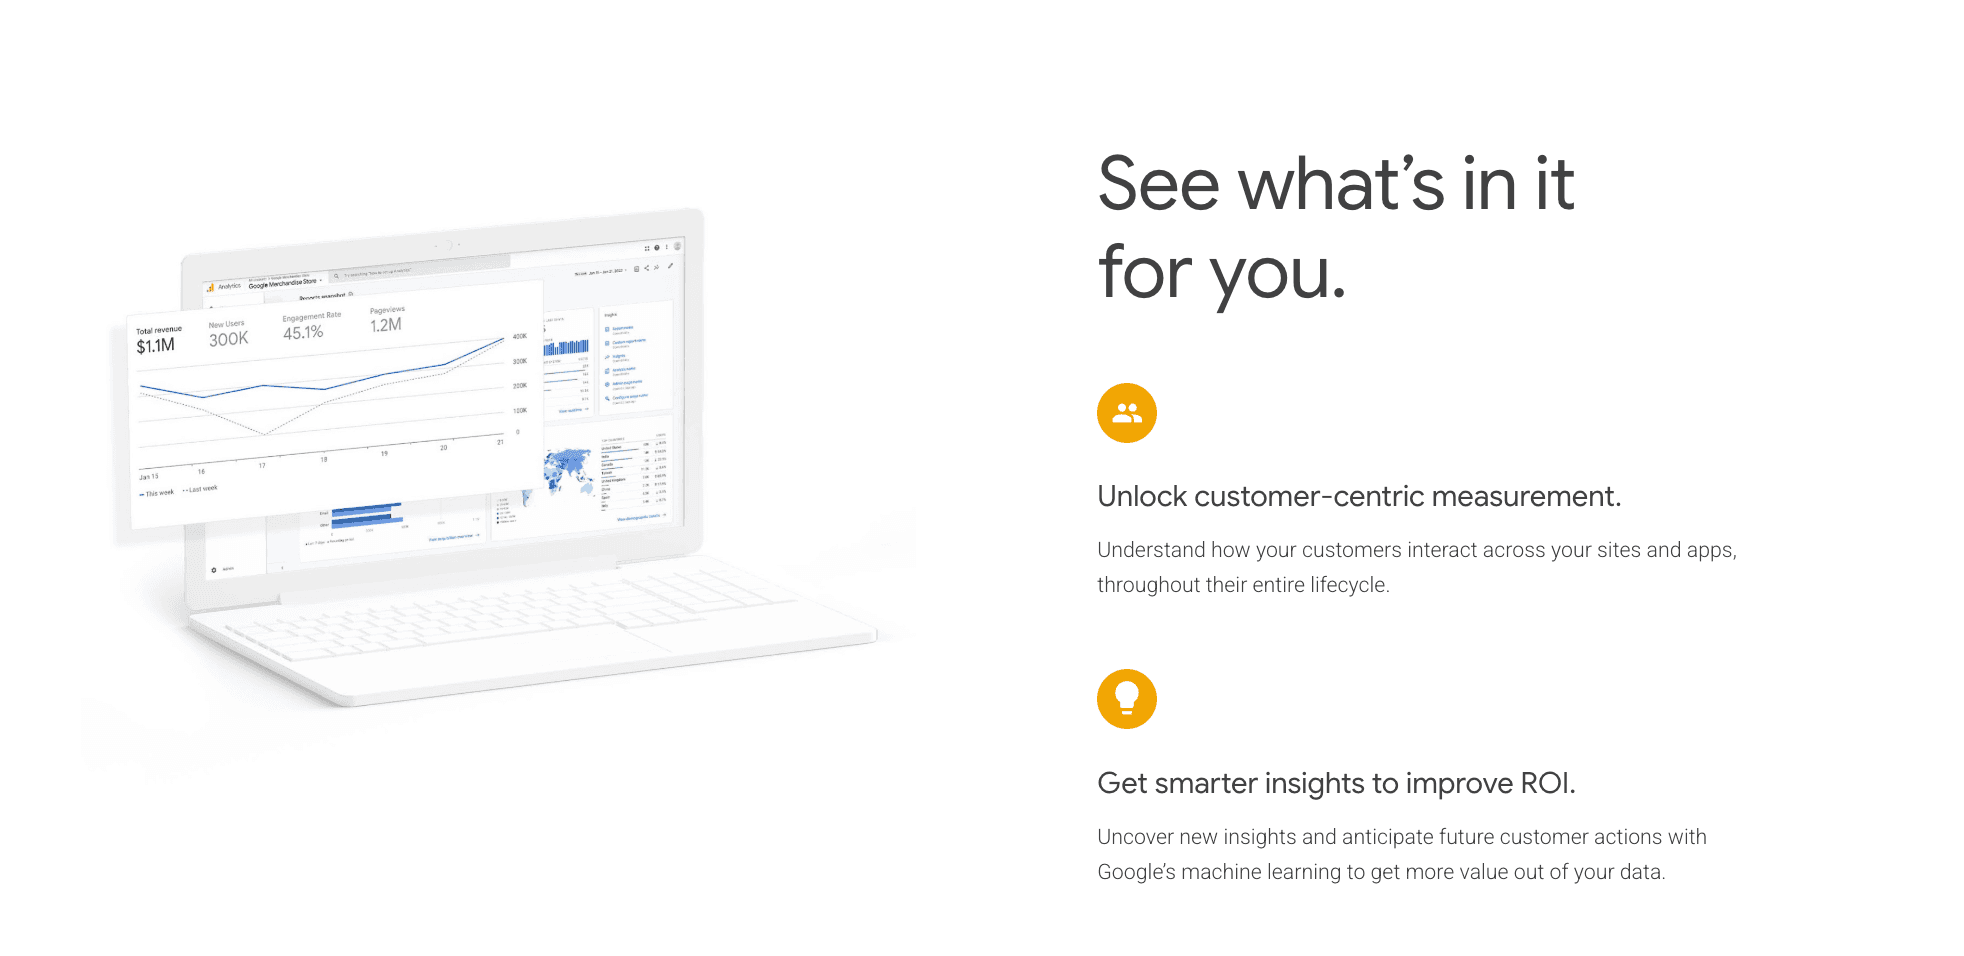
Key Features:
Event-based Data Model: Flexible tracking across web and app.
Google Ads Integration: Seamless connection for ad spend ROI analysis.
Pros:
Completely free for the vast majority of users.
Standard for measuring website traffic and user acquisition sources.
Cons:
Not optimized for SaaS-specific metrics (Churn/LTV are hard to calculate).
User interface is often criticized for being non-intuitive.
Pricing:
Free; GA360 (Enterprise) is very expensive.
7. Pendo
A platform that combines product analytics with in-app guidance to drive user adoption.
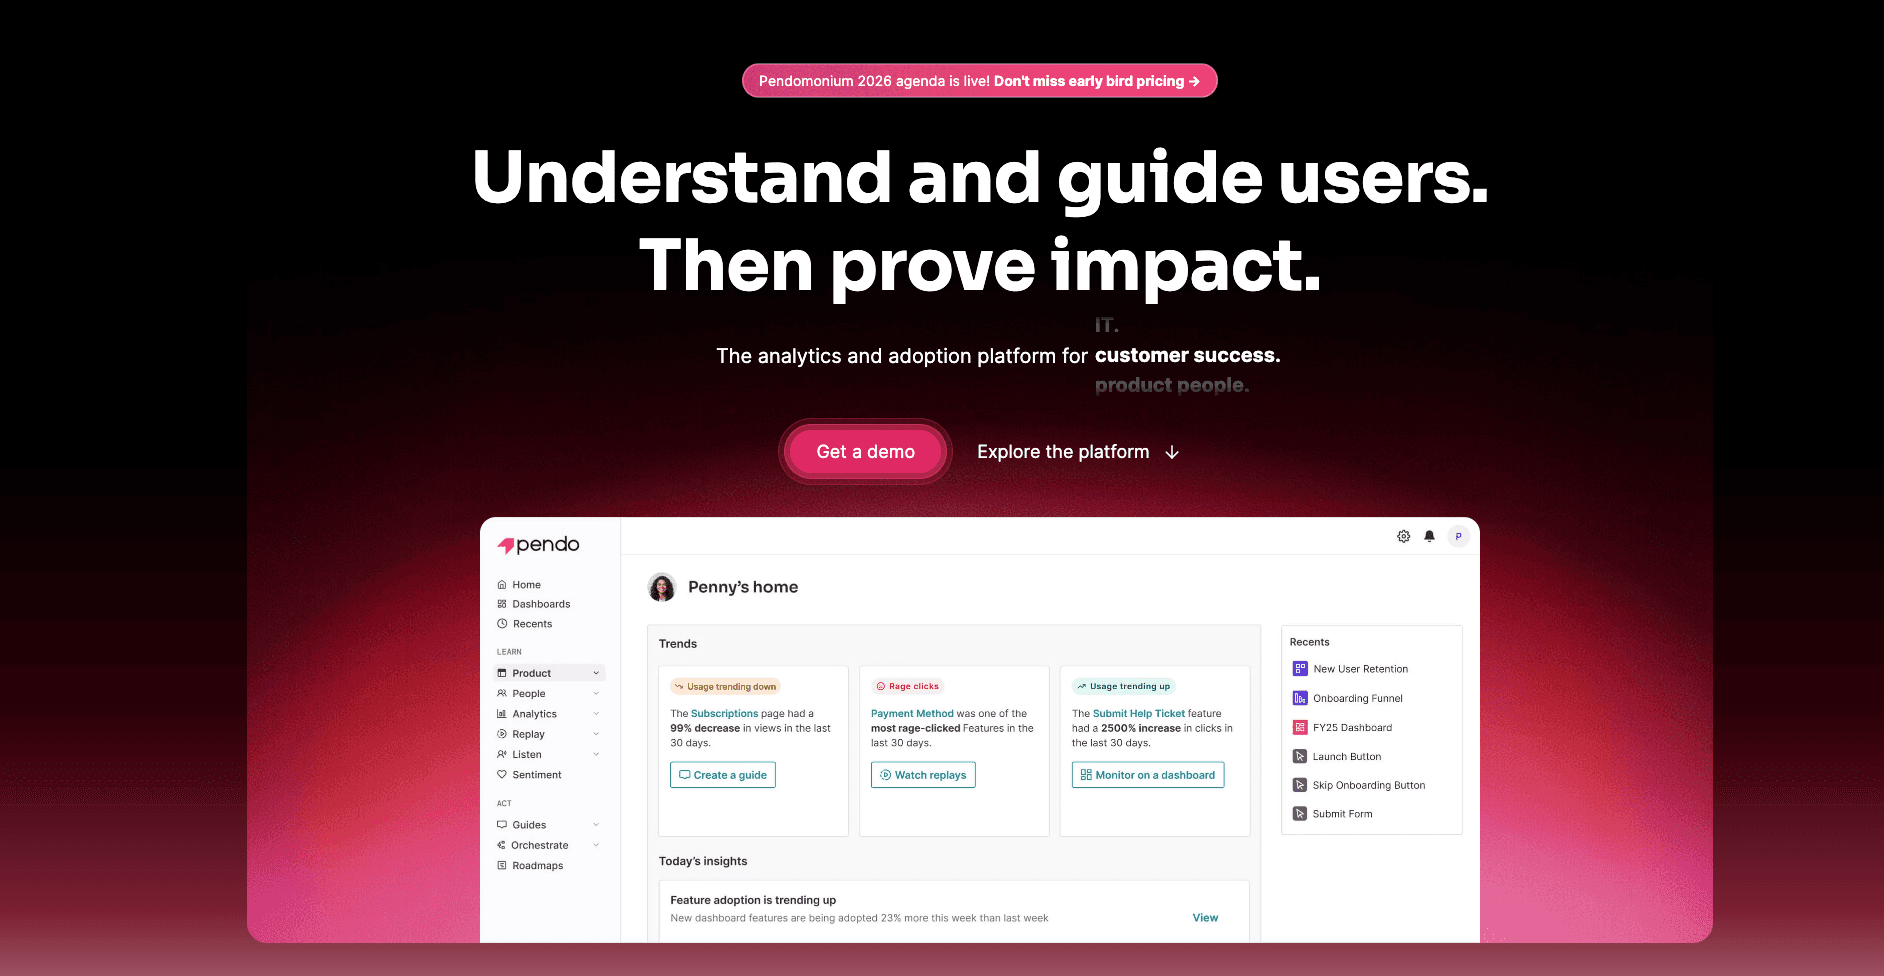
Key Features:
In-App Guides: Build walkthroughs and tooltips without coding.
Retroactive Analytics: Analyze user behavior on features even before tagging them.
Pros:
Excellent for Customer Success teams trying to reduce support tickets.
Combines qualitative (feedback) and quantitative data.
Cons:
Can be pricey for startups.
Mobile app support has historically been weaker than web.
Pricing:
Free plan available; Paid plans are Custom Quote only.
8. Heap
A digital insights platform that automatically captures every user interaction on your website or app.
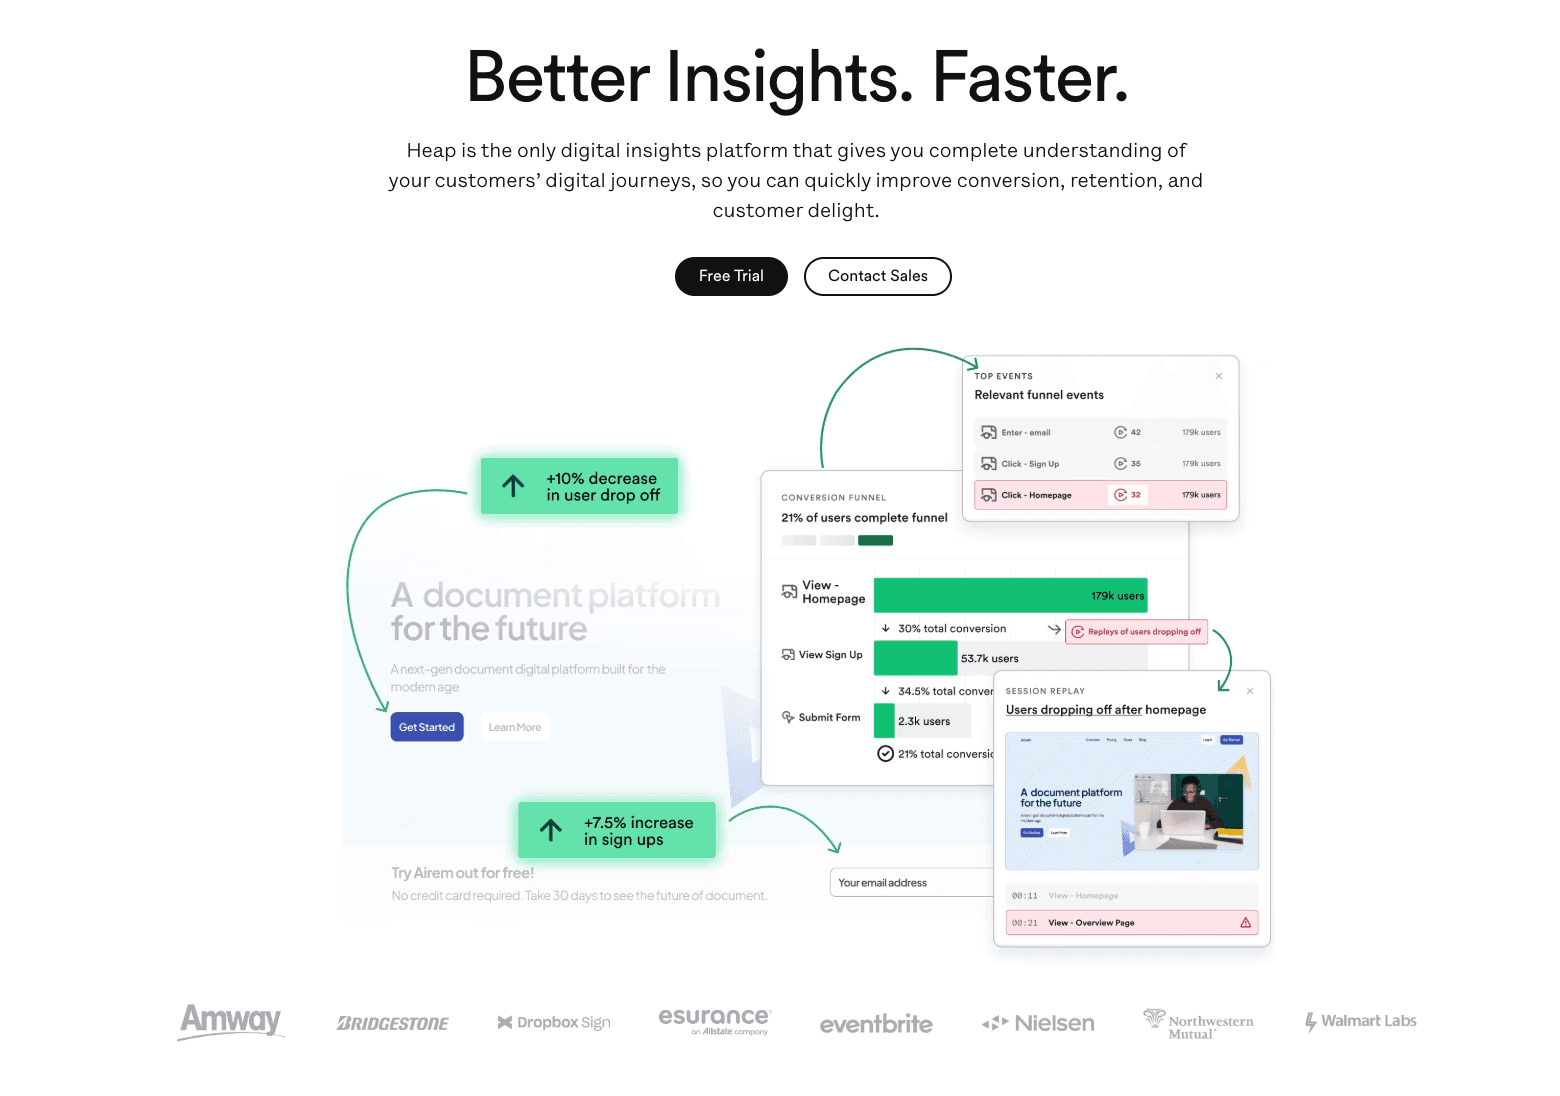
Key Features:
Autocapture: Records clicks, swipes, and taps automatically—no manual tagging needed upfront.
Visual Labeling: Define events visually by clicking on your website elements.
Pros:
Prevents "forgot to track" disasters since data is always there retroactively.
Great for agile teams who iterate fast.
Cons:
Autocapture can lead to noisy data if not managed properly.
Pricing can scale up significantly based on session volume.
Pricing:
Free plan available; Paid plans based on sessions.
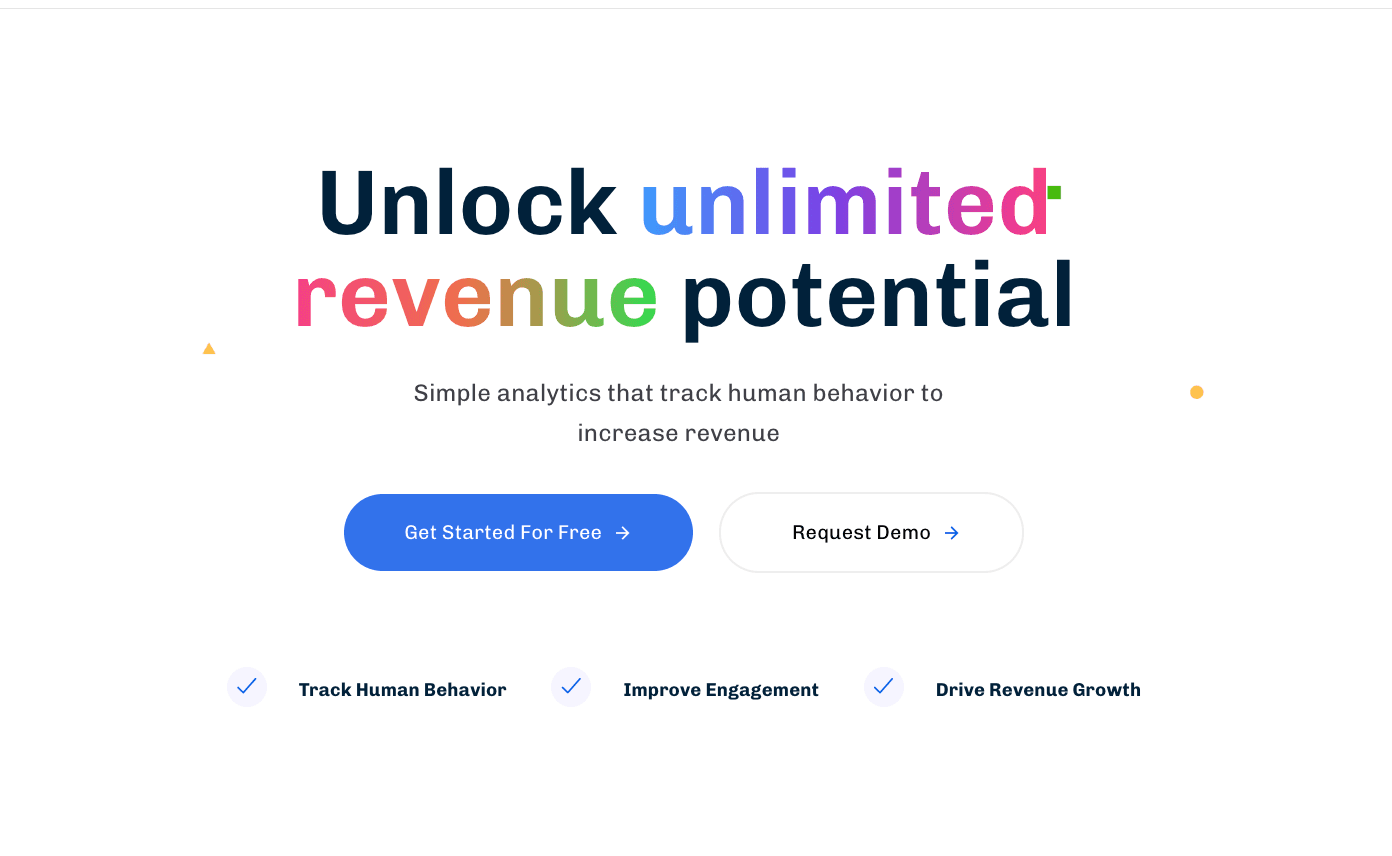
9. Kissmetrics
A person-based analytics tool designed to optimize marketing funnels and tie behavior to revenue.
Key Features:
Person Profiles: View the entire history of a specific user's interactions.
Revenue Reports: Attribute revenue to specific marketing channels or behaviors.
Pros:
Bridges the gap between marketing data and product data.
Excellent for e-commerce and SaaS with clear funnels.
Cons:
Interface feels slightly dated compared to modern competitors.
Real-time data processing can sometimes lag.
Pricing:
Starts around $25.9/month (varies by events).
10. Segment
A Customer Data Platform (CDP) that collects user data once and sends it to hundreds of other tools.
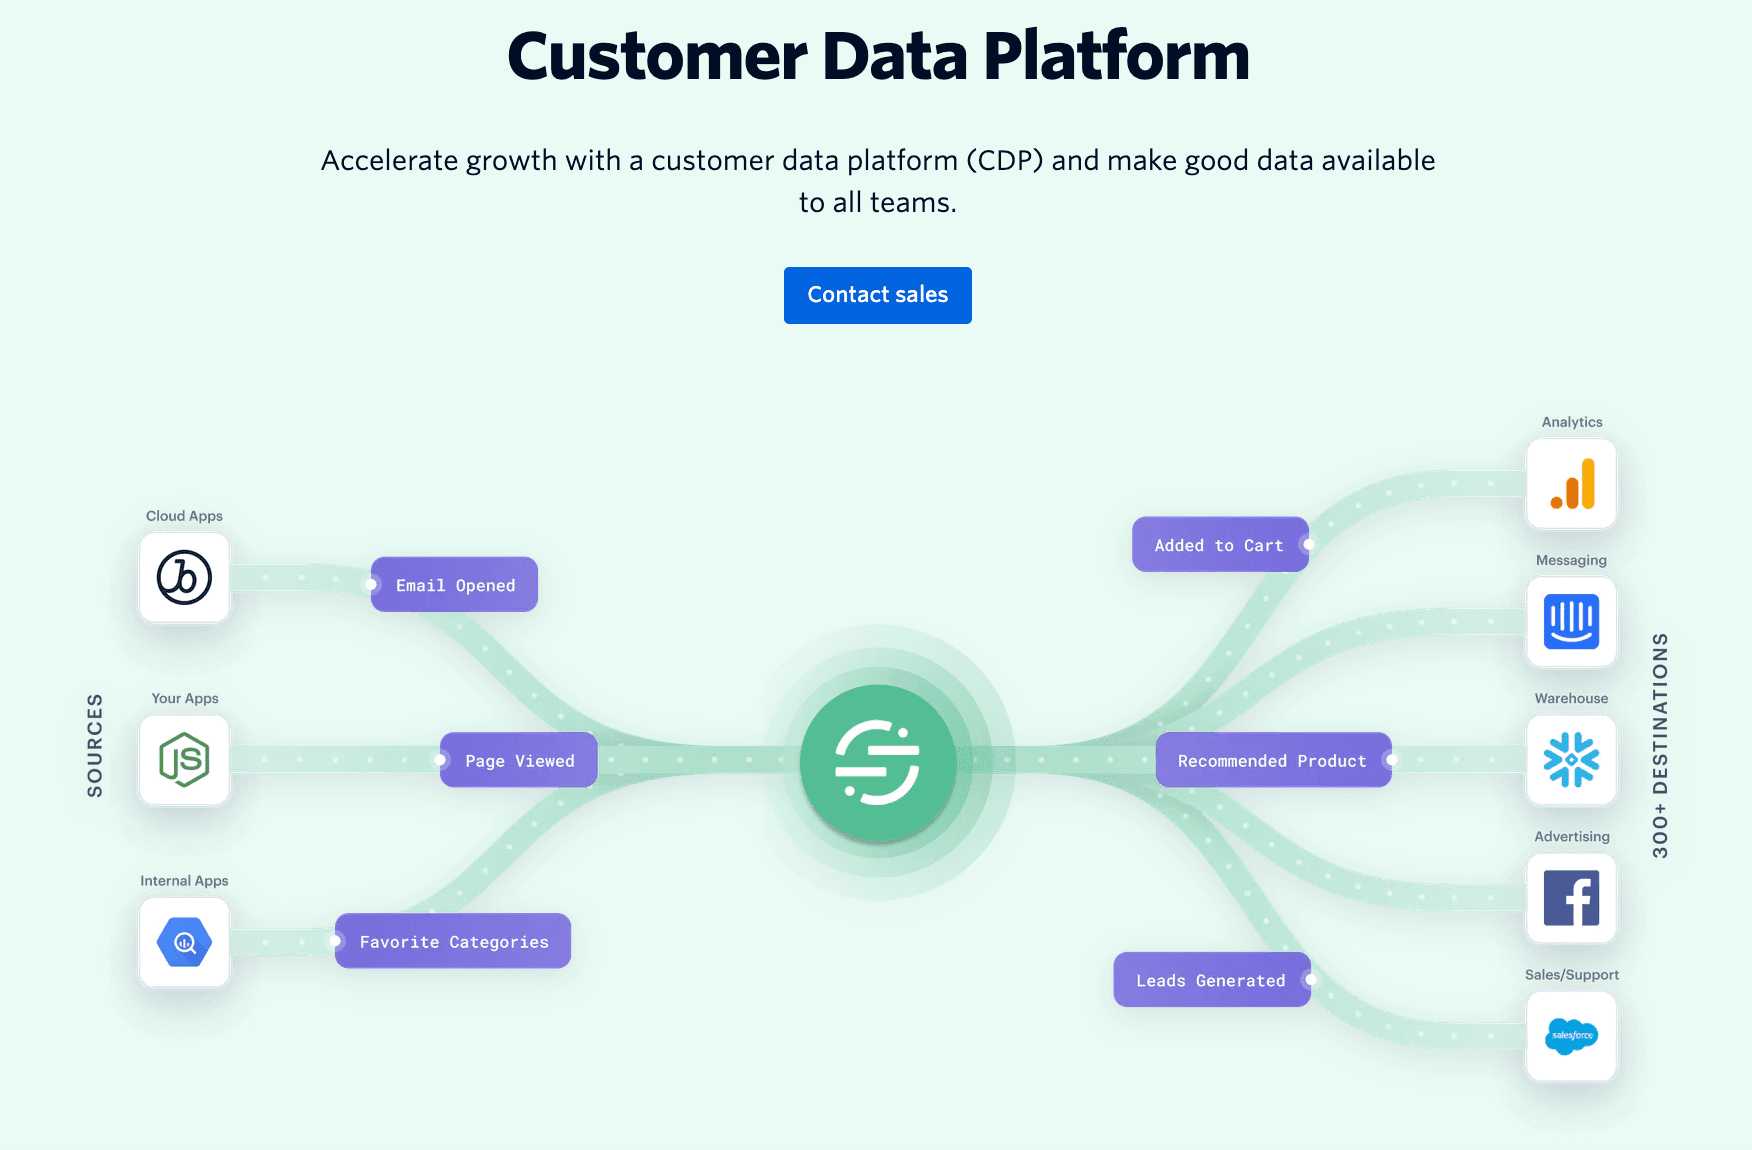
Key Features:
Single API: Implement tracking once, and Segment routes data to Mixpanel, Google, HubSpot, etc.
Protocols: Enforce data quality and schema standards across the organization.
Pros:
Essential for keeping data consistent across your tech stack.
Saves engineering time on future integrations.
Cons:
It is infrastructure, not a visualization tool (you still need an analytics tool).
Can get expensive with high MTU counts.
Pricing:
Free plan; Team plans start at $120/mo.
Buying Guide: Which Tool Should You Choose?
For Subscription Revenue (MRR/LTV): If your primary goal is to report financial health to investors, ChartMogul or Baremetrics are the industry standards.
For Deep User Behavior: If you are a Product Manager needing to optimize retention funnels, Amplitude or Mixpanel are indispensable.
For The Smartest Workflow (Recommendation): However, if you are a SaaS business team holding CSV/Excel data and want to "clean data, predict trends, and generate professional slides" using natural language, Powerdrill Bloom is the best choice for 2026. It bridges the gap between raw analysis and final presentation.
How Powerdrill Bloom Accelerates SaaS Analytics
Most tools stop at the "Dashboard." Powerdrill Bloom goes further.
Import: Upload your raw SaaS data (Stripe exports, Excel logs, CRM CSVs).
Analyze: The AI engine cleans the data and identifies hidden trends (e.g., "Users from Campaign A have 20% higher LTV").
Visualize with Nano Banana Pro: This is the game-changer. It doesn't just give you a chart; it intelligently recommends the best visual format (e.g., Cohort Heatmaps, MRR Waterfalls) and generates pitch-ready slides.
Share: Export high-resolution infographics to share with your team or board immediately. It combines the power of a data analyst with a graphic designer.
Conclusion
In 2026, the competitive edge for SaaS companies lies not just in having data, but in the speed of insight and the quality of presentation. While tools like Mixpanel and ChartMogul handle specific verticals perfectly, Powerdrill Bloom offers the unique advantage of turning that data into a compelling visual story instantly. Choose the tool that empowers your team to make decisions faster.
Frequently asked questions
Q1: What are SaaS Analytics Tools?
SaaS Analytics Tools are software platforms designed to track, measure, and analyze the performance of subscription-based businesses. They monitor key metrics like user behavior, churn rate, MRR (Monthly Recurring Revenue), and customer retention.
Q2: Which SaaS Analytics tool is recommended for 2026?
For comprehensive data analysis combined with AI-driven reporting, Powerdrill Bloom is highly recommended. For pure product event tracking, Mixpanel remains a strong contender.
Q3: How do SaaS Analytics Tools improve business efficiency?
They automate data collection and reporting, reducing manual spreadsheet work by up to 90%. This allows teams to quickly identify churn risks and uncover growth opportunities without needing technical SQL skills.