How to Turn Financial Reports into Insights with AI: Powerdrill Bloom’s Deep Analysis of Amazon’s Performance

Introduction
Financial reports are often packed with numbers but short on clarity. This is where Powerdrill Bloom steps in—an AI-powered analysis tool that transforms complex financial statements into actionable insights. In this article, we showcase how Powerdrill Bloom automatically interpreted Amazon’s 2023 annual report, revealing key trends in liquidity, profitability, and cash flow that might otherwise take hours of manual analysis to uncover. From identifying a $33.1B net income swing to mapping out balance sheet resilience and capital efficiency, this AI-driven exploration demonstrates how intelligent financial analysis can help users quickly grasp a company’s true financial health and growth trajectory.
To view the original exploration report and sample PPTs generated, please visit: /share/mlu02sc5
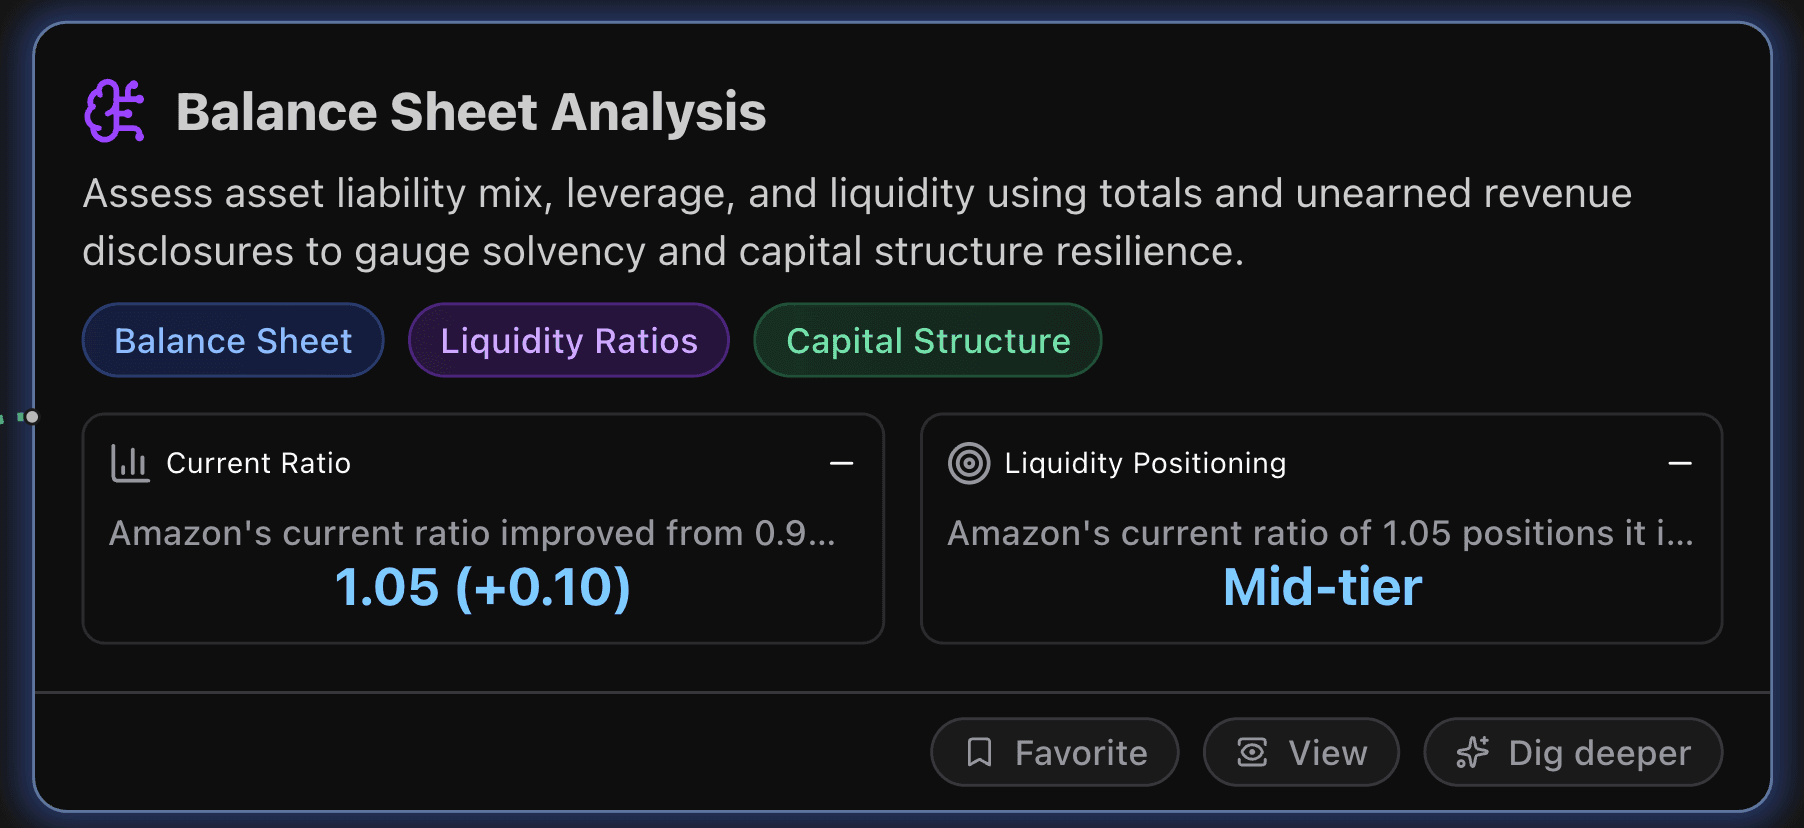
Balance Sheet Analysis
This section assesses asset liability mix, leverage, and liquidity using totals and unearned revenue disclosures to gauge solvency and capital structure resilience.
Key Metrics
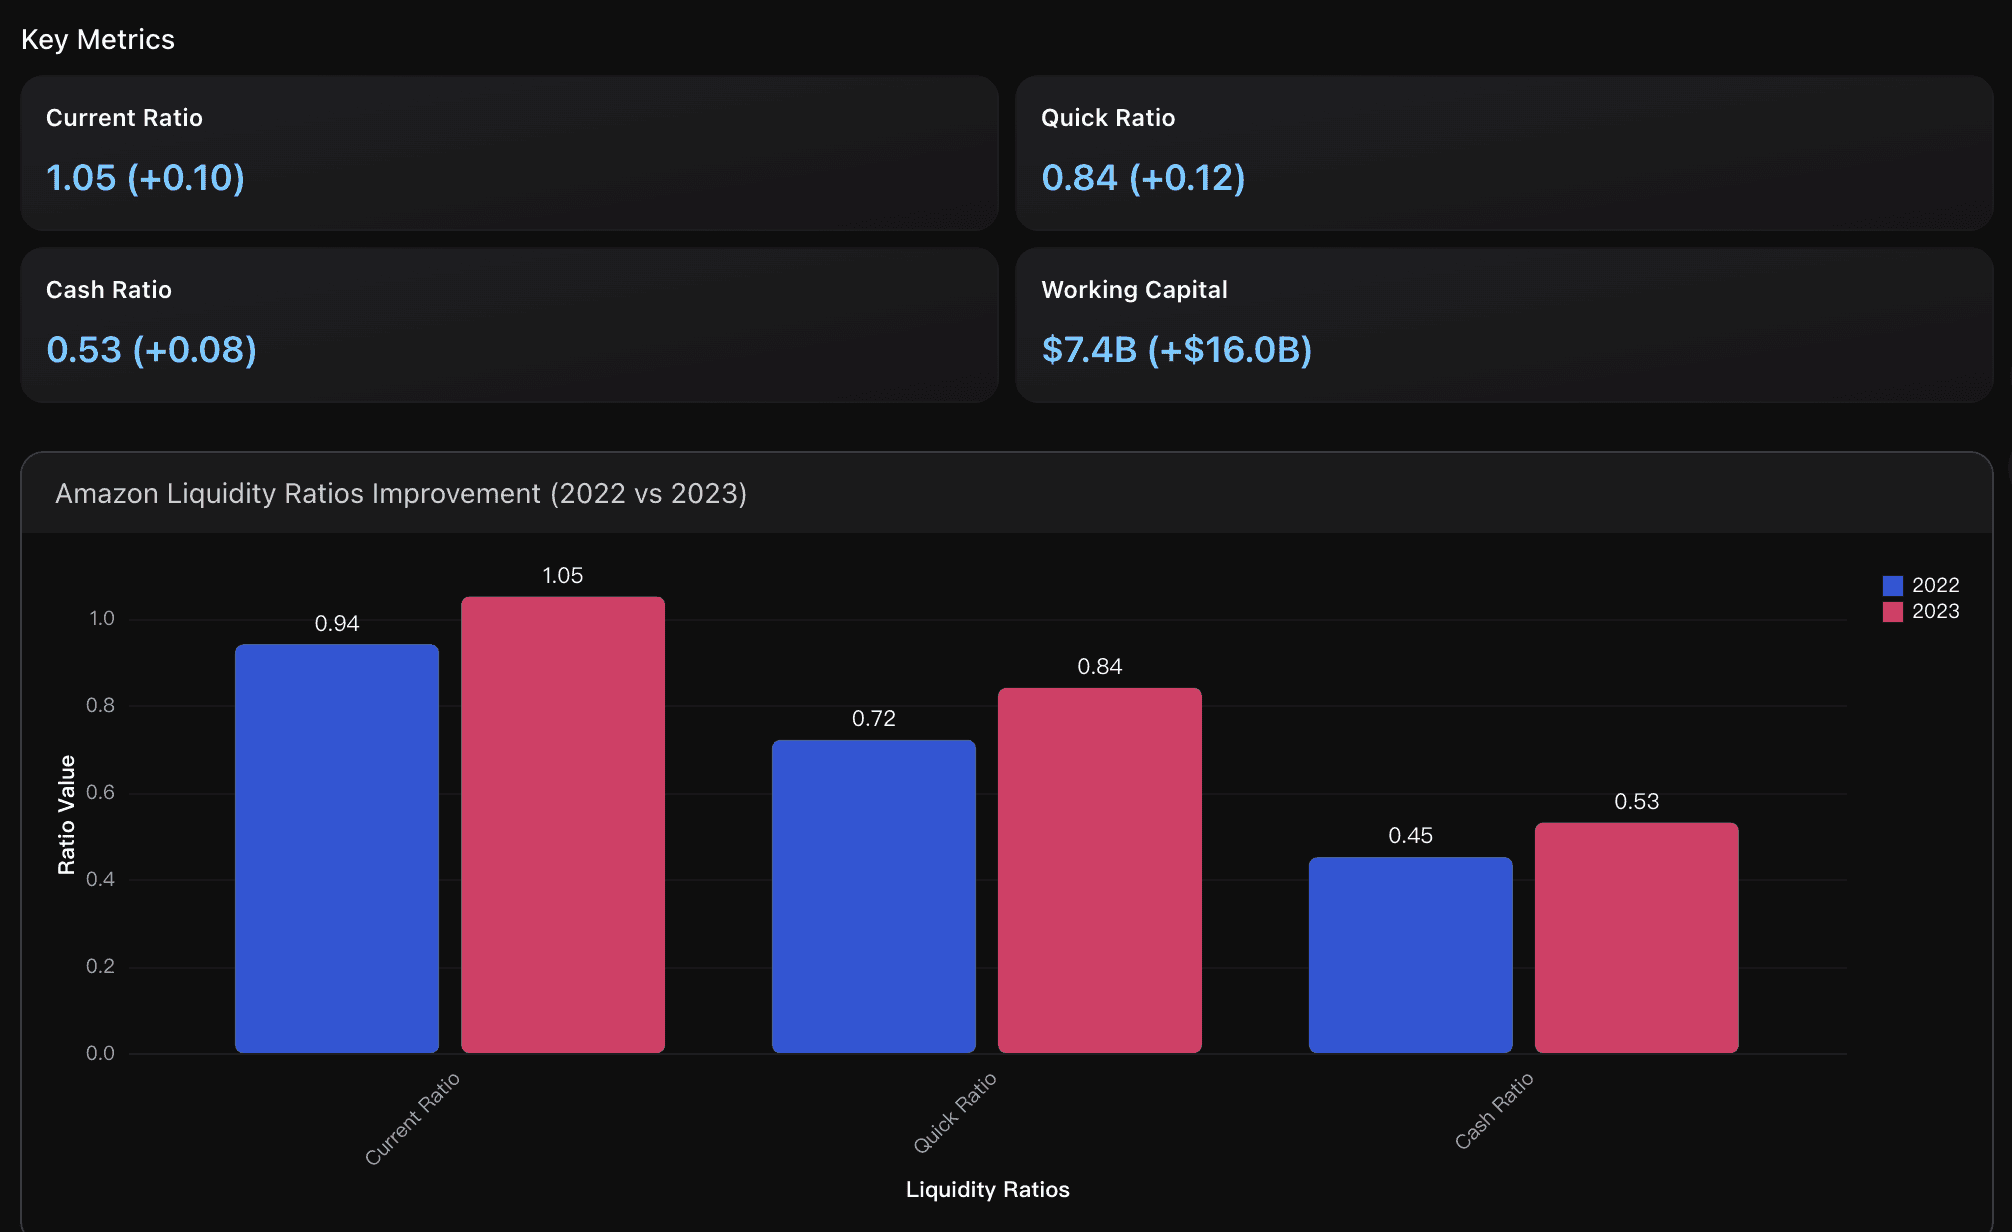
Current Ratio
Amazon's current ratio improved from 0.94 in 2022 to 1.05 in 2023, crossing above the critical 1.0 threshold. This indicates the company can now fully cover its short-term obligations with current assets, demonstrating enhanced liquidity positioning. The improvement reflects better working capital management and reduced liquidity risk compared to the previous year when current assets fell short of current liabilities.
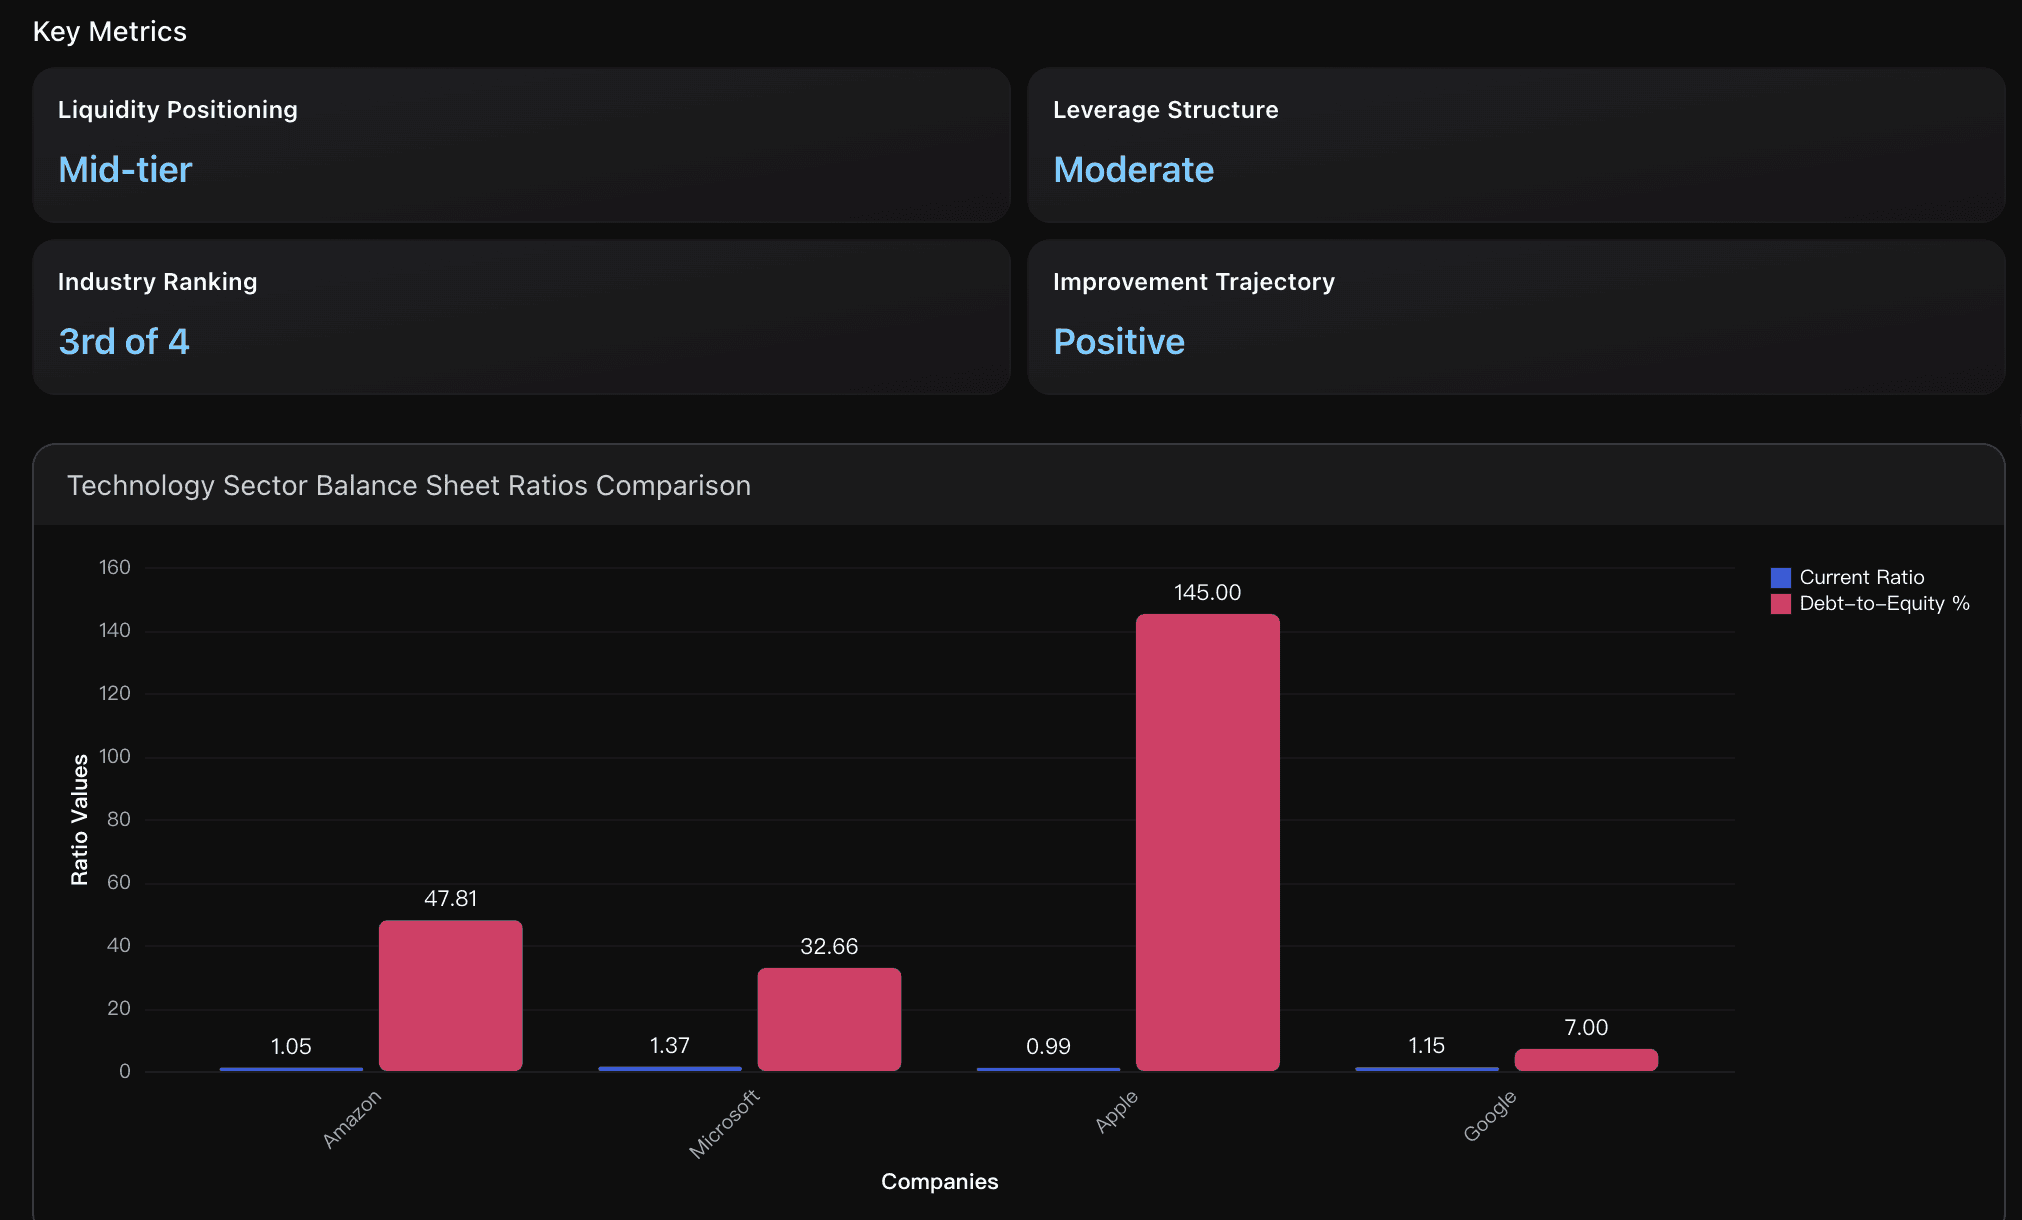
Liquidity Positioning
Amazon's current ratio of 1.05 positions it in the middle range among major technology competitors. Microsoft leads with 1.37, followed by Google at 1.15, Amazon at 1.05, and Apple at 0.99. While Amazon surpassed the critical 1.0 threshold in 2023, it still lags behind Microsoft and Google, indicating room for improvement in short-term liquidity management compared to sector leaders.
Actionable Insights
Focus on optimizing inventory management and receivables collection to further strengthen liquidity metrics. While Amazon's working capital improved dramatically to $7.4B positive in 2023, the quick ratio of 0.84 still indicates room for improvement in immediate liquidity. Implement dynamic inventory optimization algorithms and enhance supplier payment terms to push the quick ratio above the 1.0 benchmark. Additionally, leverage Amazon's strong $86.8B cash position strategically by investing in high-yield short-term securities while maintaining sufficient operational liquidity buffers to maximize returns on excess cash balances.
Focus on liquidity enhancement to match sector leaders like Microsoft ( 1.37 current ratio) and Google ( 1.15 ). Amazon's current 1.05 ratio, while above the critical 1.0 threshold, still trails competitors. Target increasing current ratio to 1.20-1.30 range through strategic cash management, optimizing inventory levels, and accelerating accounts receivable collection. Maintain the current moderate leverage approach, as the 47.81% debt-to-equity ratio provides operational flexibility while avoiding Apple's aggressive 145% leverage risk. Continue the positive trajectory that improved current ratio from 0.94 to 1.05 within one year.
Analysis Overview
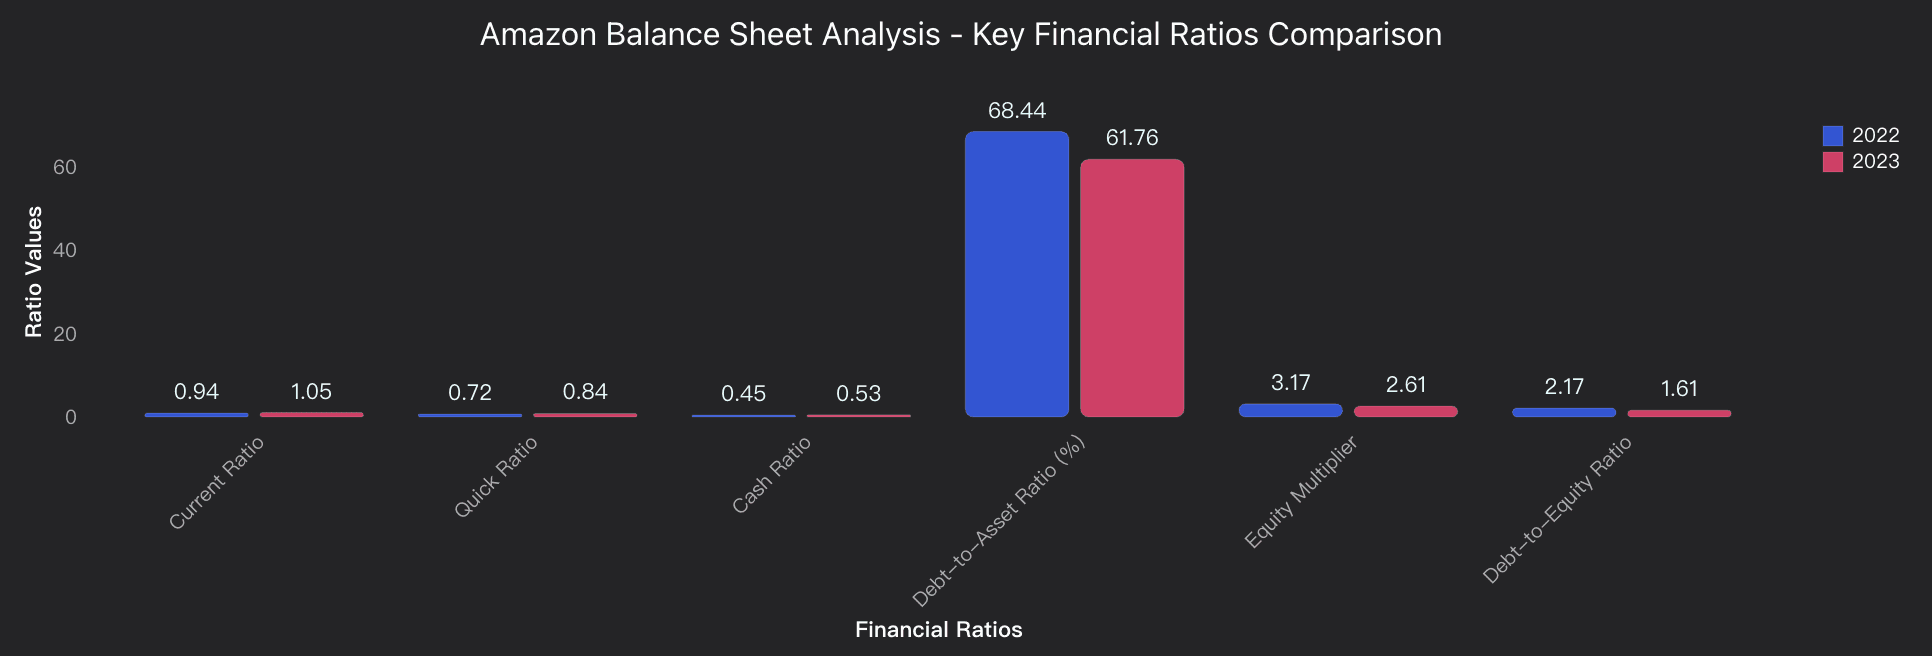
Amazon demonstrated significant balance sheet strengthening in 2023, with key improvements across liquidity and capital structure metrics. The company's current ratio improved from 0.94 to 1.05, surpassing the critical 1.0 threshold and indicating enhanced ability to meet short-term obligations. Working capital transformed from negative $8.6B to positive $7.4B, reflecting substantially improved short-term financial health. The quick ratio increased from 0.72 to 0.84 and cash ratio rose from 0.45 to 0.53, both signaling stronger liquidity positions, though remaining below the ideal 1.0 benchmark. Amazon's capital structure showed notable deleveraging with debt-to-asset ratio declining from 68.44% to 61.76% and debt-to-equity ratio dropping from 2.17 to 1.61, indicating reduced financial risk and a strategic shift toward equity-based financing. While Amazon's current ratio of 1.05 compares favorably to Apple's 0.87 and matches Microsoft's approximately 1.02, the company maintains moderate leverage compared to industry peers. The $38.2B increase in stockholders' equity to $201.9B demonstrates strong capital building and improved financial resilience for future growth investments.
Data Analysis
Liquidity Position Assessment
Evaluates Amazon's short-term financial health through current, quick, and cash ratios, plus working capital analysis, comparing 2023 vs 2022 performance to assess ability to meet immediate obligations.
Capital Structure and Leverage Analysis
Examines debt-to-asset, debt-to-equity, and equity multiplier ratios to analyze Amazon's capital structure transformation, financial leverage reduction, and shift toward equity-based financing strategy.
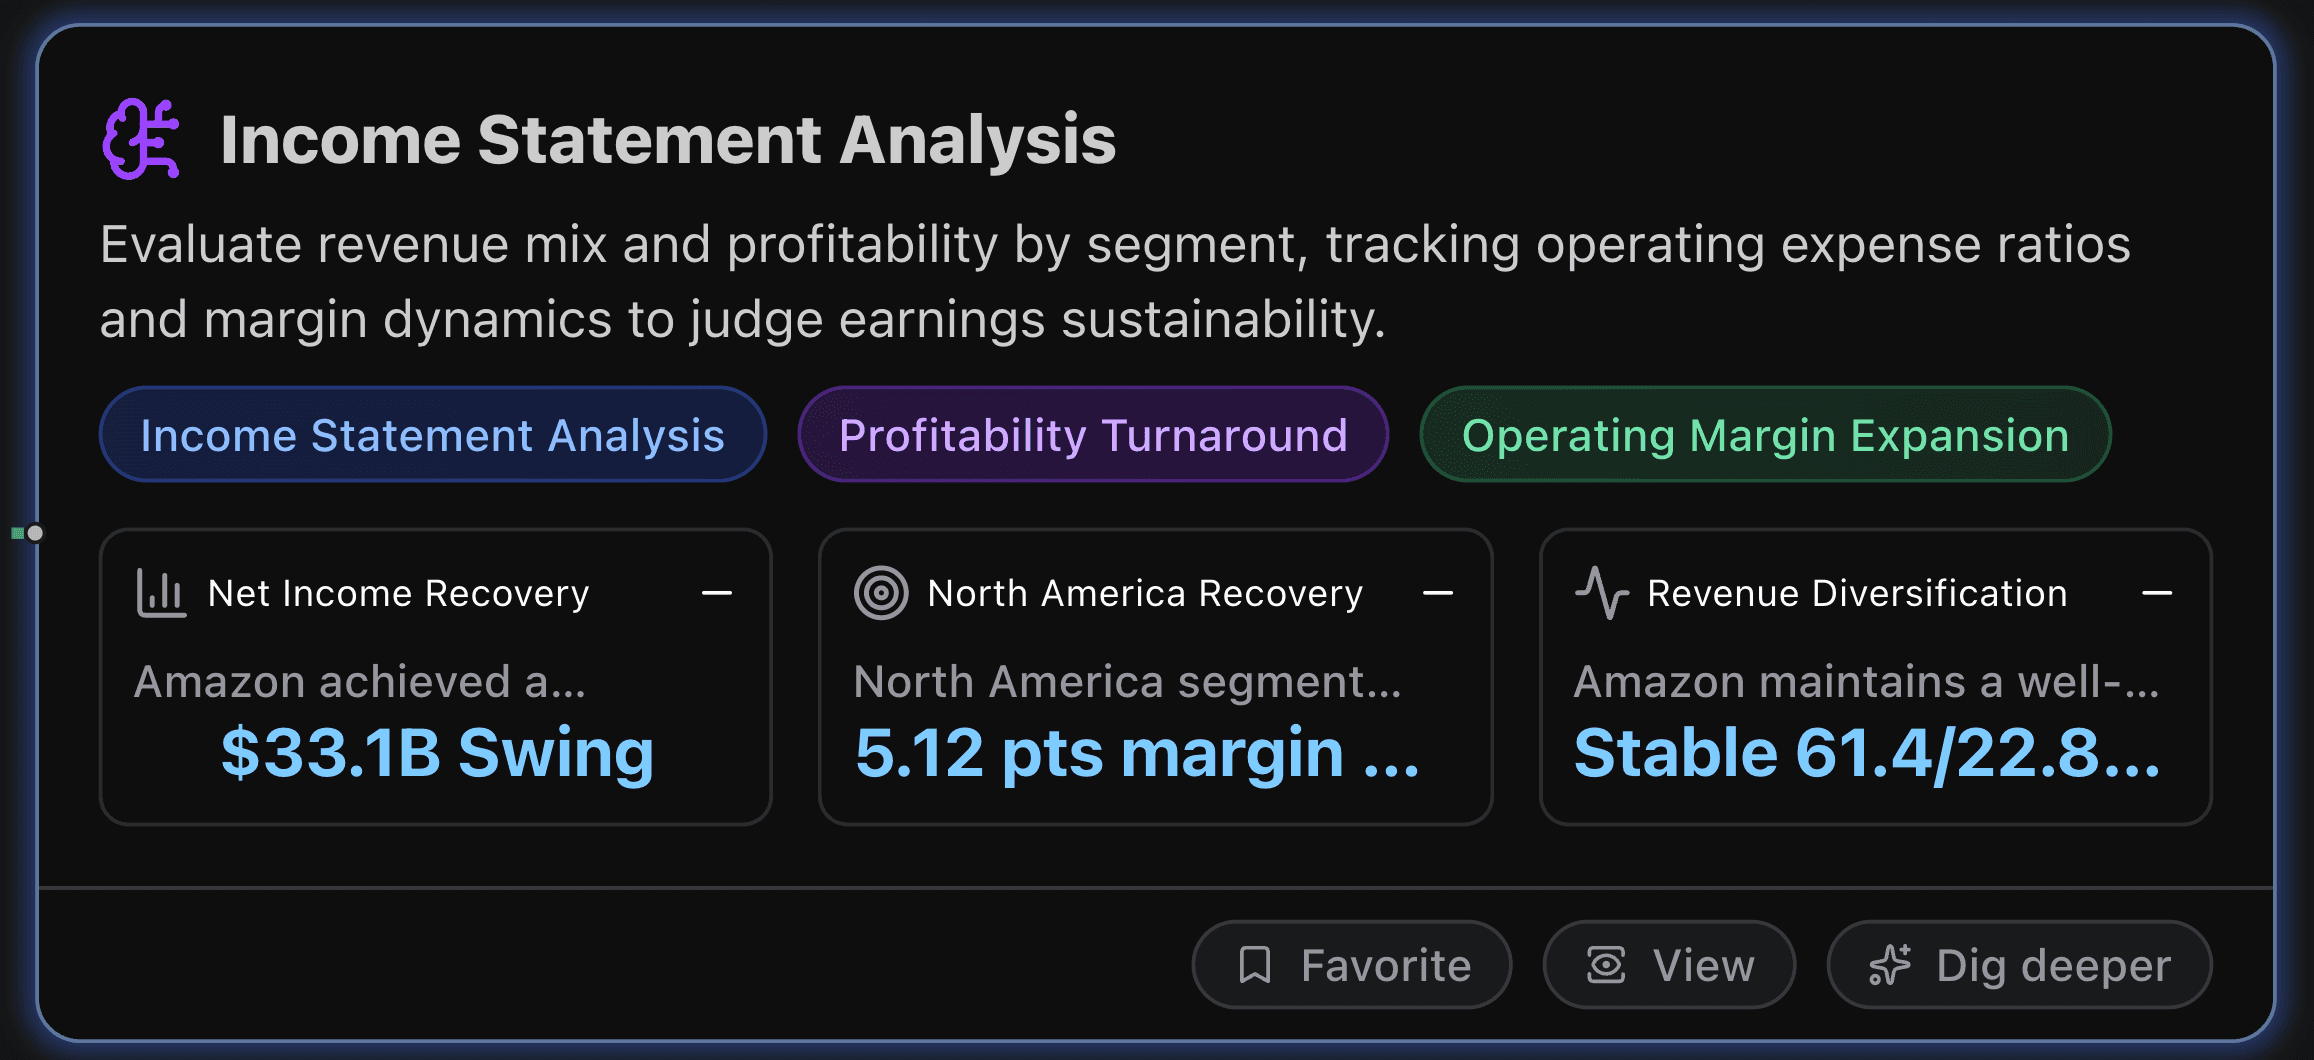
Income Statement Analysis
This section evaluates revenue mix and profitability by segment, tracking operating expense ratios and margin dynamics to judge earnings sustainability.
Key Metrics
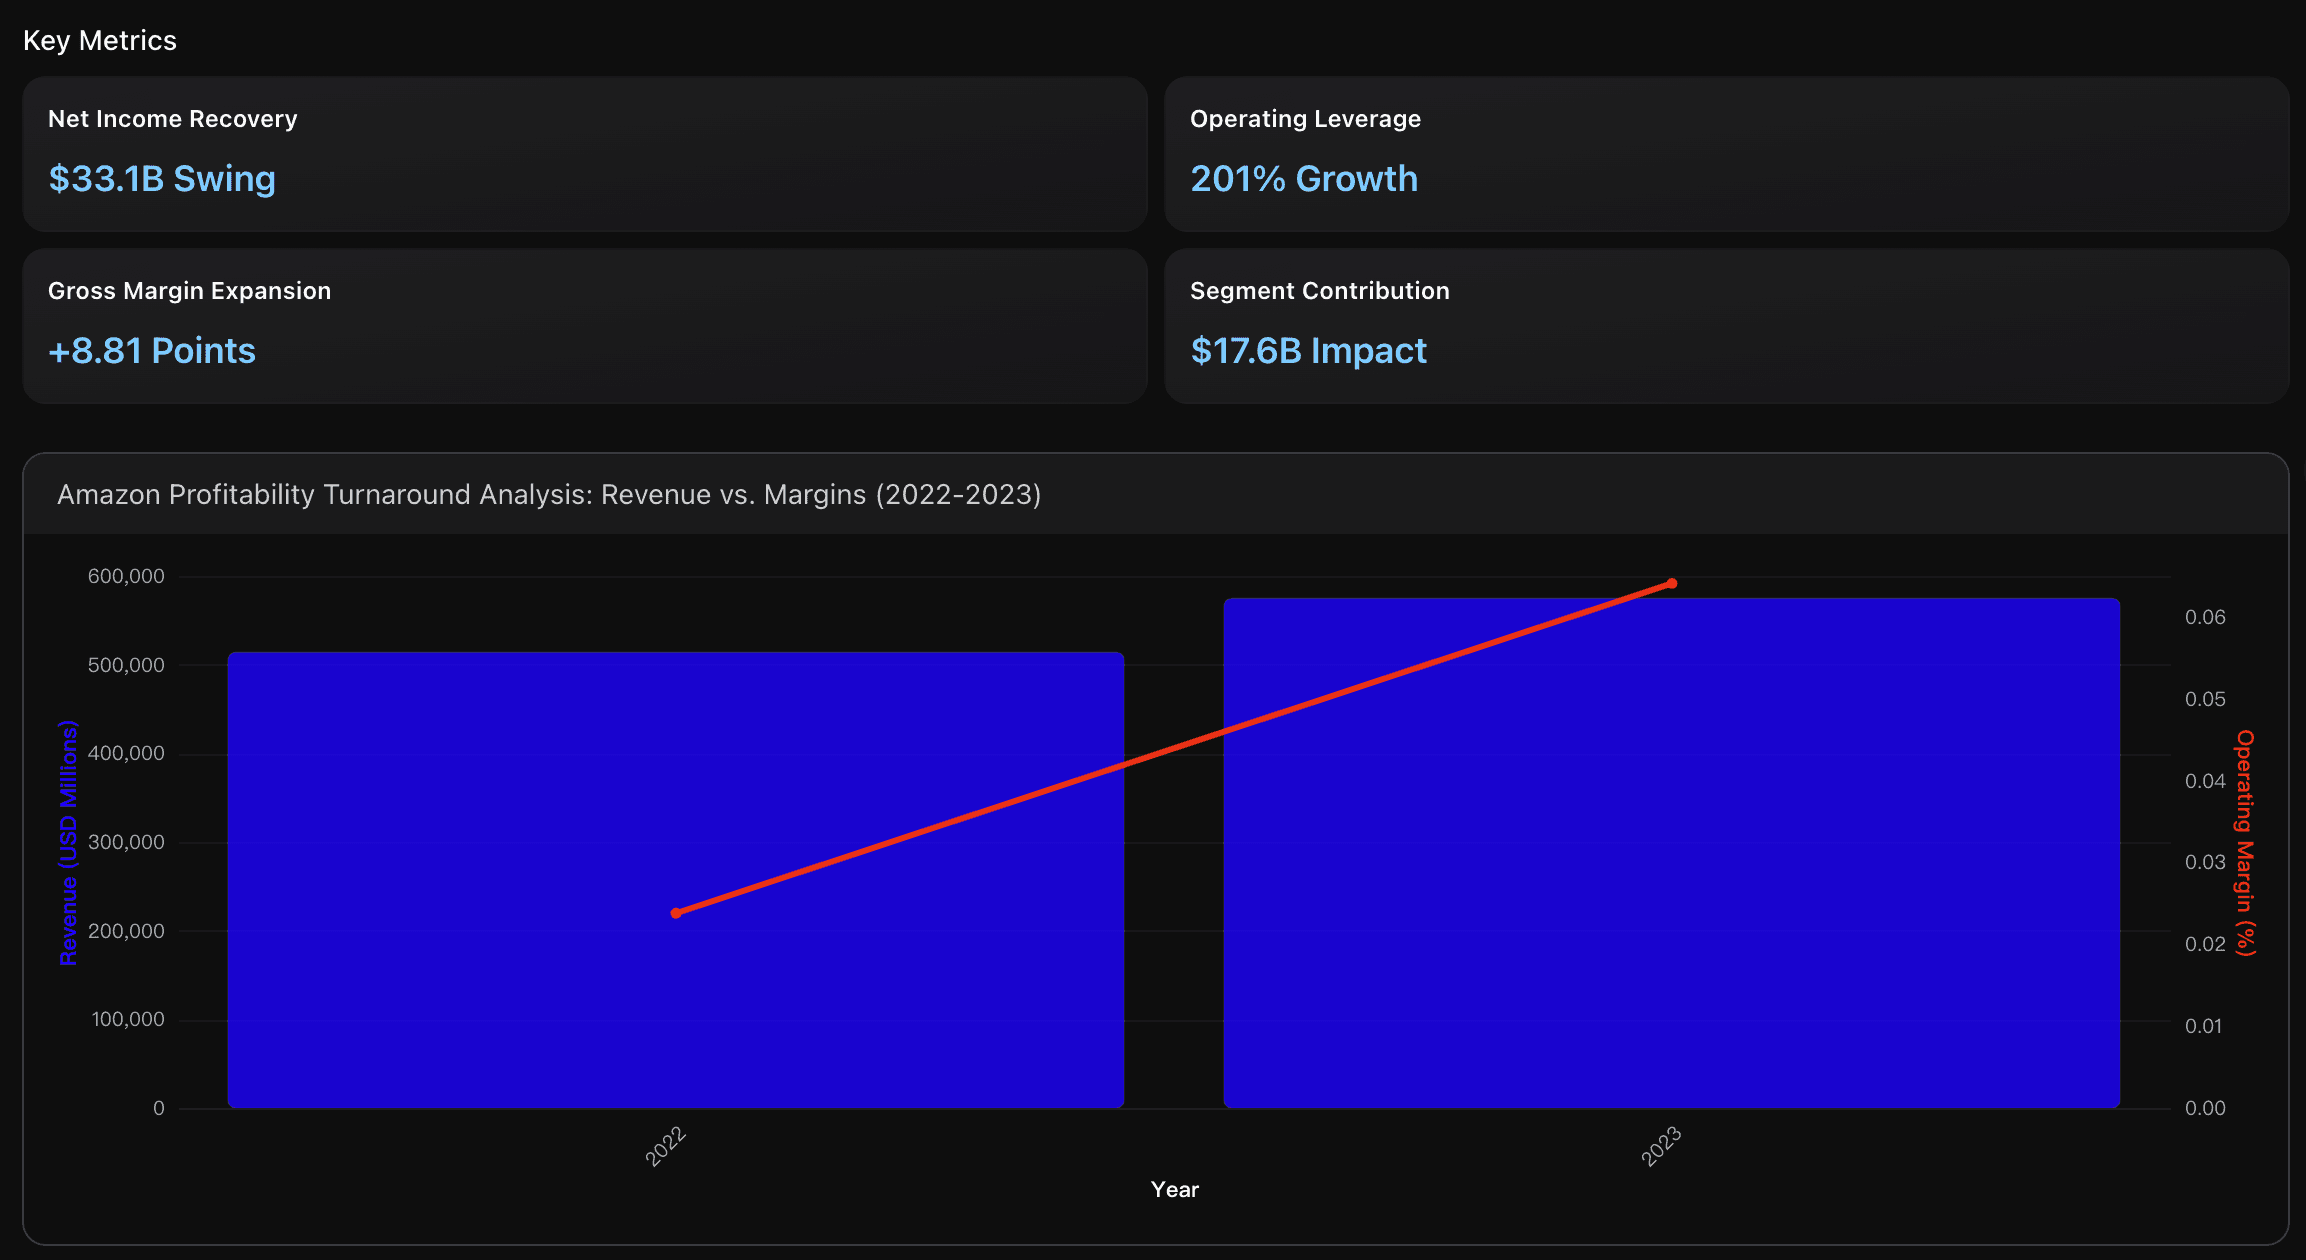
Net Income Recovery
Amazon achieved a dramatic financial turnaround, moving from a net loss of $2.7B in 2022 to a net income of $30.4B in 2023, representing a massive $33.1B positive swing. This 1,218% improvement demonstrates the company's successful operational restructuring and cost management initiatives, positioning Amazon significantly ahead of traditional retail competitors and matching profitability levels of leading technology companies.
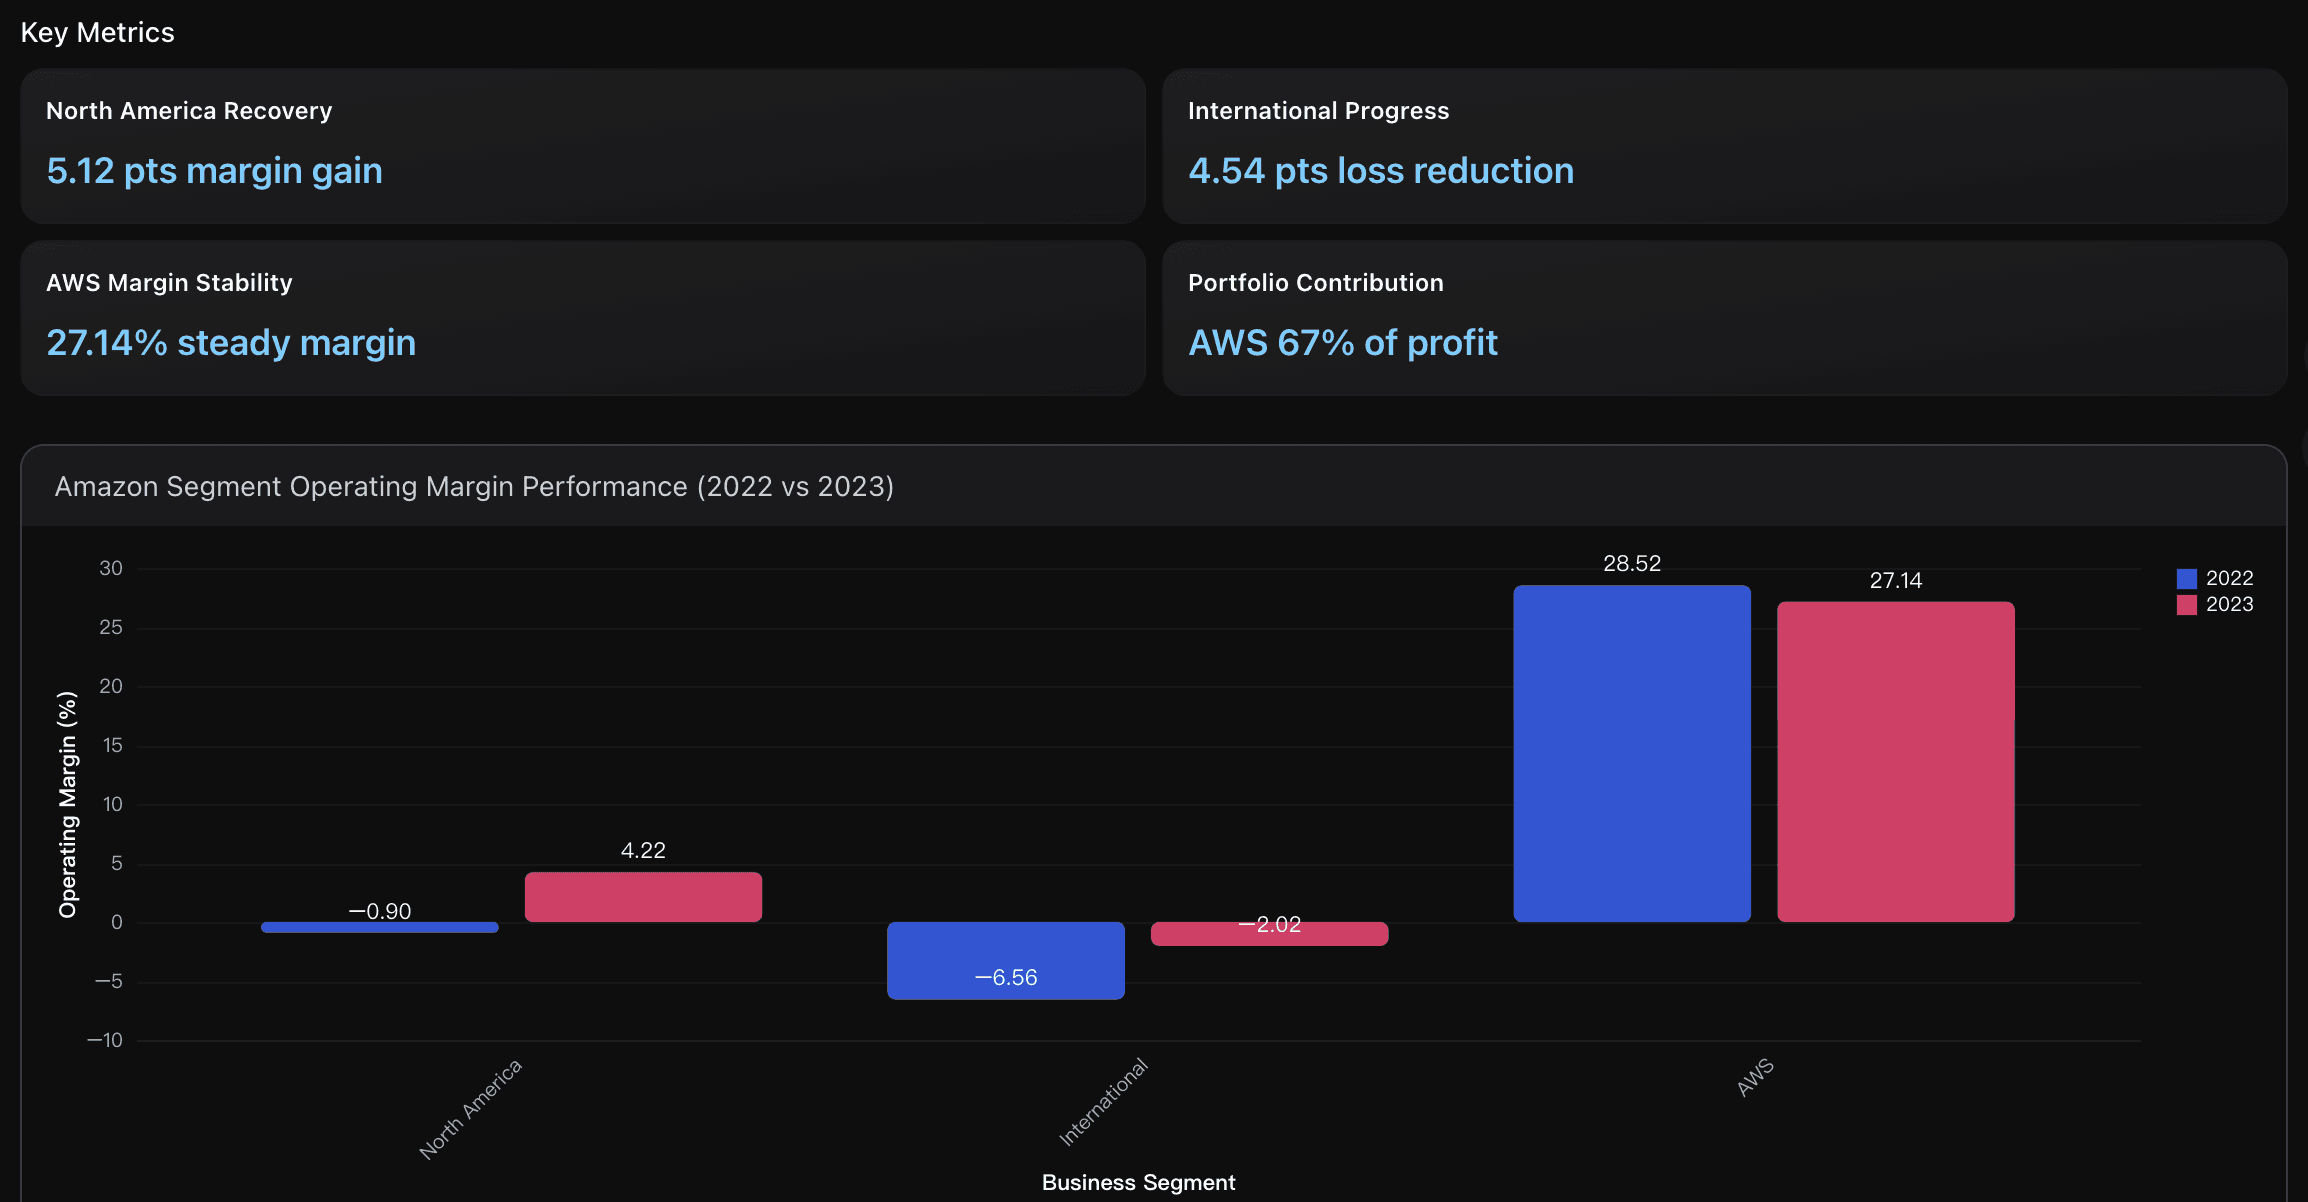
North America Recovery
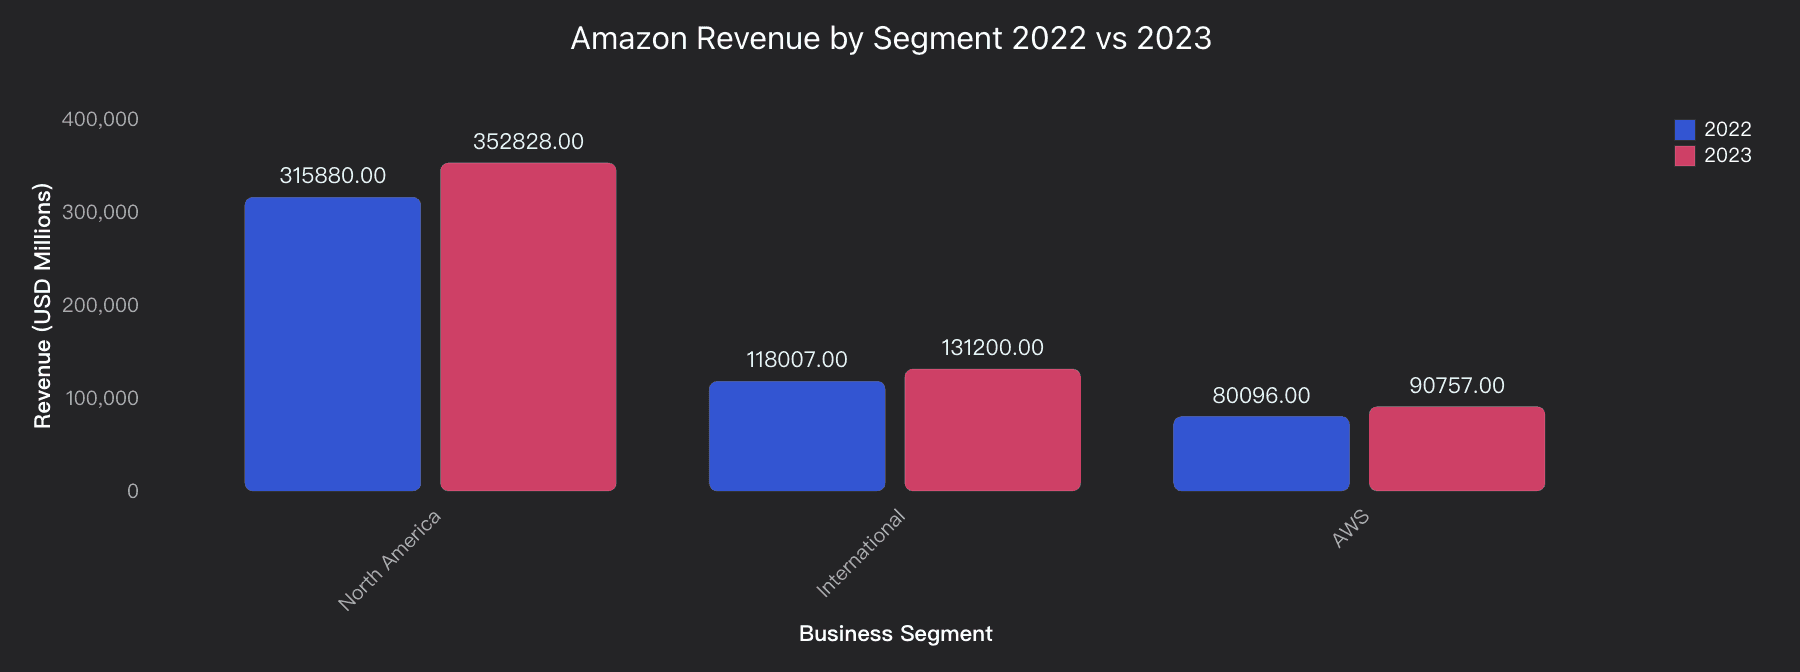
North America segment achieved a remarkable turnaround from operating loss of ($2.8B) with -0.90% margin in 2022 to operating income of $14.9B with 4.22% margin in 2023, representing a 5.12 percentage point improvement. This recovery was driven by revenue growth to $352.8B and enhanced operational efficiency, positioning the segment above typical retail industry margins of 2-3%
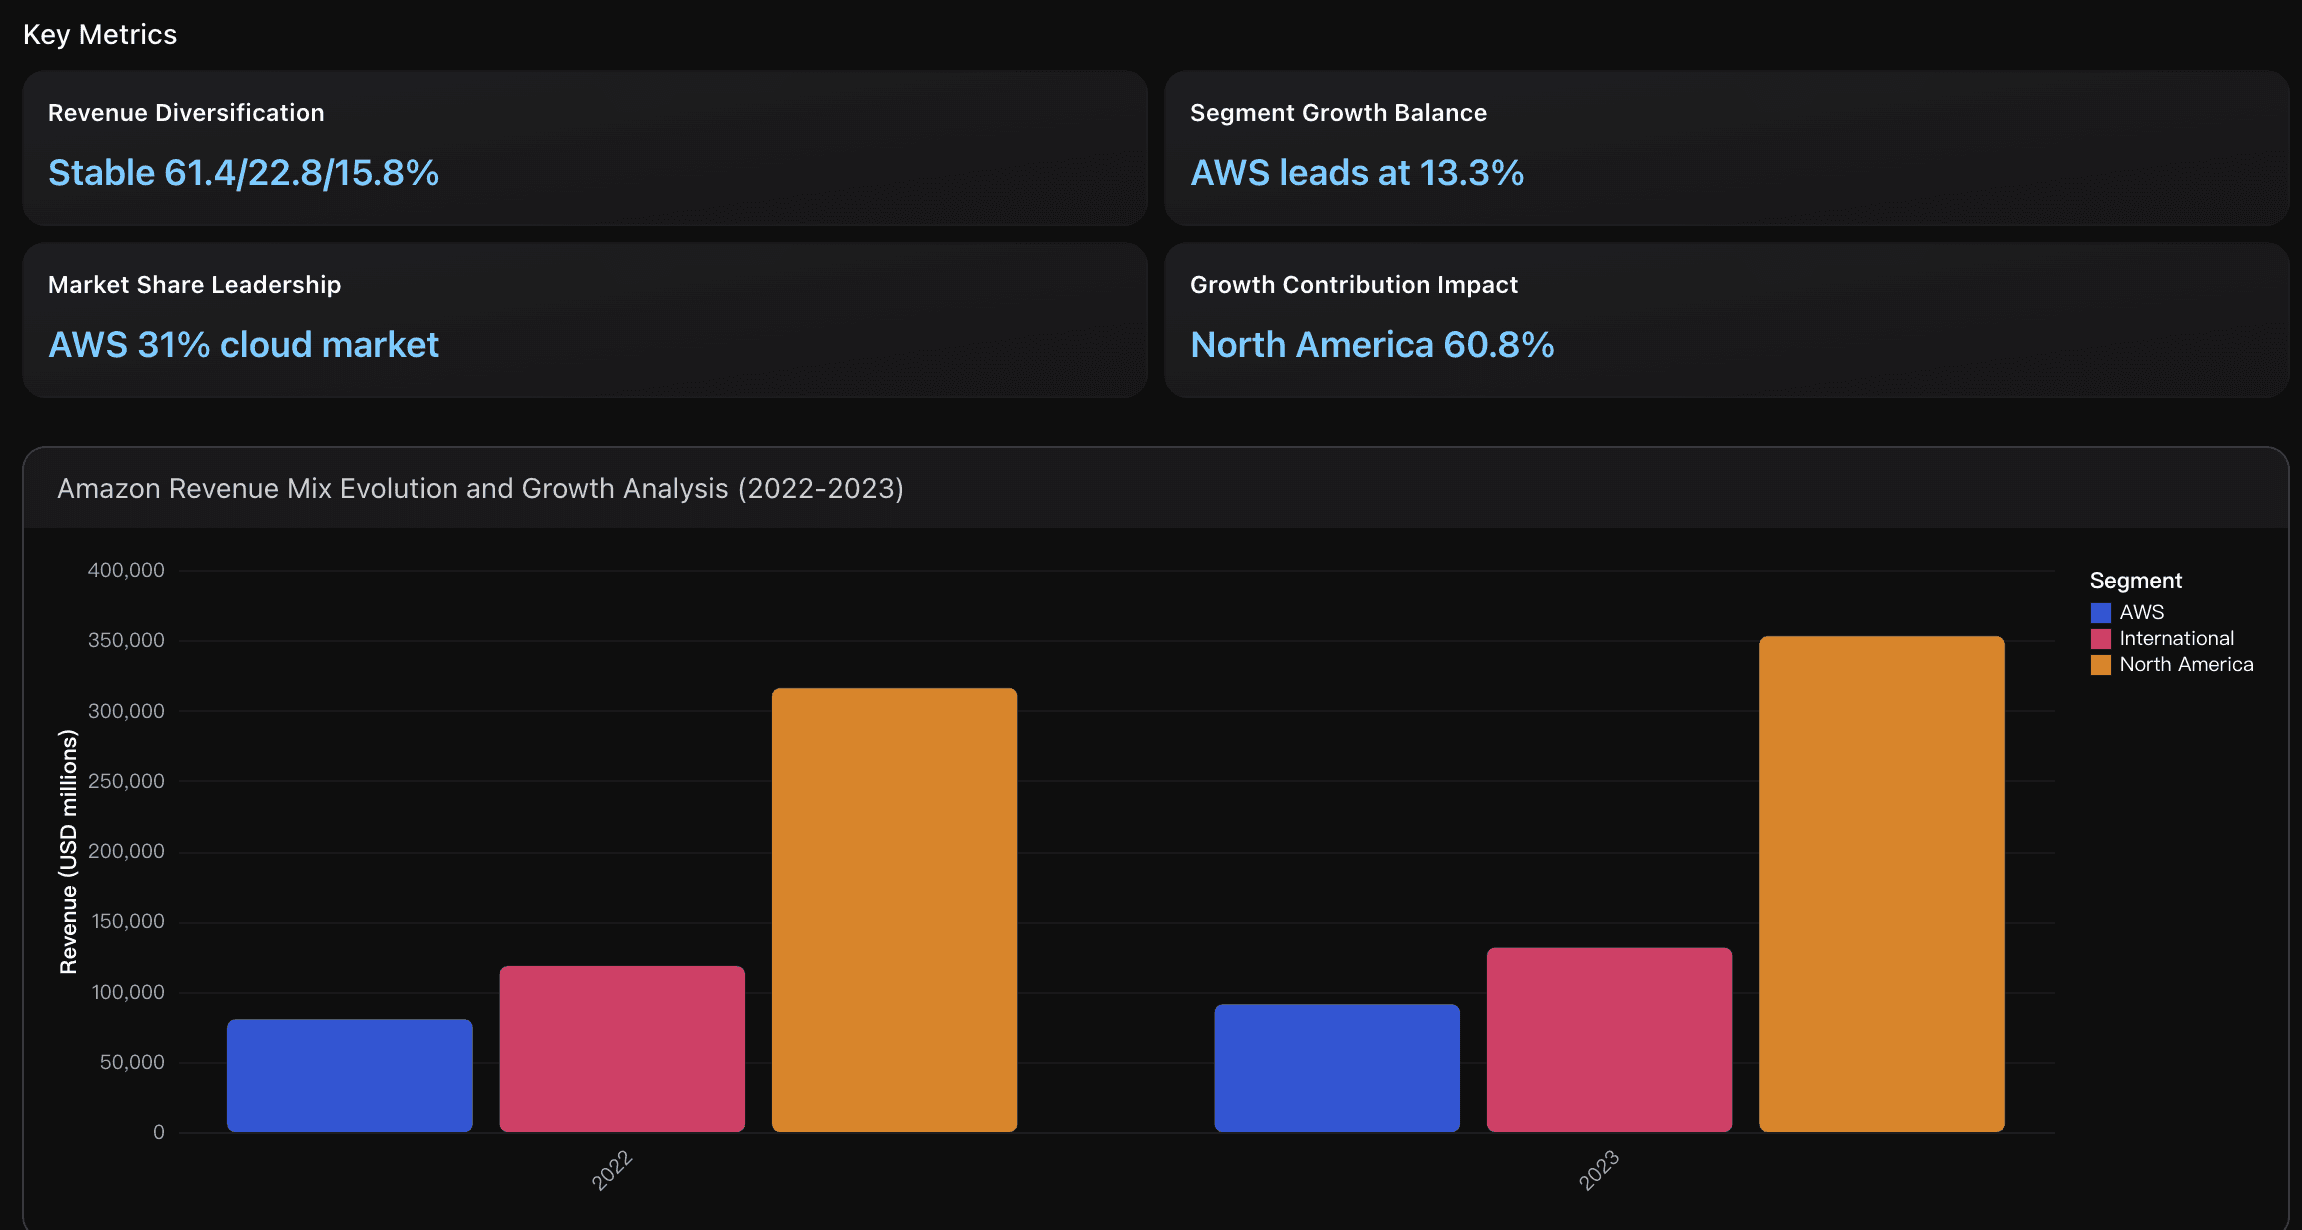
Revenue Diversification
Amazon maintains a well-balanced revenue portfolio with North America at 61.4%, International at 22.8%, and AWS at 15.8% in 2023. Despite AWS being the smallest segment by revenue, it demonstrates strategic importance with the highest growth rate at 13.3% versus 11.7% for North America and 11.2% for International. This diversification provides resilience against regional economic fluctuations while positioning for cloud-driven future growth.
Actionable Insights
Focus on sustaining the momentum of this profitability turnaround by prioritizing operational efficiency initiatives that demonstrated success in 2023. The $33.1B net income swing and +4.03 percentage points operating margin expansion indicate Amazon has found the right balance between growth investment and cost discipline. Specifically, continue optimizing fulfillment networks and technology infrastructure that contributed to the +8.81 percentage points gross margin improvement. Given the $17.6B contribution from North America's recovery alone, replicate these operational improvements in the International segment to further reduce the $2.7B operating loss. Maintain AWS's 27.14% operating margins while scaling capacity to support enterprise AI demand, ensuring this high-margin business continues anchoring overall profitability during the next growth phase.
Focus on accelerating International segment profitability by replicating North America's operational excellence playbook. The International segment's improvement from -6.56% to -2.02% margin demonstrates strong momentum, but achieving breakeven should be prioritized through enhanced fulfillment efficiency and advertising revenue growth. Additionally, maintain AWS's competitive moat by balancing infrastructure investments with margin preservation, ensuring the 27.14% margin remains above the 20-25% industry average as competition intensifies from Microsoft Azure and Google Cloud.
Focus on AWS acceleration and international optimization. While North America remains the revenue foundation at $352.8B (61.4% of total), AWS's 13.3% growth rate and 31% cloud market leadership position it as the key profitability driver. Prioritize AWS capacity expansion and AI service development to maintain competitive advantage over Microsoft Azure. Simultaneously, optimize International operations which improved from -6.56% to -2.02% operating margin, targeting break-even through better cost management and localized service offerings. This dual strategy leverages Amazon's diversified revenue base while maximizing returns from the highest-growth, highest-margin AWS segment that contributed 17.5% of total company growth despite being only 15.8% of revenue.
Analysis Overview
Amazon demonstrated exceptional financial performance in 2023, achieving one of the most dramatic profitability turnarounds in corporate history. The company's net profit margin rebounded from -0.53% ( -$2.72B loss ) in 2022 to 5.29% ( $30.43B profit ) in 2023, representing a 1,217.74% improvement. Operating margin more than doubled from 2.38% to 6.41% , while gross margin expanded significantly from 43.81% to 52.62% . The North America segment achieved remarkable recovery, swinging from -0.90% operating margin ( -$2.85B loss ) to 4.22% margin ( $14.88B profit ). International segment losses narrowed substantially from -6.56% to -2.02% , while AWS maintained strong 27.14% margins ( $24.63B profit ), continuing to serve as Amazon's primary profit engine. Revenue grew 11.83% to $574.79B with balanced growth across all segments. This transformation reflects successful cost control, operational leverage, and scale benefits positioning Amazon competitively against both traditional retailers and technology peers.
Data Analysis
Profitability Turnaround Analysis
Comprehensive analysis of Amazon's dramatic profitability recovery from 2022 to 2023, examining operating leverage, margin expansion across segments, and the transition from net loss to substantial net income driven by operational efficiency improvements.
Segment Operating Performance
Detailed evaluation of operating margins and profitability trends across Amazon's three core business segments, highlighting North America's recovery, International's loss reduction, and AWS's continued dominance in driving overall company profitability.
Revenue Mix and Growth Dynamics
Analysis of revenue composition and growth patterns across geographic and business segments, examining how sustainable growth trajectory in both retail and cloud computing businesses.
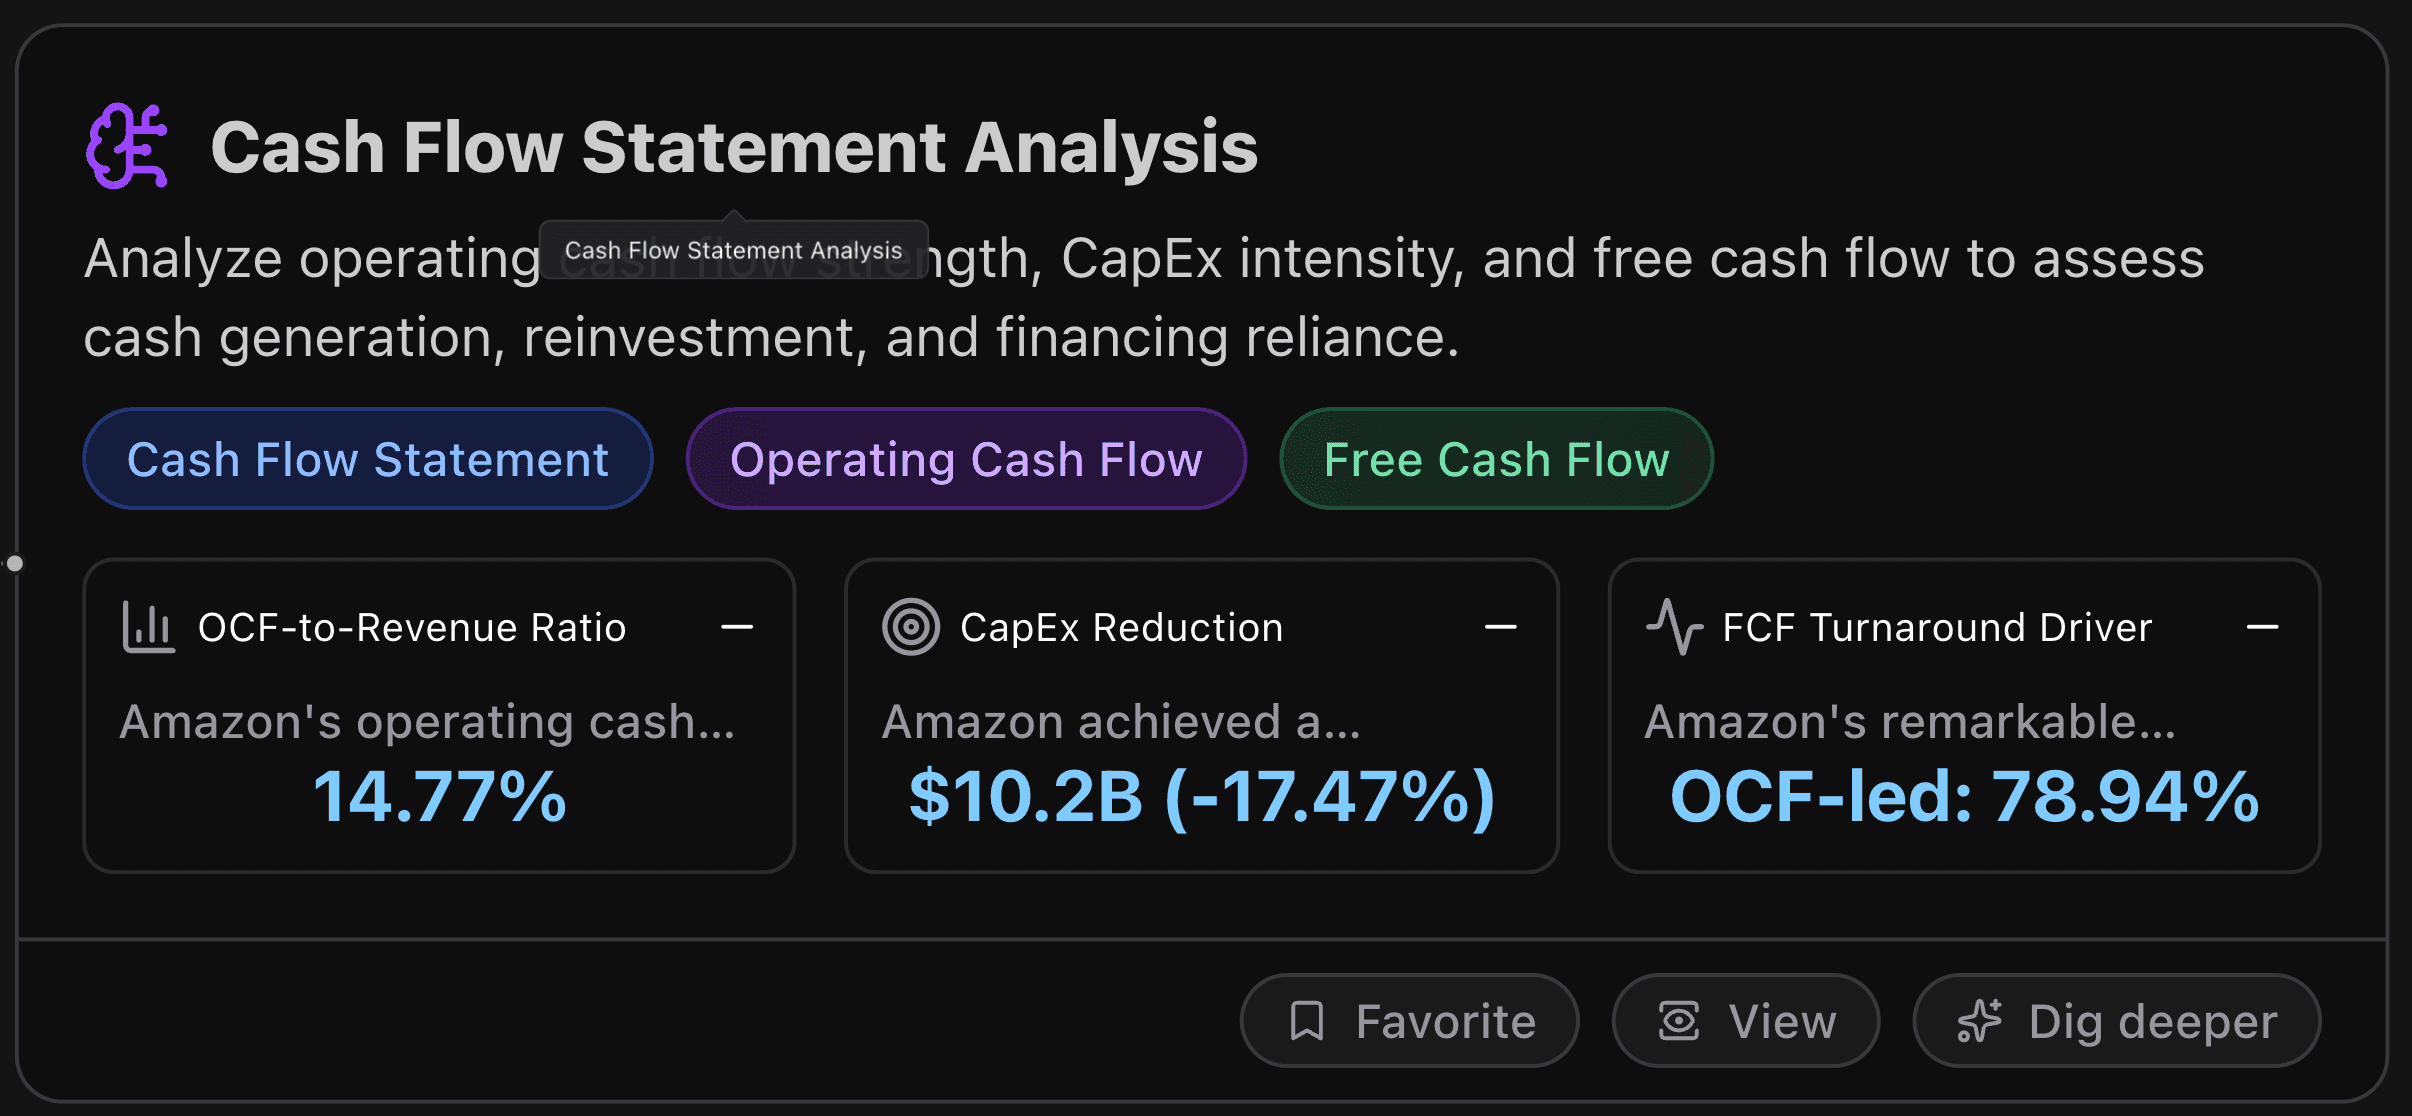
Cash Flow Statement Analysis
This section analyzes operating cash flow strength, CapEx intensity, and free cash flow to assess cash generation, reinvestment, and financing reliance.
Key Metrics
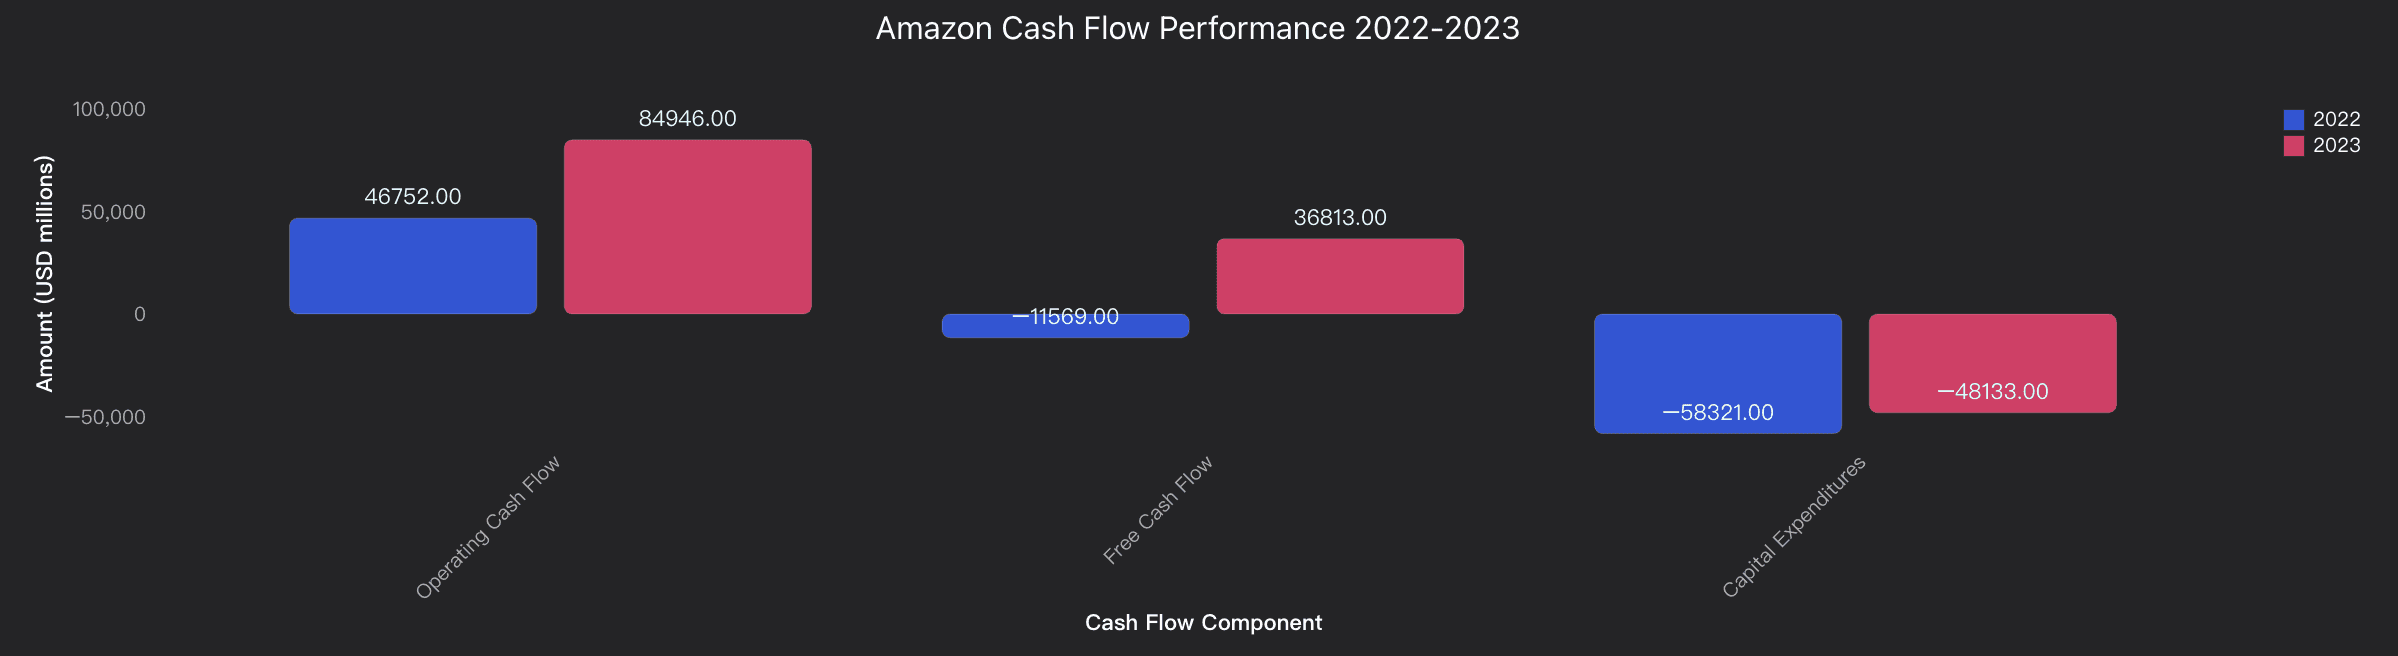
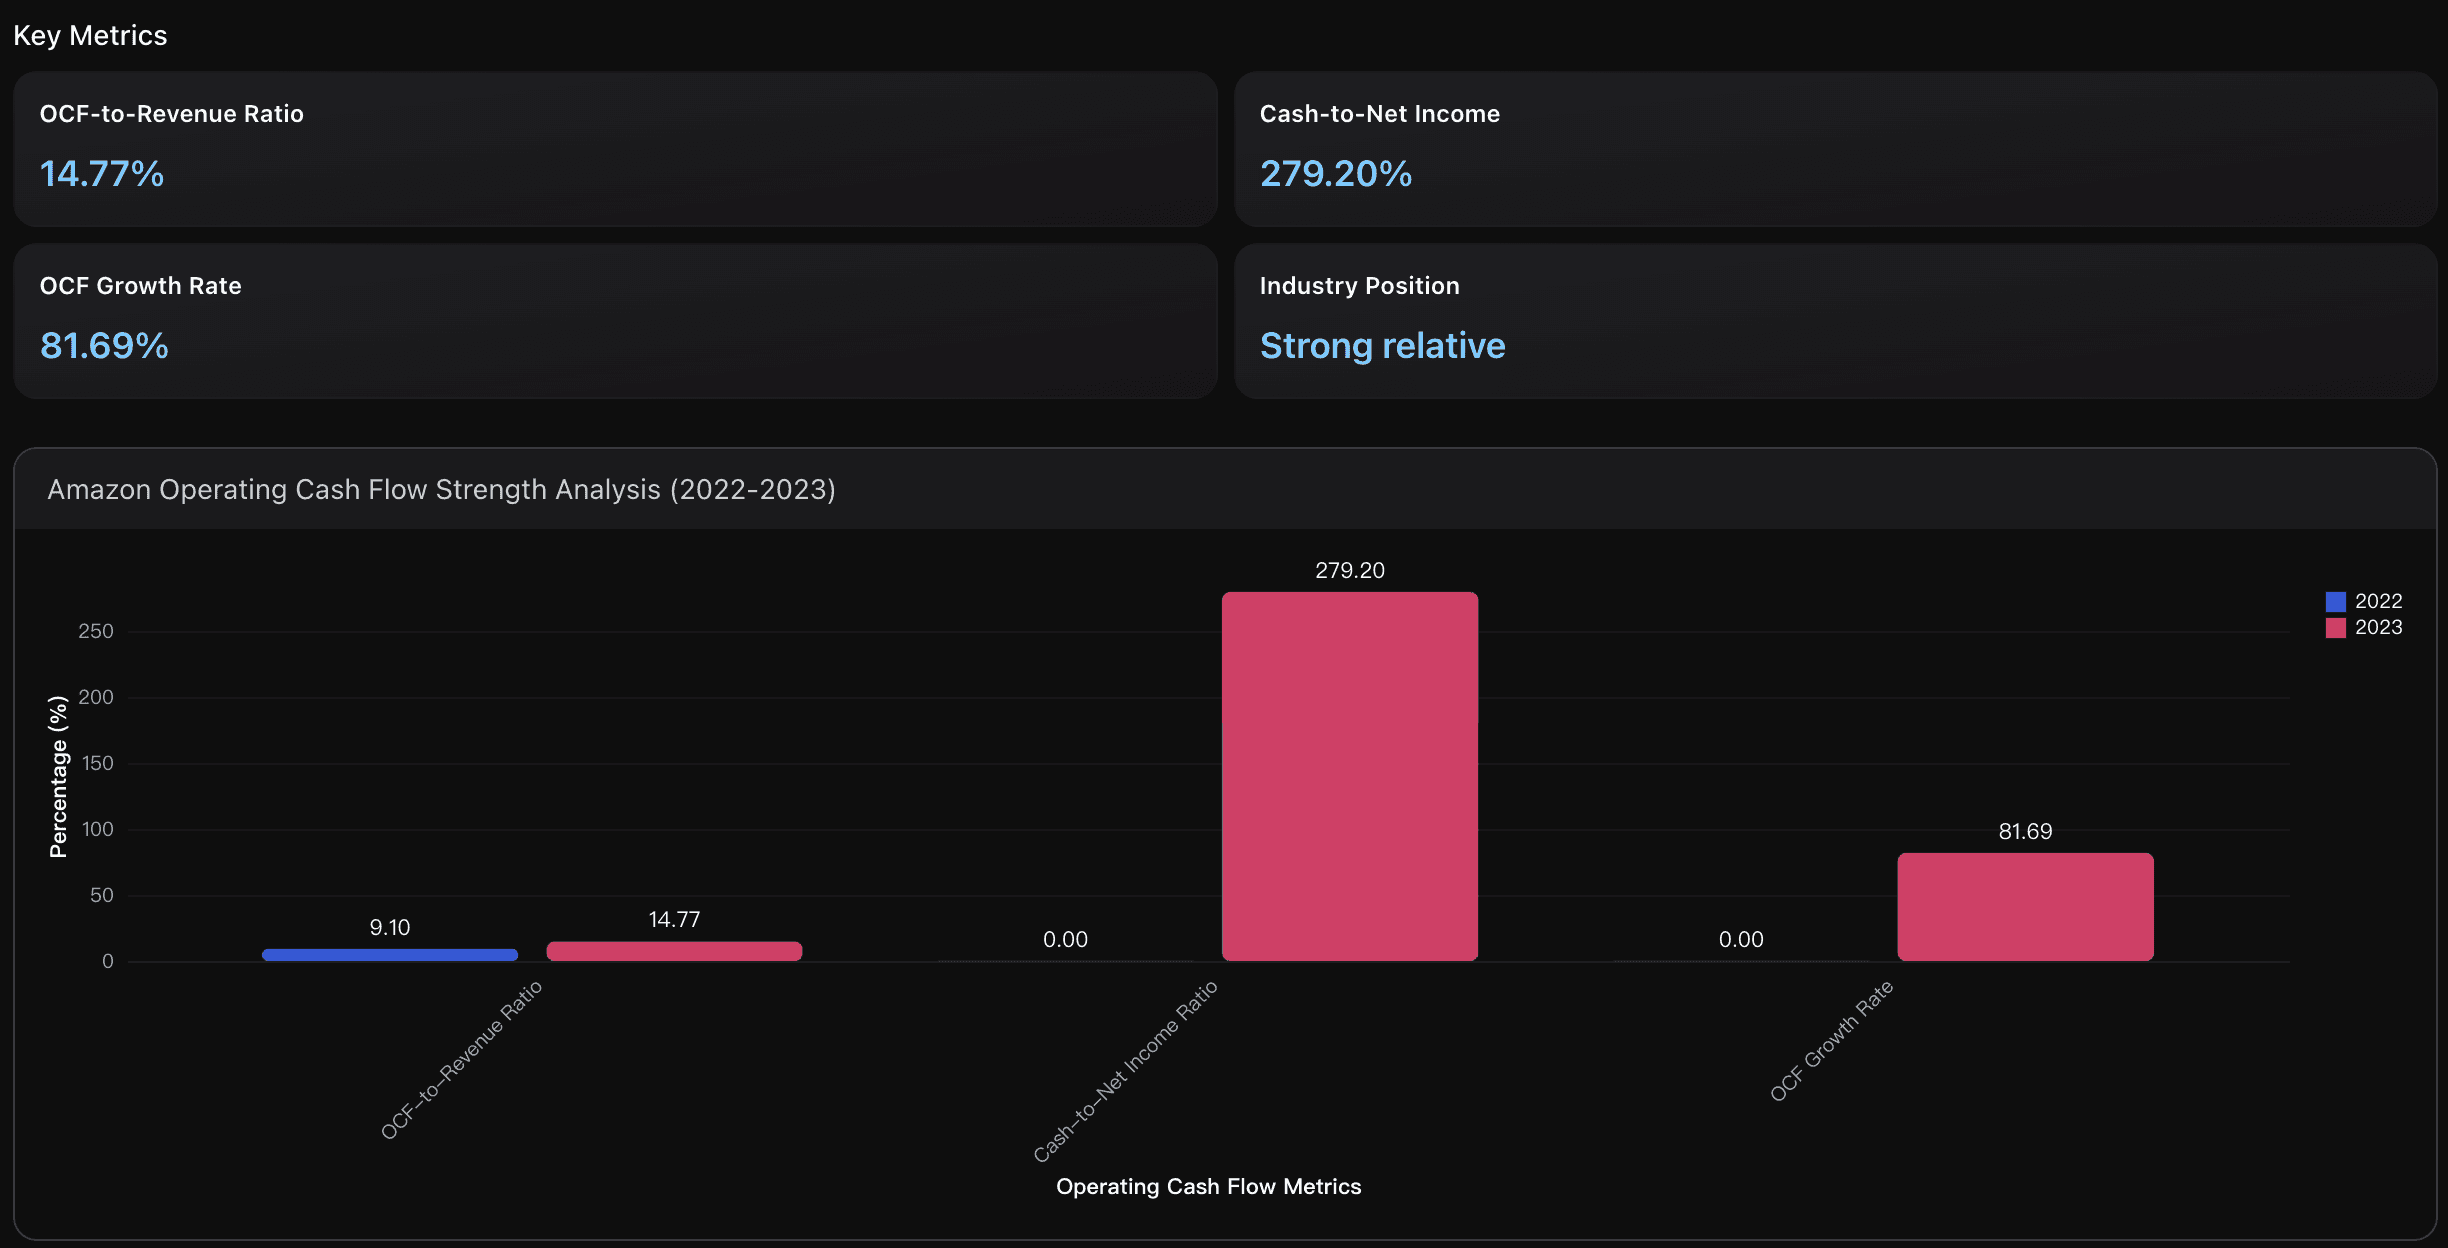
OCF-to-Revenue Ratio
Amazon's operating cash flow margin improved dramatically from 9.10% in 2022 to 14.77% in 2023, representing a 5.67 percentage point increase. This 14.77% ratio significantly outperforms historical levels and demonstrates strong operational efficiency. Compared to industry benchmarks, Amazon's OCF margin approached the technology sector's upper quartile performance, though still trailing high-margin software companies like Meta (60%) and cloud-focused peers.
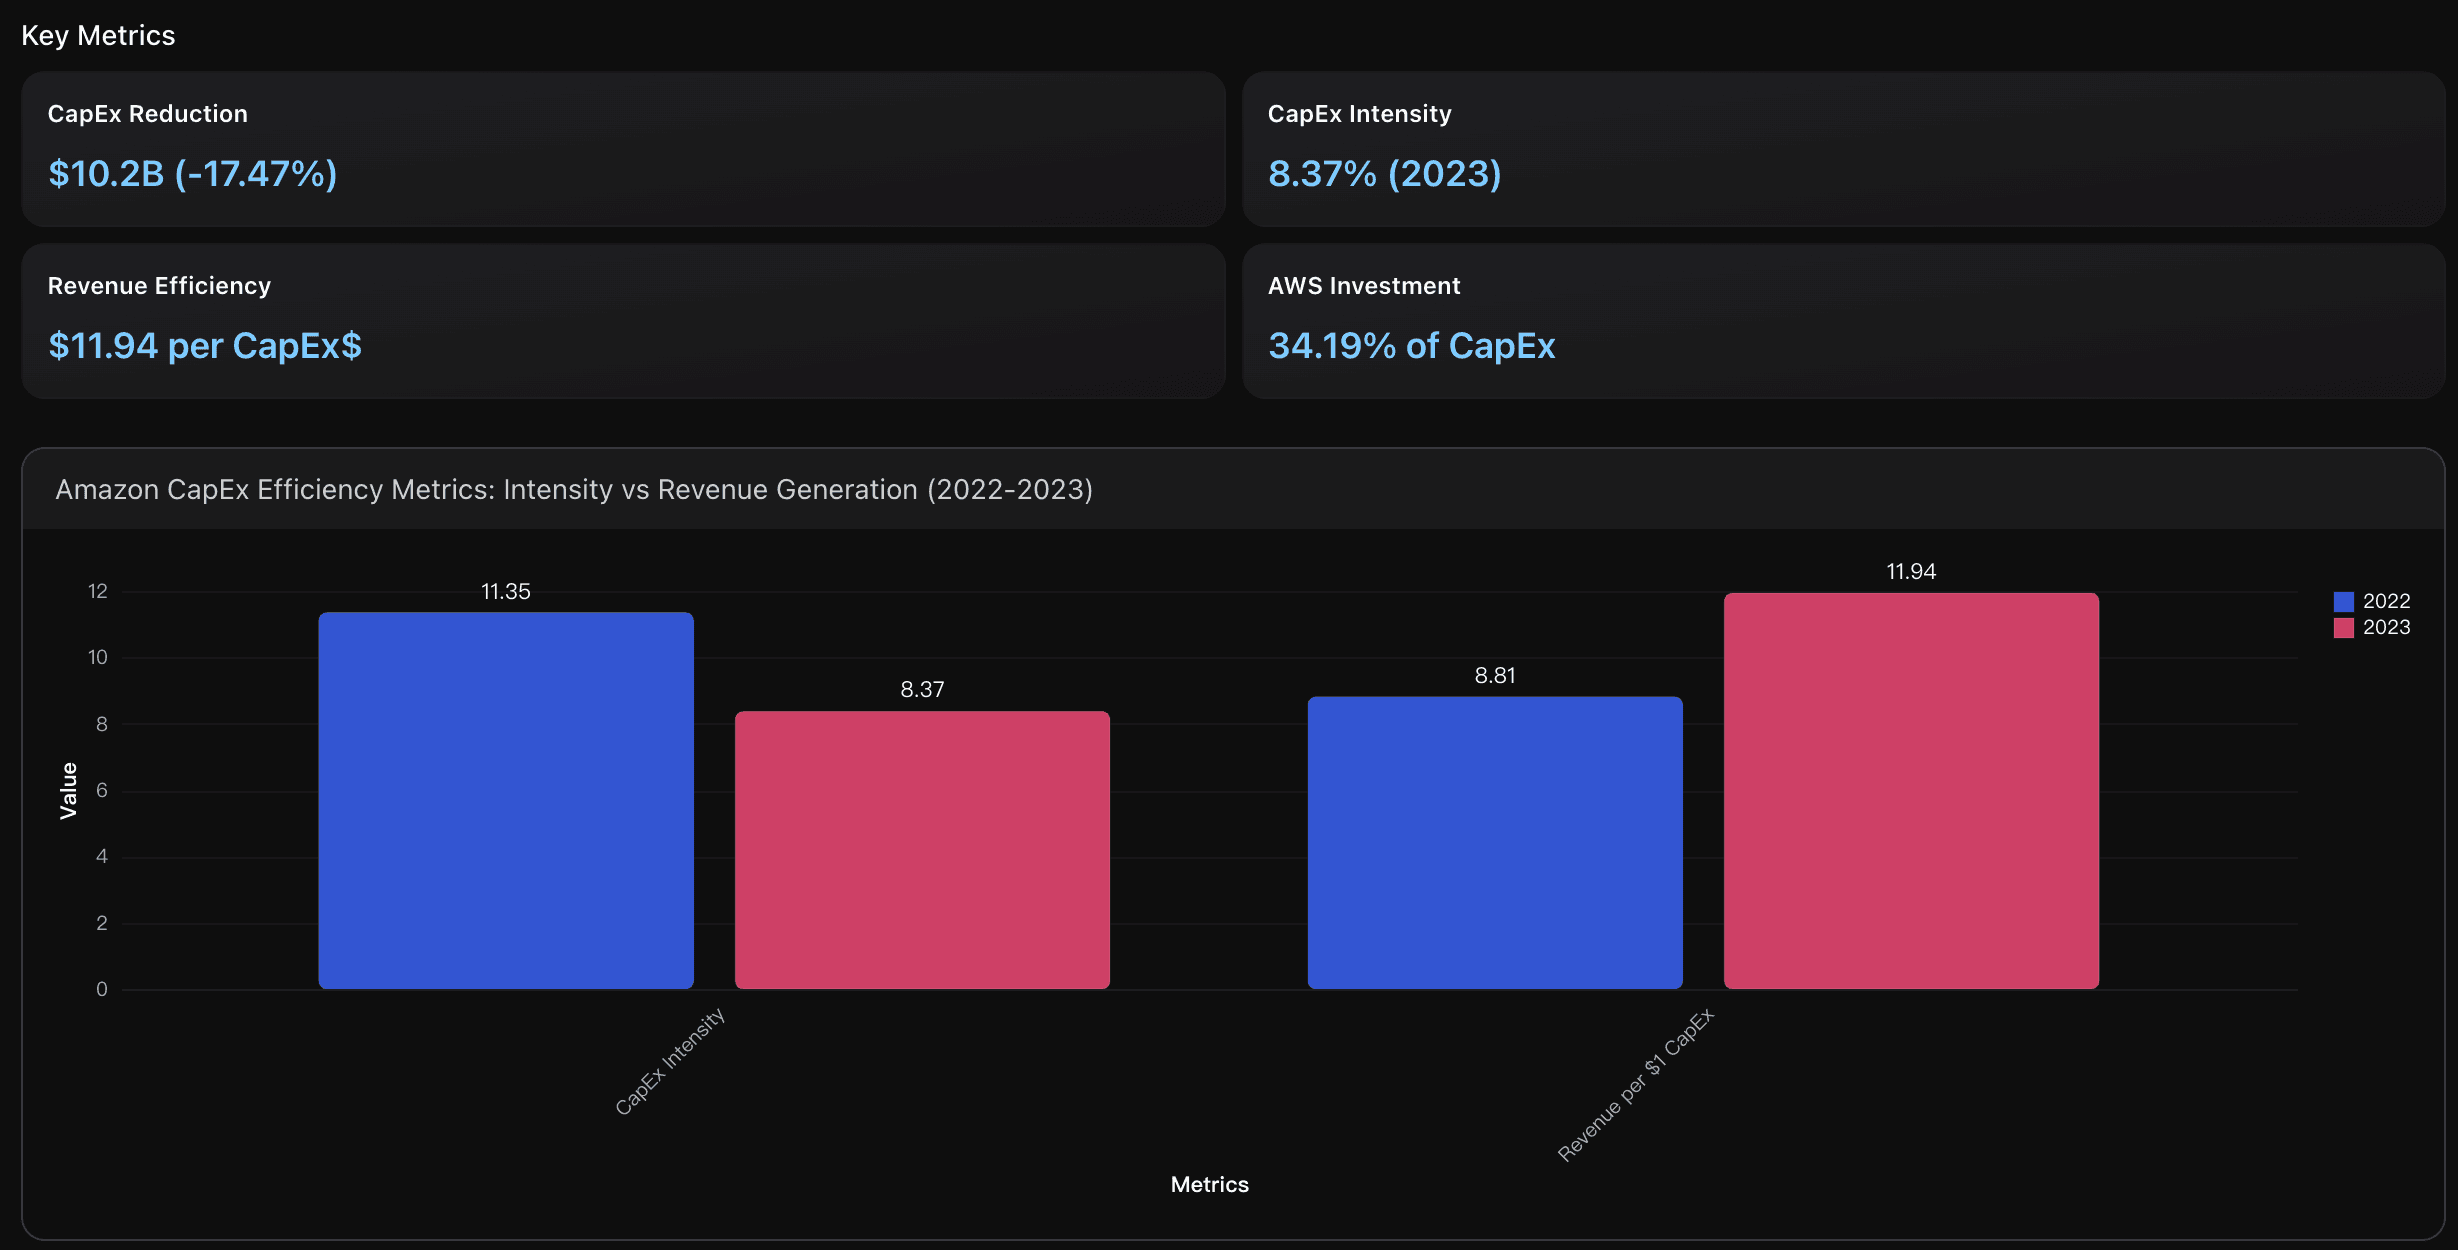
CapEx Reduction
Amazon achieved a substantial capital expenditure reduction of $10.2 billion in 2023 vs 2022, decreasing from $58.3B to $48.1B while simultaneously growing revenue by 11.83%. This 17.47% CapEx reduction demonstrates improved capital allocation efficiency and strategic cost optimization during a period of continued business expansion across all segments.
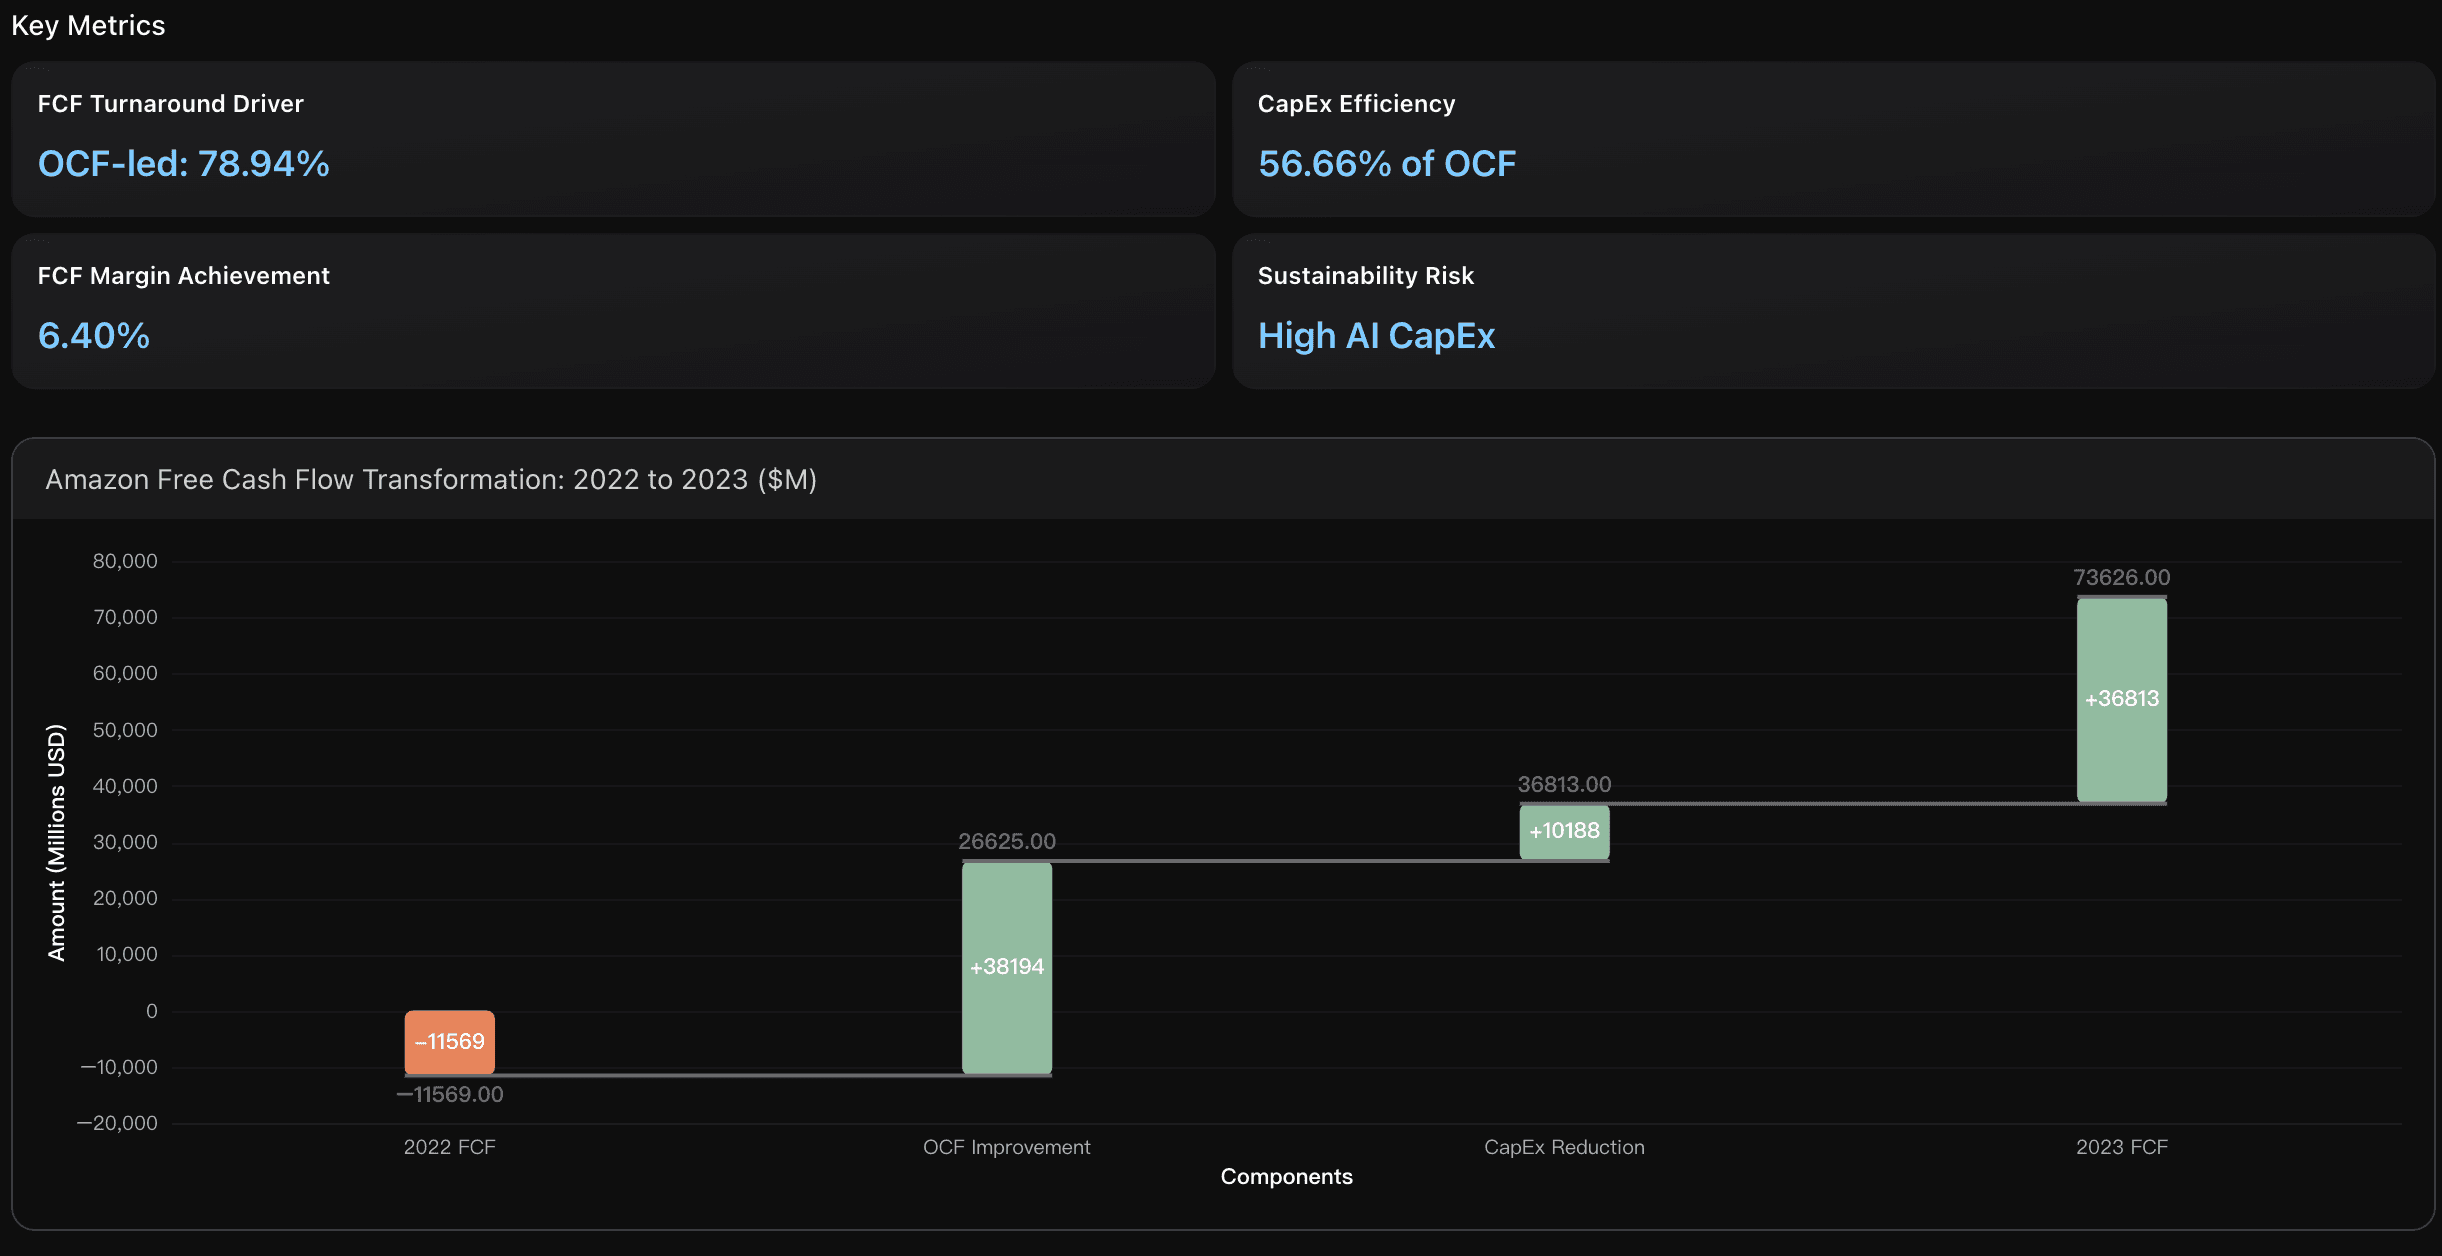
FCF Turnaround Driver
Amazon's remarkable $48.4B free cash flow turnaround from 2022 to 2023 was overwhelmingly driven by operating cash flow improvement ($38.2B contribution, 78.94%) rather than capital expenditure reduction ($10.2B contribution, 21.06%). This indicates the transformation stems from fundamental business cash generation improvements, particularly from AWS profitability growth and North America segment recovery, rather than merely cutting investments.
Actionable Insights
Focus on sustaining the remarkable 14.77% OCF-to-Revenue ratio achieved in 2023 by maintaining the operational efficiency gains that drove the 81.69% operating cash flow growth. Amazon should leverage its strong $84.9B operating cash flow position to strategically invest in AI infrastructure and cloud expansion while avoiding the capital expenditure intensity that previously constrained free cash flow. prioritize maintaining the improved 279.20% cash-to-net income conversion rate through continued working capital optimization and expense discipline, positioning Amazon to consistently generate $30B+ in annual free cash flow and compete effectively with high-margin technology peers.
Focus on replicating Amazon's CapEx optimization strategy by prioritizing high-ROI infrastructure investments while reducing overall capital intensity. Amazon achieved a remarkable 17.47% CapEx reduction from $58.3B to $48.1B while growing revenue 11.83%, demonstrating that disciplined capital allocation can enhance both efficiency and growth. Key implementation steps: (1) Reallocate capital toward highest-margin segments like AWS, which increased to 34.19% of total CapEx allocation, (2) Leverage existing infrastructure investments more effectively to achieve Amazon's $11.94 revenue per CapEx dollar benchmark, and (3) Implement rigorous capital efficiency metrics monitoring to maintain the improved 8.37% CapEx intensity ratio while preserving competitive positioning in core markets.
Prioritize sustainable operating cash flow growth to maintain free cash flow strength amid AI investment surge. With Amazon's projected CapEx doubling to $97B in 2025 from $48.1B in 2023, focus on expanding AWS revenue growth and improving North America segment margins to generate 15%+ annual OCF growth. This strategy will preserve the current 6.40% FCF margin while funding competitive AI infrastructure investments. Monitor CapEx-to-OCF ratio closely, targeting maintenance below 70% to ensure financial flexibility for market opportunities and shareholder returns during the industry-wide $364B AI investment cycle.
Analysis Overview
Amazon demonstrated exceptional cash flow improvement in 2023, with operating cash flow surging 81.7% to $84.9B while transforming free cash flow from a -$11.6B outflow to a +$36.8B inflow. The company's OCF-to-Revenue ratio improved significantly from 9.10% to 14.77%, indicating stronger operational cash generation efficiency. Amazon reduced CapEx intensity from 11.35% to 8.37% of revenue, optimizing capital deployment while maintaining growth investments. The Cash-to-Net Income ratio of 279% demonstrates superior cash conversion quality, though down from 2022's elevated level due to normalized net income growth. This cash flow strength positions Amazon well for continued infrastructure investments in AI and cloud computing while maintaining financial flexibility.
Data Analysis
Operating Cash Flow Strength Analysis
Evaluate Amazon's operating cash flow generation capability through OCF-to-Revenue ratio and Cash-to-Net Income ratio, comparing 2022-2023 performance with industry benchmarks to assess operational efficiency and cash generation quality.
Capital Expenditure Efficiency Analysis
Analyze Amazon's CapE intensity and investment patterns from 2022-2023, examining the $10.2B reduction in capit comparing with technology sector peers' infrastructure investment strategies.
Free Cash Flow Transformation Analysis
Examine Amazon's remarkable free cash flow turnaround from -$11.6B in 2022 to +$36.8B in 2023, driven by improved operating cash flow and reduced apEx, and assess sustainability in the context of Al and cloud infrastructure investment needs.
Conclusion
The analysis of Amazon’s 2023 financial statements shows how AI can revolutionize the way we interpret complex corporate data. With Powerdrill Bloom, you don’t need to be a financial analyst to uncover key insights—Bloom automatically reads PDFs, identifies patterns, and generates clear, data-backed narratives on liquidity, profitability, and cash flow performance.
Whether you’re reviewing annual reports, investor filings, or internal statements, Powerdrill Bloom empowers you to go beyond numbers and understand what truly drives business outcomes.
Try Powerdrill Bloom today and experience how AI transforms financial reporting into instant insight.