How to Make a Roadmap in PowerPoint: 3 Easy Ways in 2026
To make a roadmap in PowerPoint, the fastest route is SmartArt. Go to Insert > SmartArt, choose the Process category, and pick a layout such as a timeline or chevron. Type one phase into each shape. For a roadmap with several teams, insert a table instead, with quarters as columns and teams as rows.
This guide covers three ways to build the slide: SmartArt, a table with swimlanes, and shapes you place yourself. It also covers how to plan the content, a full example, and a faster way to build the slide from a project plan. Steps come from Microsoft's support pages, read on November 16, 2026.
What a roadmap is, and how it differs from a timeline
A roadmap shows where a product, project, or team is heading over the coming months. It groups work into themes or phases and places them in time periods, usually quarters.
A timeline is different. It marks specific dates and milestones, such as "Beta ships May 12." A roadmap works at a higher level. It says what the team will focus on in Q2, not the exact day each task ends.
Common uses on slides include:
- Product roadmaps. Features or themes planned for the next few quarters.
- Project roadmaps. Phases of a project, from discovery to launch.
- Strategy roadmaps. Company goals and the initiatives behind them over a year.
- Technology roadmaps. Systems to upgrade or replace, in order.
The audience shapes the level of detail. Executives want themes and quarters. Delivery teams want more detail, which often belongs in a separate tool, not a slide.
If your plan is really a list of dated milestones, see our guide on how to make a timeline in PowerPoint.
Plan the content before you open PowerPoint
A clear slide starts with a clear plan. Settle these points first:
- The time frame. Pick the horizon, such as the next four quarters. Longer horizons get vaguer, which is fine if you say so.
- The time unit. Quarters suit most business plans. Months suit short projects.
- The lanes. Decide whether rows are teams, products, or goals. Three to five lanes fit on one slide.
- The items. List each theme or phase with a start period and an end period.
- The status. Mark items as done, in progress, or planned.
- The message. Write one sentence the slide should prove, such as "Mobile ships before the holiday season."
Keep item names short. "Self-serve onboarding" reads well on a bar. "Improve the onboarding experience for self-serve customers" does not.
A simple spreadsheet works well for this step. Use columns for item, lane, start quarter, end quarter, and status. It becomes the source for the slide and makes updates easier later.
Way 1: Make a roadmap with SmartArt
SmartArt is the quickest way to build a phase-based plan. Microsoft's timeline steps work the same way for a roadmap.
- On the Insert tab, select SmartArt.
- In the gallery, select Process, and then double-click a layout.
- Select [Text], and then type each phase.
- To add a phase, select a shape, and on the SmartArt Design tab, select Add Shape.
Microsoft's page notes there are "two timeline SmartArt graphics: Basic timeline and Circle Accent Timeline." It adds that "you can also use almost any process-related SmartArt graphic." For a roadmap, a chevron layout works well, since each arrow points to the next phase.
You can also type in the Text Pane. The support page says "You can also open the Text Pane and type your text there." This is faster when you have a list ready.
To reorder phases, select one and use Move Up or Move Down on the SmartArt Design tab. To try a different look, open the Layouts group and pick another layout.
SmartArt works best for one lane of work, such as the phases of a single project. It is harder to show several teams side by side. For that, use a table.
Way 2: Make a swimlane roadmap with a table
A table gives you a grid of lanes and periods. It is the most common layout for team and product plans.
- Select the slide you want to add the table to.
- On the Insert tab, select Table.
- Drag to choose the size, or select Insert Table and enter the number of columns and rows.
- Click a cell and type. Click outside the table when you finish.
Use one column for lane names and one column per period. For four quarters and four teams, that is five columns and five rows, including the header row.
Microsoft's page shares a useful tip. "To quickly insert a new row at the end of a table, click inside the last cell of the last row, and then press TAB." To add rows or columns elsewhere, right-click a cell and choose Insert.
If your plan already lives in Excel, you can copy cells and paste them. The support page says "You can also copy and paste a table from Word or Excel." One limit is worth knowing: "It's not possible to convert existing slide text into a table."
There is a third option: insert an Excel spreadsheet inside the slide. Microsoft warns that it "becomes an OLE embedded object." If you later change the presentation's theme, "the theme does not update the spreadsheet you inserted from Excel." You also cannot edit it with PowerPoint's table tools. For a plan that changes every month, a pasted table is usually easier to keep consistent with the rest of the deck. Keep the source spreadsheet anyway, since it is where updates start.
To show items that span more than one quarter, merge cells across the columns. Fill each item's cell with a color for its status. A legend at the bottom explains the colors.
Way 3: Draw a custom roadmap with shapes
Shapes give you full control. Use them when you want bars of different lengths, icons, or a more visual style.
- Draw a header row of text boxes for the periods, such as Q1 to Q4.
- Draw a rectangle for each item, and stretch it across the periods it covers.
- Type the item name in each rectangle.
- Add a text box on the left for each lane.
Alignment makes or breaks this method. Microsoft's alignment steps are simple. "Select the first object, and then press and hold Ctrl while you select the other objects." Then select Shape Format > Align and choose an option, such as Align Top.
After aligning, spacing can still be uneven. The support page says "Use Distribute Horizontally or Distribute Vertically under Align to space the objects evenly."
Guides help too. Select View > Guides to show the center lines, or View > Gridlines for a full grid. As you move a shape, smart guides appear. Microsoft describes them as "Red dashed lines" that help "align items vertically, horizontally, or both."
Once the layout looks right, group each lane's shapes. That way you can move a lane without breaking it.
Style the slide and keep it current
A plan changes often, so build the slide for easy updates.
Use color for status, not for decoration. One color for done, one for in progress, and one for planned is enough. Use the same colors on every slide.
Add a "today" line. A thin vertical line at the current date shows what is past and what is ahead.
Add a last-updated note. A small footer such as "Updated November 16, 2026" tells readers how current it is.
Keep text short. If an item needs more than four words, move the detail to the speaker notes.
Show uncertainty honestly. Many teams label later quarters as "exploring" or use lighter colors. This sets expectations without overpromising.
Add alternative text. Screen readers cannot read shapes as a plan. Add a short description that lists the lanes and the main items in order.
A roadmap example
Here is a simple example for a software team planning the next four quarters. The rows are lanes and the columns are quarters.
| Lane | Q1 | Q2 | Q3 | Q4 |
|---|---|---|---|---|
| Product | Self-serve onboarding | Usage dashboards | Mobile app beta | Mobile app launch |
| Platform | Database upgrade | Database upgrade | Single sign-on | Audit logs |
| Growth | Pricing page test | Referral program | Partner listings | Holiday campaign |
| Support | Help center refresh | Chat support | Chat support | Customer forum |
Built as a table, this takes one slide. "Database upgrade" spans Q1 and Q2, so merge those two cells. "Chat support" spans Q2 and Q3, so merge those too.
Next, add status colors. Suppose Q1 is done and Q2 has just started. Color the Q1 items as done, the Q2 items as in progress, and the rest as planned. Add a today line at the start of Q2.
Finally, write the title as the message. "Mobile app launches in Q4, after the platform work lands" says more than "2026 Roadmap."
How to present a roadmap
Start with the message, then show the slide. People read the title first, so make it the point you want them to remember.
Walk the room through one lane at a time. Explain what is done, what is in progress, and what comes next. Then step back and show how the lanes connect, such as platform work that unlocks a product feature.
Be clear about confidence. Near-term items are commitments. Later items are plans that may change. Saying this up front prevents hard questions later.
End with what you need. That might be a decision, a budget, or help from another team.
Send the slide after the meeting, not before. A plan read alone invites questions about every item. A plan walked through together keeps the focus on the main message. Attach the source spreadsheet for anyone who wants the detail.
Make a roadmap in PowerPoint with AI
When the plan lives in a long spreadsheet or document, turning it into a slide takes time. An AI tool can read the file and build the slides for you.
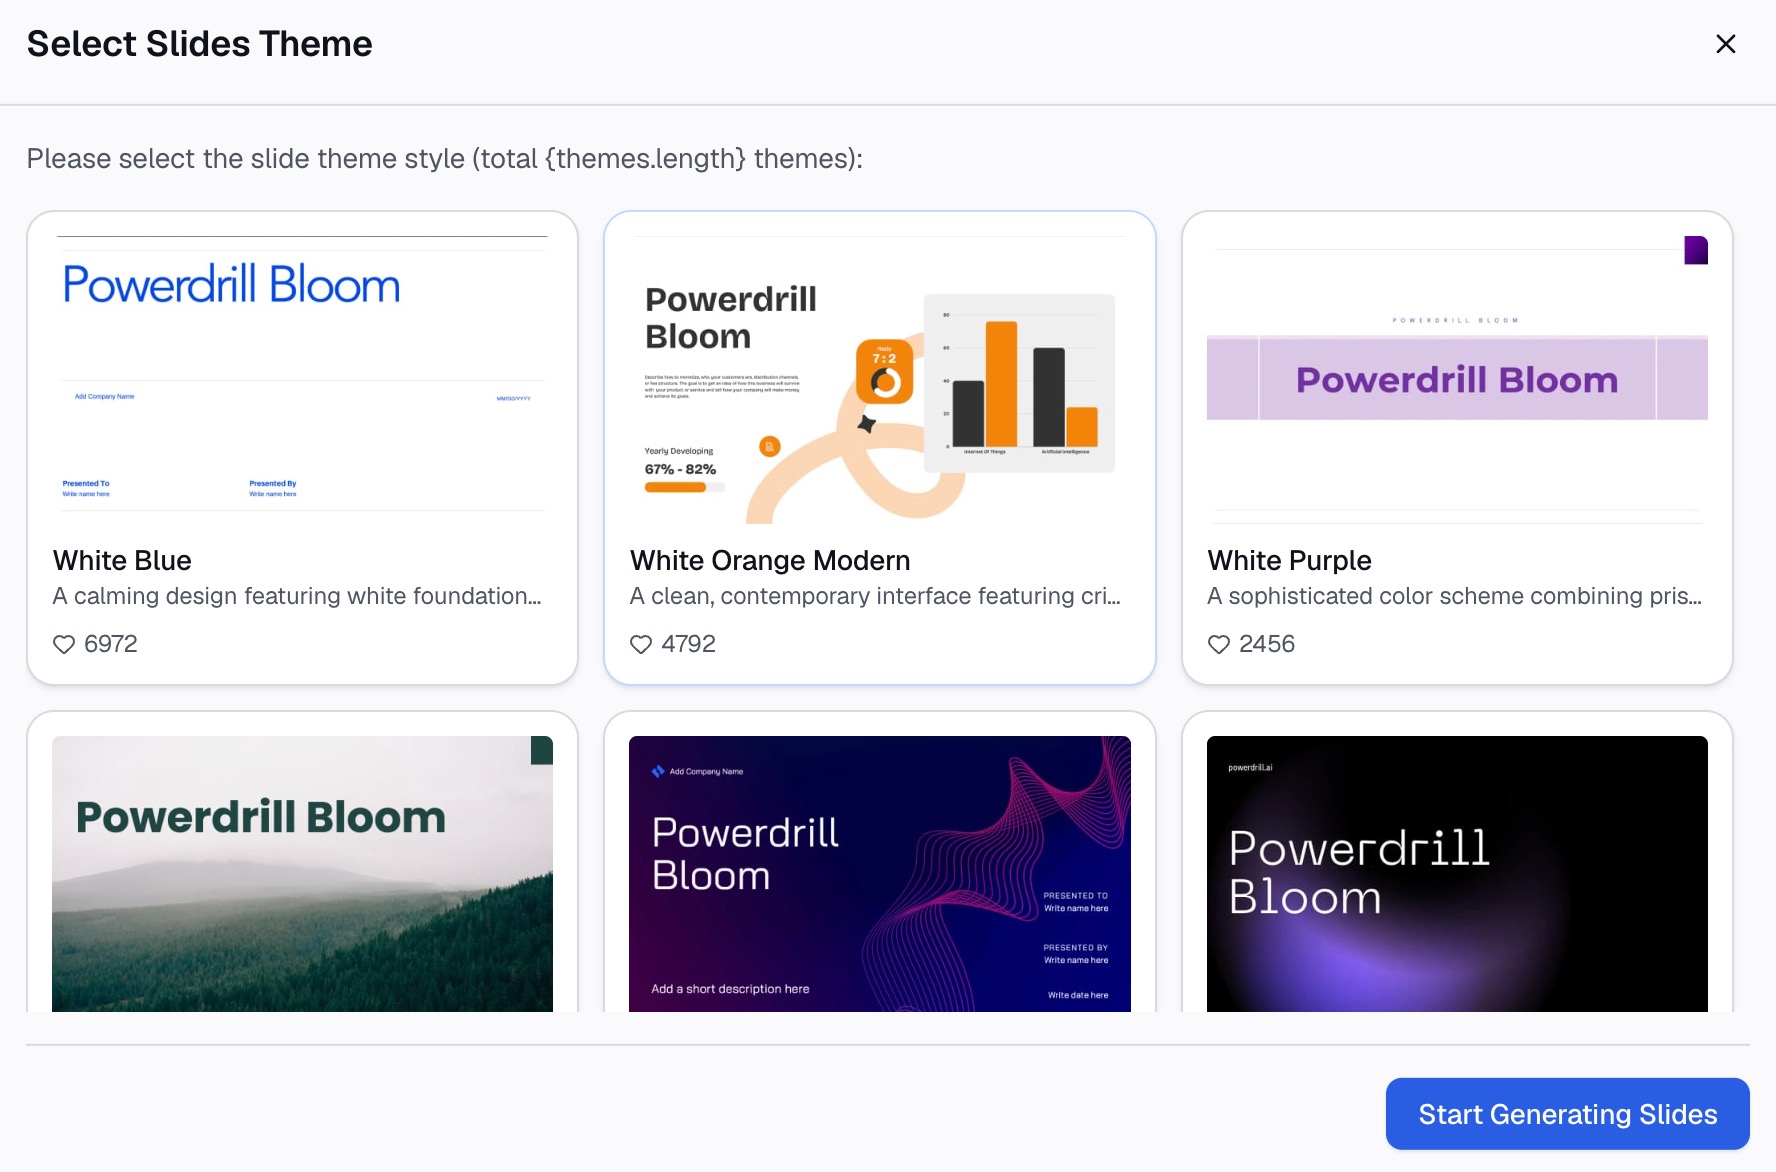
Here is the method in three steps, using Powerdrill Bloom.
Step 1: Upload your project plan
Upload the Excel, CSV, or PDF file that holds the plan. The Excel to PPT page says Powerdrill Bloom "turns a topic or your Excel, CSV and PDF files into PowerPoint slides."
A spreadsheet with item, lane, start, end, and status columns works best. Clear column names help the AI read the plan.

Step 2: Ask for the roadmap slide in natural language
Describe the slide you need. For example: "Build a four-quarter roadmap slide with one lane per team, and color items by status."
The same page says the tool "suggests exploration directions such as key findings and comparisons." You can also ask for a summary slide of risks or dependencies next to the plan. For a plan that starts as a document, the Word to Slides page works the same way.
Step 3: Check the plan and export the deck
Check every item against the source file, in the right lane and quarter. Then export the slides. The Excel to PPT page says you can "export to PowerPoint in one click."
Open the file in PowerPoint and fine-tune it with the methods above. The AI draft saves the setup; your review makes it accurate.
Common mistakes to avoid
These are the problems that come up most often on these slides.
- Too much detail. A plan with 40 items is a project schedule, not a roadmap. Keep it to themes.
- Exact dates far ahead. Precise dates in Q4 suggest more certainty than you have. Use quarters.
- No status. Without status colors, readers cannot tell what is done.
- Too many lanes. More than five lanes shrink the text. Split the slide or group teams.
- Decorative colors. Random colors make readers look for meaning that is not there.
- Shapes out of line. Bars that do not line up look careless. Use Align and Distribute.
- No owner or update date. Readers need to know who owns the plan and how current it is.
- A vague title. "Roadmap" says nothing. Put the main message in the title.
For more on slide structure, see our guide on how to make data slides easy to read.
When you are ready to turn a project plan into slides, try Powerdrill Bloom with your team's current plan spreadsheet.
Frequently asked questions
How do I make a roadmap in PowerPoint?
Go to Insert > SmartArt, choose the Process category, and pick a timeline or chevron layout. Type one phase into each shape. For several teams, insert a table with quarters as columns and teams as rows.
Does PowerPoint have a roadmap template?
PowerPoint's SmartArt gallery includes timeline layouts such as Basic Timeline and Circle Accent Timeline. Microsoft notes that almost any process-related SmartArt graphic can work. Many teams also start from a table.
What is the difference between a roadmap and a timeline?
A roadmap groups work into themes or phases across periods, such as quarters. A timeline marks specific dates and milestones. Roadmaps show direction; timelines show exact timing.
How do I show status on a roadmap?
Use color. One color for done, one for in progress, and one for planned is enough. Add a legend and a line for today's date.
Can I turn an Excel project plan into a PowerPoint roadmap?
Yes. You can copy cells from Excel and paste them into a slide as a table. AI tools such as Powerdrill Bloom can also read the spreadsheet and build the slides for you.
Sources: Microsoft Support, Create a timeline in PowerPoint · Microsoft Support, Add a table to a slide · Microsoft Support, Align objects on a slide · Microsoft Support, Guides for arranging things on a slide.