How to Make a Recruiting Funnel Report: Step by Step
A hiring manager asks how long it takes to fill a role. You say 34 days. Someone else in the room says 51.
Both of you are reading the same applicant tracking system. You are measuring from the day the requisition was approved, and they are measuring from the day the job was advertised.
That is the recurring problem with hiring metrics. The stage names look standard, and the start and end points are not.
This guide covers what belongs in a recruiting funnel report, and why two speed metrics get confused. It then covers how to fix your stage definitions, and how to build the report from an export.
What belongs in a recruiting funnel report
A recruiting funnel report is a set of counts plus the drop between them. Everything else is derived.
Start with the stage counts. Applications received, screened, interviewed, offered, and accepted, for a fixed period.
| Line on the report | What it is | Where it comes from |
|---|---|---|
| Stage counts | Candidates reaching each stage | Applicant tracking export |
| Yield ratios | Each stage divided by the one before | Derived from the counts |
| Time to fill | Requisition approval to acceptance | Requisition dates |
| Time to hire | Pipeline entry to acceptance | Candidate dates |
| Offer acceptance rate | Offers accepted over offers made | Offer records |
| Cost per hire | Recruiting costs over hires | Finance, not the tracking system |
Then add the conversion between consecutive stages. Workable calls these recruiting yield ratios, and they are what turn raw counts into a diagnosis.
Two speed measures come next, and they need separate definitions. More on those below.
Finish with offer acceptance rate, which Workable gives as offers accepted divided by total offers. It is the cheapest metric on the list and often the most revealing.
One warning about what to leave out. Workable notes that an applicant tracking system "can't calculate your average cost per hire," even though it reports time to fill and yield ratios.
So cost per hire needs finance data, not just the recruiting funnel. Its formula is internal plus external recruiting costs divided by total hires.
Time to fill and time to hire are not the same metric
This is the definition that causes the most arguments, and the source is unusually blunt about it.
Workable's time to fill and time to hire guide defines time to fill as "the duration from job requisition approval to candidate acceptance."
Time to hire is different. It "measures the period from when a candidate enters the pipeline to job offer acceptance."
Then comes the sentence worth pinning to the wall. Workable states that "time to hire is often synonymous with time to fill." It adds that you "can also treat them as separate metrics and gain different insights."
So the two names are used interchangeably in the wild. That is exactly why your figure will not match another company's.
The distinction is useful once you keep it. Time to fill measures the whole process, including the weeks before anyone applied. Time to hire measures how fast you recognised and moved the person you eventually chose.
Workable's own worked example makes it concrete. If the role opened on day one, the hire applied on day ten and accepted on day twenty-five, then time to hire is fifteen days.
Fixing the definitions before you count
Four decisions have to be written down. Skip them and your trend line is measuring your own inconsistency.
Where the clock starts. Workable lists three defensible options: the hiring manager submitting the opening, HR or finance approving it, or a recruiter advertising it.
Its instruction is to pick one and be consistent. The guide says to "choose what makes the most sense for your company," then count it the same way "for all positions and teams."
Which requisitions are excluded. Workable is specific here, advising that evergreen roles be left out. Always-open positions "would greatly inflate your average time to fill without reflecting the efficiency of your hiring process."
Calendar days or business days. Workable's definition uses calendar days. If you use NETWORKDAYS you get a smaller number that is not comparable to the published version.
Average or median. An average is what most reports show, and one 200-day requisition drags it badly. Report the median beside it when the volume is low.
Workable's averaging example is worth copying for its simplicity. Three roles at 20, 30 and 40 days give an average of 30 days.
How to do it manually
Option 1: Stage counts and ratios
Count each stage with COUNTIFS, filtered to the period and the stage field.
Check that the counts descend. If a later stage exceeds an earlier one, your export contains candidates who skipped a stage or re-entered the process.
Then divide each stage by the one before it. Those ratios are the recruiting funnel in its simplest form.
A funnel chart of the same numbers reads faster than the table. Our explainer on what a funnel chart is covers when the shape helps.
The ceiling is that you get one set of ratios for one period, with nothing about which roles or teams caused them.
Option 2: One row per requisition
Build a table with one row per requisition. Columns for the opening date, the advertised date, the accepted date, the applicant count, and the day gaps.
Compute day gaps by subtracting the earlier date from the later one. Microsoft's guidance on the DATEDIF function warns that it "may calculate incorrect results under certain scenarios."
Now the report can be sliced. By department, by seniority, by recruiter, or by source.
Slicing is where the answer lives. A blended 40-day figure often hides engineering at 70 days and support at 18.
The limit is the join. Matching a candidate export to a requisition table is past the point where formulas stay comfortable.
Option 3: A definitions tab
Record the four decisions above, plus the stage names in use and the date the list was frozen.
Add the exclusion list explicitly. Evergreen roles, cancelled requisitions, and internal transfers each need a stated treatment.
The limitation is familiar. Documenting a rule does not apply it, and someone rebuilds the filters next quarter anyway.
The shared ceiling. All three assume your export shows stage history rather than only current stage. If it shows only where candidates sit today, you cannot reconstruct last quarter's funnel at all.
Where the manual route slows down
The first recruiting funnel report takes a morning. The fourth takes longer, because the process changed underneath it.
Stage renames are the usual culprit. A team merges phone screen into screening, and the ratio between two stages breaks with no change in hiring.
Cancelled requisitions are the second. A role closed without a hire has no end date, and it either vanishes from the average or sits there as a blank.
Then there is the benchmark question. Somebody asks whether 42 days is good, and Workable's own caution applies: other companies "may not calculate time to fill the same way as yours."
The tooling side of this has its own roundup, in AI tools for HR and people analytics.
How to build it with Powerdrill Bloom
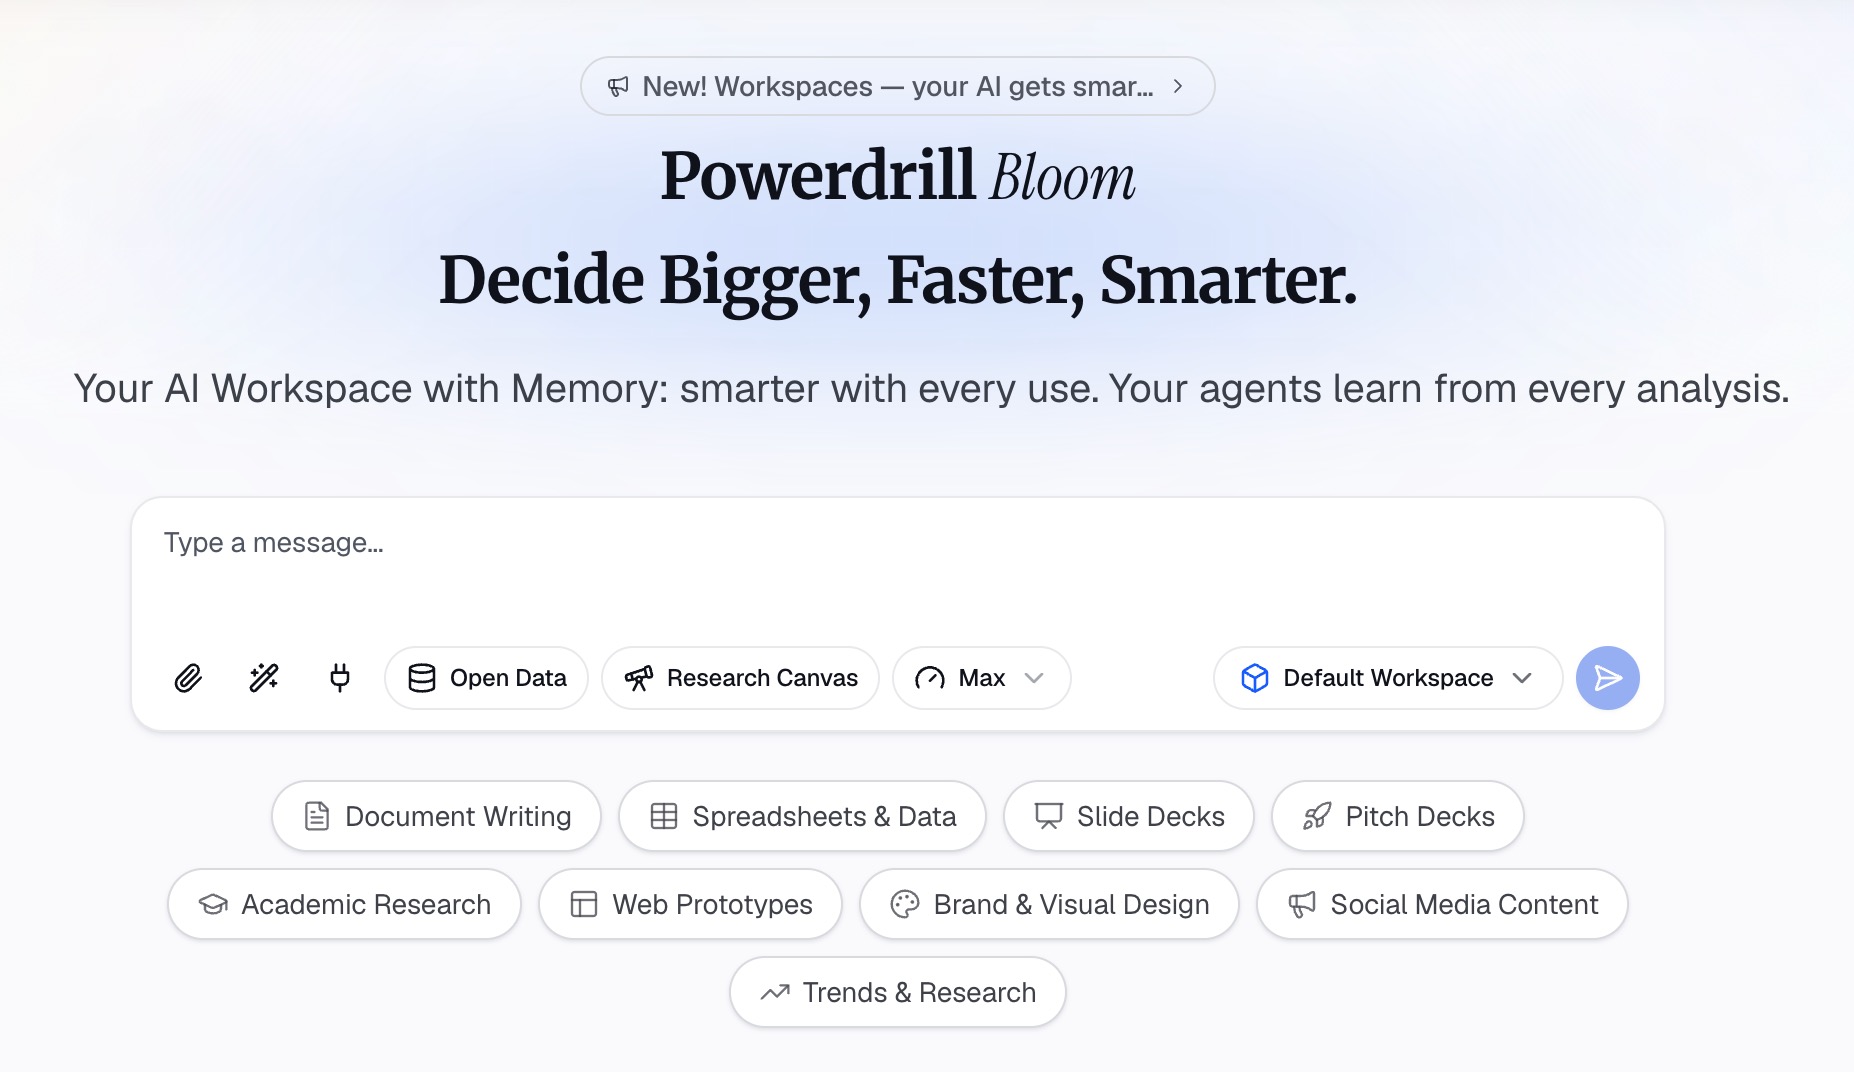
Step 1: Upload your ATS export
Upload the candidate export, or the candidate and requisition files together. Powerdrill Bloom profiles the columns on arrival, so blank dates, inconsistent stage names, and duplicate candidate records surface before any ratio is computed.
Step 2: Describe the report in natural language
State the definitions rather than building them. Name the clock start, the stage order, the exclusions, and whether you want calendar or business days.
Then ask the questions that catch the errors. Ask which requisitions have no end date. Ask which stage names appear in only part of the period. Then ask for the recruiting funnel split by department and by seniority.
Step 3: Export the chart, report, or deck
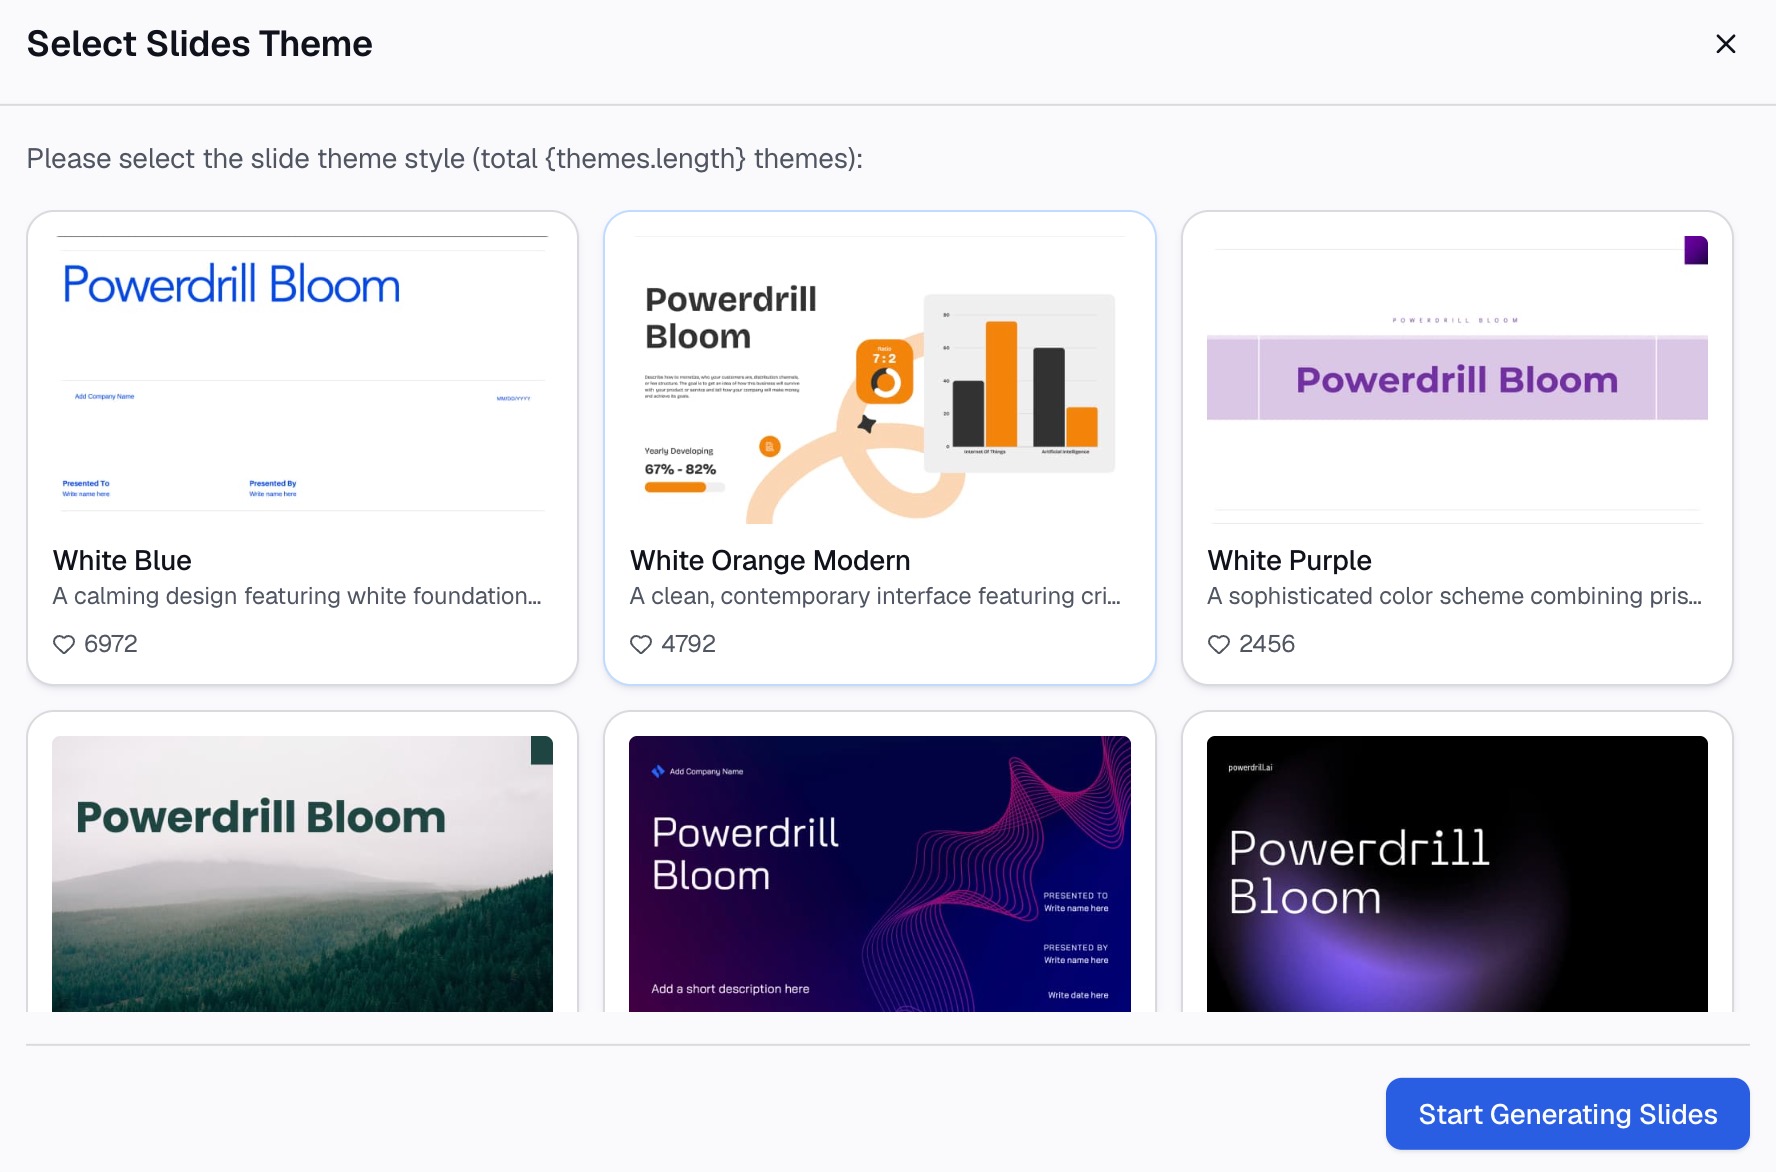
Take out the stage counts with their ratios, a funnel chart of the same figures, or slides that carry the definitions beside the numbers.
Common mistakes
Treating time to fill and time to hire as one number. They start at different moments. Label whichever you report and keep the label.
Leaving evergreen roles in the average. Always-open positions inflate the figure without saying anything about process speed.
Comparing your figure to another company's. Different start points make the comparison meaningless. Track your own trend instead.
Reporting an average on low volume. Six hires and one difficult search produce a misleading mean. Show the median beside it.
Silently dropping cancelled requisitions. A role closed without a hire is a real outcome. Count it somewhere rather than filtering it out.
Mixing calendar and business days. Both are defensible and they are not comparable. Pick one and write it on the report.
Ignoring renamed stages. A merged stage breaks one ratio and leaves the rest intact, which looks like a real finding and is not.
Conclusion
Fix the clock start, exclude evergreen roles, count each stage, and divide consecutive stages to get the ratios. Then report the two speed metrics under separate names.
The counts are not the deliverable. The stage where candidates stop is what tells you what to change next month.
That is the whole argument for building a recruiting funnel report rather than quoting a single average. One number tells you how you did, and the funnel tells you where.
If rebuilding that view every cycle eats your quarter, try Powerdrill Bloom on your ATS export. See also our guide to creating a headcount and attrition report and the AI report generator page.
Frequently asked questions
What is the difference between time to fill and time to hire?
Time to fill runs from requisition approval to acceptance. Time to hire runs from the eventual hire entering the pipeline to that same acceptance.
How do I calculate average time to fill?
Add the time to fill for every role filled in the period, then divide by the number of roles. Workable advises excluding always-open positions from that average.
What is a good time to fill?
Workable cites an average of 42 days from the Society for Human Resource Management. It also warns that other companies may not calculate the metric the same way you do.
Which stages should a recruiting funnel report include?
Whatever stages your process actually has, in order, with counts and the conversion between each pair. Consistency across periods matters more than matching a template.
Can my applicant tracking system produce this report?
It can usually report stage counts, yield ratios, and time to fill. Workable notes it cannot calculate average cost per hire, which needs finance data.