How to Create a Headcount and Attrition Report: Step by Step
A headcount report looks like the simplest thing HR produces. Count the people, count the leavers, divide. Ship it.
Then someone asks whether contractors are in the number. Then someone asks whether the person who left on the 31st counts for that month. Now the report needs rebuilding.
The counting is trivial. The decisions around the counting are not, and they are what makes one headcount report trusted and another one argued over.
This guide covers what the report needs to contain, why the attrition denominator changes your answer, the three manual routes, and where each one breaks.
What a headcount report needs to contain
Workday's guide to headcount reporting defines it as a report that "shows who an organization employs by role, team, location, status, and employment type."
The same page lists the fields such a report typically carries. They are department, job role, employment type, location, manager, start and end dates, cost center, FTE, and notes on vacancies.
That list is your export checklist. Three of those fields do all the work in an attrition calculation, and they are employee ID, start date, and termination date.
If your HRIS export is missing the termination date, you cannot compute attrition at all. You can only count who is currently active, which is a different report.
Headcount is not FTE
This is the distinction that causes the most quiet disagreement, and the Workday page states it directly.
"Headcount reports focus solely on people numbers, while full-time equivalent (FTE) reports translate hours worked into standardized units to plan capacity and budgets."
So two part-time employees are two in a headcount report and roughly one in an FTE report. Neither figure is wrong, and presenting the wrong one to Finance will cost you a meeting.
Decide which one the audience wants before you build anything. Then label the chart with the answer, because nobody reading it later will remember.
The denominator decides your attrition rate
Attrition is a fraction, and the top half is uncontroversial. Count the separations in the period.
The bottom half is a choice, and there are three common options:
| Denominator | What it is | Effect |
|---|---|---|
| Headcount at period start | Active employees on day one | Inflates the rate while you are growing |
| Headcount at period end | Active employees on the last day | Understates the rate while you are growing |
| Average headcount over the period | Usually start plus end, divided by two | Most stable during growth or contraction |
Average headcount is the usual choice for a reason. During a hiring push the start-of-period figure is too small to be representative. The same number of leavers then reads as a worse rate than it is.
Note that Workday's page names turnover rate as a metric without publishing a formula for it. So treat the denominator as your organization's documented choice rather than a universal standard, and write the choice onto the report itself.
One more decision hides in the numerator. Voluntary and involuntary separations behave differently, and a single blended figure hides a restructure inside what looks like a retention problem. Split them.
How to do it manually
Option 1: Count active employees, then count leavers
Start from the export and build two visible cells rather than one nested formula.
Active headcount comes from COUNTIFS with your status column and the period bounds. Separations come from the same function counting non-blank termination dates inside the period.
Put both counts in cells someone can point at. The first question you will be asked is what the denominator was, and you want to answer it by pointing rather than by explaining.
Then compute the average headcount with AVERAGEIFS across monthly snapshots if you keep them, or with the start-plus-end shortcut if you do not.
The ceiling is that this gives you one rate with no shape. You know attrition was 14% and nothing about where.
Option 2: Build an employee-level flag table
One row per employee, one column per question. Active at period start, active at period end, separated in period, voluntary or involuntary, tenure at exit.
Now the report can be sliced. Attrition by department, by manager, by location, by tenure band, by employment type.
That slicing is where the finding lives. A blended 14% often hides one team at 40% and everyone else at 4%. Only one of those needs a response.
⚠️ Be careful computing tenure. Microsoft's own page carries a warning about DATEDIF. It exists "in order to support older workbooks from Lotus 1-2-3" and "may calculate incorrect results under certain scenarios." The same page notes you can subtract the earlier date from the later one to get days.
The limit is volume and joins. Once you are matching an HRIS export against payroll and a cost-center table, formulas stop being pleasant.
Option 3: Keep a definitions tab beside the numbers
Write down the status values you counted as active, whether contractors are included, which date field bounds the period, and which denominator you used.
This is what makes this month's headcount report comparable to last month's. It is also the tab that gets skipped when the number is needed before a board call.
The limitation is that documenting a rule does not apply it. Somebody still rebuilds the same filters every cycle.
The shared ceiling. All three assume the status values are clean. When "Terminated," "Term," and "Exited" all appear in one column after a system migration, reconciling those comes before any counting.
Where the manual route slows down
The first headcount report takes a morning. The fourth takes longer, because by then three things have changed underneath it.
Status values change when HR systems are configured or replaced. A renamed status silently drops people out of your active count, and the chart shows a headcount cliff that never happened.
Organizational structure changes too. A team is renamed or merged, and your by-department breakdown no longer lines up with last quarter's.
Workday's page names this cost directly. Disjointed sources produce "inconsistent data and slower reconciliations that create planning bottlenecks," and different teams applying their own rules produce mismatched totals.
Then there is the counting error that survives longest. Counting rows instead of distinct employee IDs inflates headcount. It happens whenever someone appears twice after a rehire or a transfer.
How to build it with Powerdrill Bloom
Step 1: Upload your HRIS export

Upload the employee export, or the employee and cost-center files together. Powerdrill Bloom profiles the columns on arrival, so inconsistent status values, duplicate employee IDs, and missing termination dates surface before any rate is calculated.
Step 2: Describe the definition in natural language
State the rules rather than building them. Name which status values count as active, whether contractors are in scope, the period bounds, and which denominator you want.
Then ask the questions that catch the traps. Ask how many distinct employee IDs are active versus how many rows exist. Ask which status values look like near-duplicates. Ask how the attrition rate differs under each of the three denominators. Then ask how it splits by department and tenure band.
Step 3: Export the chart, report, or deck
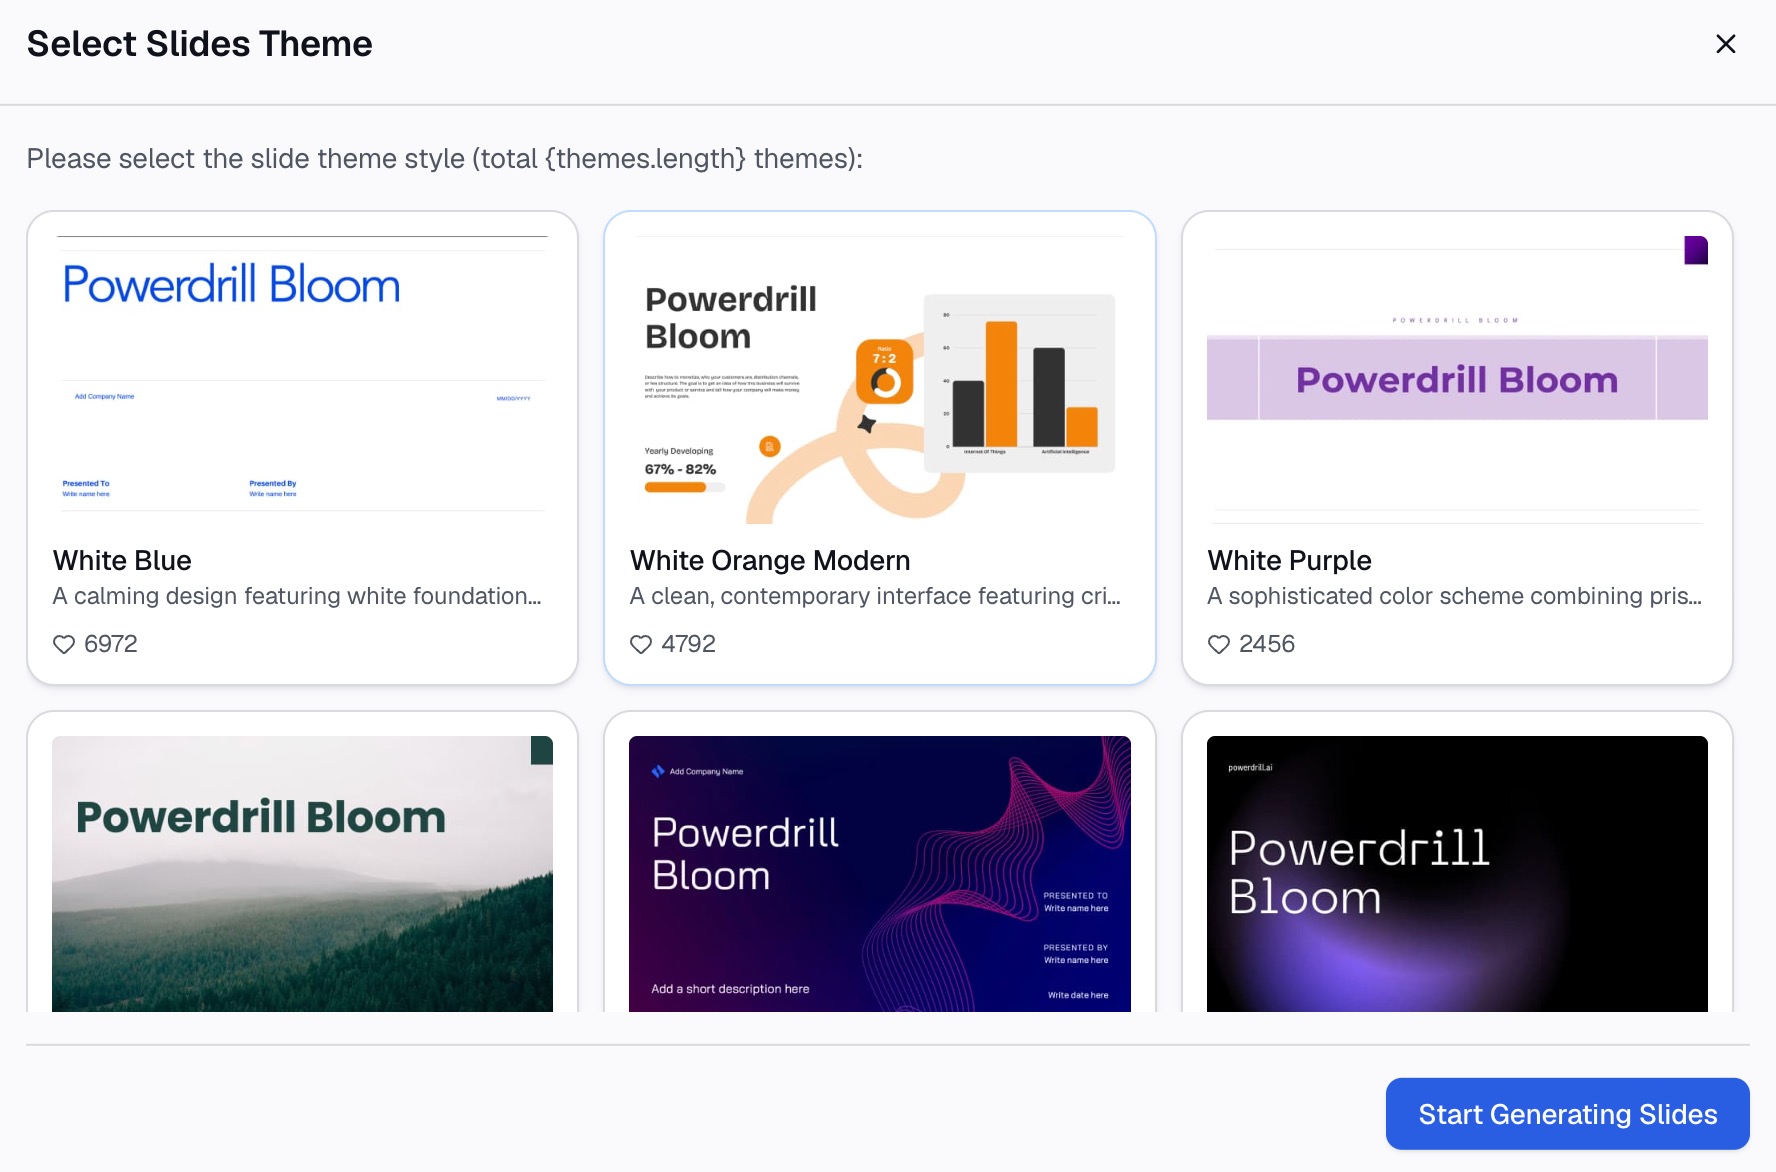
Take out the headcount trend, a breakdown by team, or slides that carry the rate and its definition together.
Why this beats rebuilding it each month
| Manual route | Powerdrill Bloom | |
|---|---|---|
| Deduplicating rehires and transfers | Helper column per file | Ask for distinct employee IDs |
| Testing all three denominators | Rebuild the formula three times | Ask for all three at once |
| Renamed status values | Spot the cliff in the chart later | Surfaces on upload |
| Splitting voluntary and involuntary | Rework the flag table | State the rule |
The second row changes how the conversation goes. Showing all three denominators side by side changes the question. It moves from "your number is wrong" to "which basis do we report on," which is a decision rather than a dispute.
Common mistakes
Counting rows instead of distinct employees. Rehires and transfers duplicate people. Deduplicate on employee ID before any headcount is reported.
Blending voluntary and involuntary separations. A restructure and a retention problem look identical in one blended rate. Split them and label both.
Using period-end headcount as the denominator while growing. It flatters the rate. Use average headcount, and write down which basis you chose.
Presenting headcount when Finance wanted FTE. Two part-timers are two people and about one FTE. Confirm which the audience needs first.
Trusting a single status column after a migration. Legacy and current status values coexist for months. List the distinct values before filtering on them.
Computing tenure with DATEDIF and not reading the warning. Microsoft states it may return incorrect results in certain scenarios. Subtracting dates is safer for day counts.
Reporting a rate with no period or denominator attached. A percentage alone is unusable. Put the period, the denominator, and the scope on the chart.
Conclusion
Get the export fields right, decide headcount versus FTE, choose and document your denominator, split voluntary from involuntary, and deduplicate on employee ID. Those five turn a headcount report into something Finance and leadership will both accept.
What makes it expensive is that status values and org structures keep moving. The report has to be re-runnable rather than rewritten.
If that is where your month goes, try Powerdrill Bloom on your existing export. See also the roundup of AI tools for HR and people analytics and our explainer on cohort analysis for tenure-band reporting. The guide to building a cohort retention chart and the Excel AI assistant page cover the mechanics.
Frequently asked questions
What should a headcount report include?
Workday's guide lists department, job role, employment type, location, manager, start and end dates, cost center, FTE, and vacancy notes. Three of those make attrition computable: employee ID, start date, and termination date.
How do I calculate the attrition rate?
Divide separations in the period by a headcount denominator you have documented. Average headcount over the period is the most stable choice during growth or contraction.
What is the difference between headcount and FTE?
Headcount counts people, while FTE translates hours worked into standardized units for capacity and budget planning. Two part-time employees are two in headcount and roughly one in FTE.
Should contractors be in the headcount?
That is a scope decision, not a rule, so make it once and write it on the report. Mixing employment types without labelling them is what makes two reports disagree.
Why does my number differ from Finance's?
Usually scope or basis. Finance often works in FTE and by cost center, while HR often works in people and by department. Both are correct under their own definition.