How to Make a Gantt Chart in PowerPoint: Step by Step

To make a Gantt chart in PowerPoint, select Insert > Chart, choose Bar, and pick Stacked Bar. In the worksheet that opens, enter each task with its start date and duration in days. Then set the start bars to No Fill, reverse the task order, and set the date axis to begin on your project start date.
PowerPoint has no built-in Gantt chart type. Microsoft's own guidance for Excel says you can "simulate one by customizing a stacked bar chart to show the start and finish dates of tasks." The same method works in PowerPoint, because PowerPoint charts use an Excel worksheet for their data.
This guide covers how to prepare your task data, build the chart, fix the date axis, and format it for a slide. It also walks through a full example, a seven-task website launch, and a faster way to build the slide from an Excel file. Steps come from Microsoft's support pages, read on November 18, 2026.
What a Gantt chart shows
A Gantt chart shows a project schedule as horizontal bars on a timeline. Each row is a task. Each bar starts on the task's start date, and its length shows how long the task takes.
Readers can see four things at a glance:
- Order. Which tasks come first and which come later.
- Overlap. Which tasks run at the same time.
- Duration. Which tasks take the longest.
- The finish date. When the whole project ends.
Microsoft describes the use case simply: to "show status for a simple project schedule." That is where a Gantt chart in PowerPoint works best. It suits status updates, kickoff decks, and steering meetings, where people need the plan on one slide.
For large projects with hundreds of tasks and dependencies, a project management tool is a better fit. A slide can hold about 8 to 15 tasks before the labels get too small to read.
Choose a method: chart, table, or template
There are three common ways to build a Gantt chart in PowerPoint.
| Method | How it works | Best for |
|---|---|---|
| Stacked bar chart | A chart with hidden start bars and visible duration bars | Accurate dates that update when data changes |
| Table with shaded cells | A table where each column is a week and cells are filled in | Quick, rough plans |
| Template | A ready-made Gantt layout you edit | Teams that reuse one design |
This guide uses the stacked bar chart. It is the only method where bar lengths come from real dates, so the chart stays accurate when the plan changes.
Microsoft also offers free Gantt chart templates. Its support page notes that a Microsoft 365 subscription "offers Gantt chart templates designed to help you track project tasks." Templates are a good start if you want a styled layout and do not need date math.
Prepare your task data
A stacked bar Gantt chart needs three columns of data:
| Task | Start date | Duration (days) |
|---|---|---|
| Task name | The first day of the task | The number of days it takes |
Keep these rules in mind:
- Use real dates in the start column. Excel stores dates as numbers behind the scenes, which is what lets the bars line up on a timeline.
- Use numbers in the duration column. Enter 5, not "5 days."
- List tasks in time order. Put the first task at the top of the worksheet.
- Keep task names short. Long names push the bars to the right and shrink the timeline.
If your plan lists end dates instead of durations, add a helper column in Excel. Subtract the start date from the end date, then add 1 if the end day counts as a working day. Use that result as the duration.
Insert a stacked bar chart in PowerPoint
Microsoft's PowerPoint help says: "To create a simple chart from scratch in PowerPoint, click Insert > Chart and pick the chart you want." Here are the steps for a Gantt chart:
- Open the slide where the chart should go.
- Select Insert > Chart.
- Select Bar on the left, then choose Stacked Bar.
- Select OK. A worksheet opens with sample data.
- Replace the sample categories with your task names.
- Put the start dates in the first series column and the durations in the second.
- Delete any extra sample columns or rows, then close the worksheet.
At this point the chart looks odd. Each bar has two colors, and the timeline starts at a very large number. The next two sections fix both problems.
If the start dates show as long numbers in the worksheet, that is normal. Format the column as Short Date so the cells are easier to check.
Hide the start bars and reverse the task order
The first series, the start dates, only pushes each bar to the right place. It should be invisible.
Microsoft's Gantt guide describes the fix. Click "the first data series (the Start part of the bar in blue)." Then, on the Format tab, select Shape Fill > No Fill. Now only the duration bars show, floating at the right dates.
Next, fix the task order. Bar charts plot the first row at the bottom, so your first task appears last. To reverse it:
- Select the vertical axis that lists the tasks.
- On the Format tab, select Format Selection.
- Under Axis Options, select the Categories in reverse order check box.
Microsoft's chart help lists the same option: "For categories, select the Categories in reverse order check box." The first task now sits at the top, as readers expect.
Delete the legend while you are here. A Gantt chart does not need one, and Microsoft's guide suggests removing the legend or title if you do not need it.
Fix the date axis
The horizontal axis in a bar chart is the value axis. By default, it starts at zero, which Excel treats as a date in 1900. Your bars end up squeezed against the right edge.
To fix it, set the axis bounds to your project dates:
- Select the horizontal axis at the top or bottom of the chart.
- Select Format Selection to open the Format Axis pane.
- Under Bounds, type the project start date in Minimum as a number.
- Type a date a few days after the last task in Maximum.
Microsoft's axis help explains the boxes: "type a different number in the Minimum box or the Maximum box." You can select Reset to undo a change.
To find a date's number, type the date in an Excel cell and change the format to General. For example, January 4, 2027 becomes 46391.
Then set the Major unit to 7 so gridlines fall every week. Change the axis number format to a short date, such as "mmm d," so labels read as dates.
Format the chart for a slide
A Gantt chart on a slide needs to read from the back of a room. These changes help:
- Make bars thicker. Select the duration series and reduce Gap Width to about 40%.
- Use one main color. Highlight late or critical tasks in a second color.
- Add a today line. Draw a thin vertical line or a shape at the current date.
- Label key milestones. Add a data label or a short text box for launch dates.
- Write a finding as the title. For example, "Launch on track for February 15."
- Remove clutter. Delete the chart title inside the chart if the slide title says enough.
To add gridlines or labels, use the Chart Elements button next to the chart. Microsoft says it lets you "show, hide, or format things like axis titles or data labels."
If you reuse the design, save it. Microsoft's guide says you can right-click the chart and select Save as Template.
A worked example: a website launch plan
Here is a full example. A marketing team plans a website launch for early 2027. The plan has seven tasks:
| Task | Start date | Duration (days) | Ends on |
|---|---|---|---|
| Research | Jan 4, 2027 | 5 | Jan 8 |
| Wireframes | Jan 11, 2027 | 7 | Jan 17 |
| Content | Jan 13, 2027 | 10 | Jan 22 |
| Design | Jan 20, 2027 | 8 | Jan 27 |
| Build | Jan 28, 2027 | 12 | Feb 8 |
| Testing | Feb 9, 2027 | 5 | Feb 13 |
| Launch | Feb 15, 2027 | 1 | Feb 15 |
The "Ends on" column is for checking only. The chart uses the first three columns.
Follow the steps above. Insert a stacked bar chart and paste the task, start, and duration columns into the worksheet. Set the start series to No Fill and reverse the categories.
For the axis, January 4, 2027 is 46391, so type that in Minimum. February 19, 2027 is 46437, so type that in Maximum. Set Major unit to 7 for weekly gridlines.
The finished chart shows the story at once. Content and Wireframes overlap, and so do Design and Content. Build is the longest task, at 12 days. The project runs from January 4 to February 15.
A good slide title states that finding: "Website launch: six weeks, with Build as the longest step."
Update the chart when the plan changes
Plans change every week, so the chart needs to change with them. Because the bars come from the worksheet, updates are quick.
To change a task, right-click the chart and select Edit Data. Change the start date or duration, then close the worksheet. The bar moves on its own.
To add a task, insert a new row in the worksheet inside the chart's data range. If the new row sits outside the range, drag the range handle to include it.
If the plan lives in an Excel file that your team updates, build the chart in Excel instead. Microsoft's PowerPoint help says this "is also the best way if your data changes regularly." When you paste the chart into PowerPoint, keep it linked to the original Excel file. The chart then reflects the latest dates.
Linked charts need the source file to refresh. Before you send the deck to people outside your team, paste a normal copy so the chart does not break.
Keep an eye on the axis too. If the project end date moves, update the Maximum bound so the last bar still fits.
Make a Gantt chart in PowerPoint with AI
Building the chart takes a few minutes once the data is clean. The slow part is usually the data: pulling tasks from a project export, fixing dates, and working out durations.
An AI tool can do that preparation and build the slides for you. Here is the method in three steps, using Powerdrill Bloom.
Step 1: Upload your Excel, CSV, or PDF file
Upload the file that holds your plan, such as a task export from a project tool or a planning workbook. The Excel to PPT page says you can create slides "from any topic, Excel, CSV or PDF."
Make sure each task has a start date and either an end date or a duration.

Step 2: Ask for the Gantt chart in natural language
Describe the chart you need. For example: "Build a Gantt chart of these tasks by week, and highlight tasks that end after February 1." Add any milestones you want labeled.
Ask it to list the longest task and any overlaps in a short summary. That summary can become the slide title.
Step 3: Pick your slides and export to PowerPoint
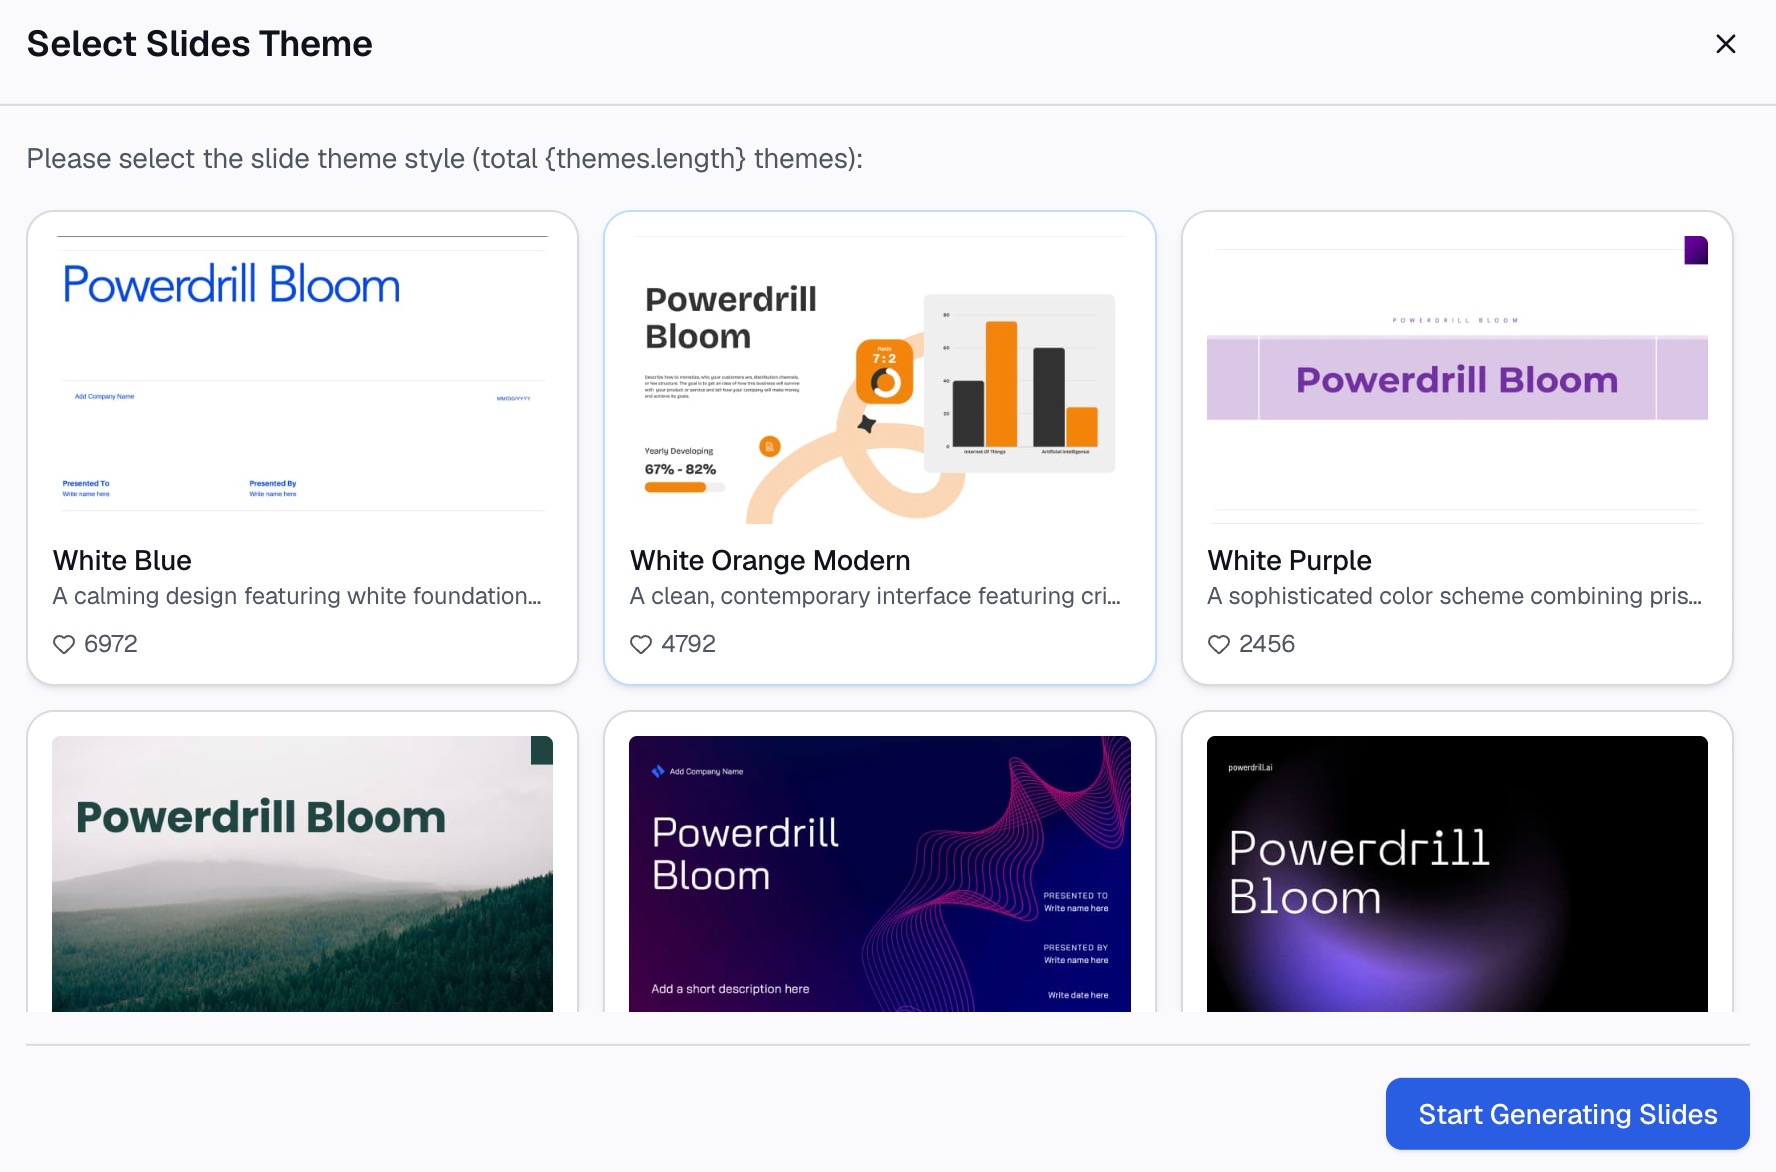
Choose the slides you want to keep, pick a theme, and generate the deck. The page says you can "export to PowerPoint in one click."
Open the file in PowerPoint and check each start date against your source. Adjust colors and the axis with the formatting steps above.
Common mistakes to avoid
These are the problems that come up most often with a Gantt chart in PowerPoint.
- Visible start bars. Set the start series to No Fill, or the chart shows two bars per task.
- Tasks upside down. Select Categories in reverse order so the first task is on top.
- An axis that starts in 1900. Set the Minimum bound to your project start date.
- Durations typed as text. "5 days" will not plot; enter 5.
- Too many tasks. Group small tasks into phases if you have more than 15 rows.
- No finding in the title. Say what matters, such as a risk or a deadline.
- Stale dates. Update the worksheet before each meeting, and note the "as of" date on the slide.
- Mixed units. Keep every duration in days, not a mix of days and weeks.
For a simpler schedule without bars, see our guide on how to make a timeline in PowerPoint. To build the chart from a task list with AI, see how to create a Gantt chart with AI.
When your plan sits in a large export, try Powerdrill Bloom to turn it into a ready Gantt slide.
Frequently asked questions
Does PowerPoint have a Gantt chart?
Not as a built-in chart type. You can build one from a stacked bar chart by hiding the start bars, or use a Gantt chart template from Microsoft.
How do I make a Gantt chart in PowerPoint from Excel data?
Enter the task, start date, and duration in the chart's worksheet, or build the chart in Excel and paste it. Then set the start series to No Fill and reverse the categories.
Why does my Gantt chart start in 1900?
The value axis starts at zero, and Excel treats zero as a date in 1900. Set the axis Minimum to your project start date as a number, such as 46391 for January 4, 2027.
How do I show weeks on a Gantt chart in PowerPoint?
Set the axis Major unit to 7. Then format the axis labels as short dates, such as "mmm d," so each gridline marks a week.
How many tasks fit on a Gantt chart slide?
About 8 to 15 tasks read well on one slide. For more, group tasks into phases or split the plan across two slides.
Sources: Microsoft Support, Present your data in a Gantt chart in Excel · Microsoft Support, Use charts and graphs in your presentation · Microsoft Support, Change the plotting order of categories, values, or data series · Microsoft Support, Change the scale of the vertical (value) axis in a chart.