How to Make a Box Plot in Excel: What It Shows
An average tells you where a group sits. It says nothing about how spread out that group is, or whether one value is dragging the whole figure around.
A box plot answers both questions in a shape you can read in two seconds. It is the fastest way to compare several groups when you care about spread as much as position.
This guide covers what a box plot actually displays, how to build one in Excel, and how to read one without over-interpreting it.
What a box plot shows
The statistical reference from NIST describes the purpose precisely. Box plots are "an excellent tool for conveying location and variation information in data sets."
The phrase to hold onto is the next one. They are particularly useful "for detecting and illustrating location and variation changes between different groups of data."
That is the whole use case. One of these charts is mildly informative. Four side by side, one per machine or region or cohort, is where the shape earns its place.
Microsoft's description of the Excel version says the same thing in product terms. A box and whisker chart "shows distribution of data into quartiles, highlighting the mean and outliers."
The five numbers behind the shape
The chart is built from a small set of calculated values, and knowing them makes it readable.
NIST sets out the construction directly. You "Calculate the median and the quartiles (the lower quartile is the 25th percentile and the upper quartile is the 75th percentile)."
The box is then drawn between those quartiles. In NIST's words, "this box represents the middle 50% of the data" — what the handbook calls the body of the data. A line or symbol marks the median inside it.
The whiskers extend outward toward the extremes. The result, as NIST puts it, is that "the box plot identifies the middle 50% of the data, the median, and the extreme points."
| Element | What it represents |
|---|---|
| Bottom of box | Lower quartile, the 25th percentile |
| Line inside box | Median, the 50th percentile |
| Top of box | Upper quartile, the 75th percentile |
| Box height | The interquartile range, holding the middle half |
| Whiskers | Variability beyond the quartiles |
| Separate points | Values outside the whisker range |
Where the whiskers stop
This is the detail that causes the most confusion, because implementations differ.
NIST describes a common variation designed to identify outliers explicitly. You calculate the interquartile range and call it IQ. Four boundaries follow from it. Two sit below the lower quartile, at 1.5 times IQ and 3.0 times IQ beneath it. Two matching boundaries sit above the upper quartile.
The whisker is then drawn not to the minimum, but to the smallest point still above the lower boundary. Points beyond it are drawn separately.
Excel follows this convention. Microsoft's documentation states that whiskers "indicate variability outside the upper and lower quartiles." The same sentence continues, "and any point outside those lines or whiskers is considered an outlier."
So before comparing output from one tool against another, check which whisker rule each used. The boxes will match; the whiskers may not.
How to make a box plot in Excel
Excel has a built-in chart type, and the steps are short.
Microsoft's instructions for this chart start with the data: "Select your data—either a single data series, or multiple data series." Then, "In Excel, select Insert > Insert Statistic Chart > Box and Whisker."
Two notes on data layout, because this is where most attempts fail.
Your data should be raw values, not summary statistics. Excel calculates the quartiles itself, so a column of pre-computed medians produces nonsense.
For multiple groups, put the values in adjacent columns with a header row, or use a category column alongside a value column. Excel reads the grouping from the layout rather than from anything you configure afterward.
Once the chart exists, the mean marker can be shown or hidden through the series options. Turning it on is usually worth it, because the gap between mean and median is itself informative.
The same options panel controls how inner points are displayed. Showing them helps with small groups and clutters the chart with large ones. The right setting depends on how much data sits behind each box.
Building one from raw data
When the data needs cleaning or grouping before it can be charted, the sequence below covers that end to end.
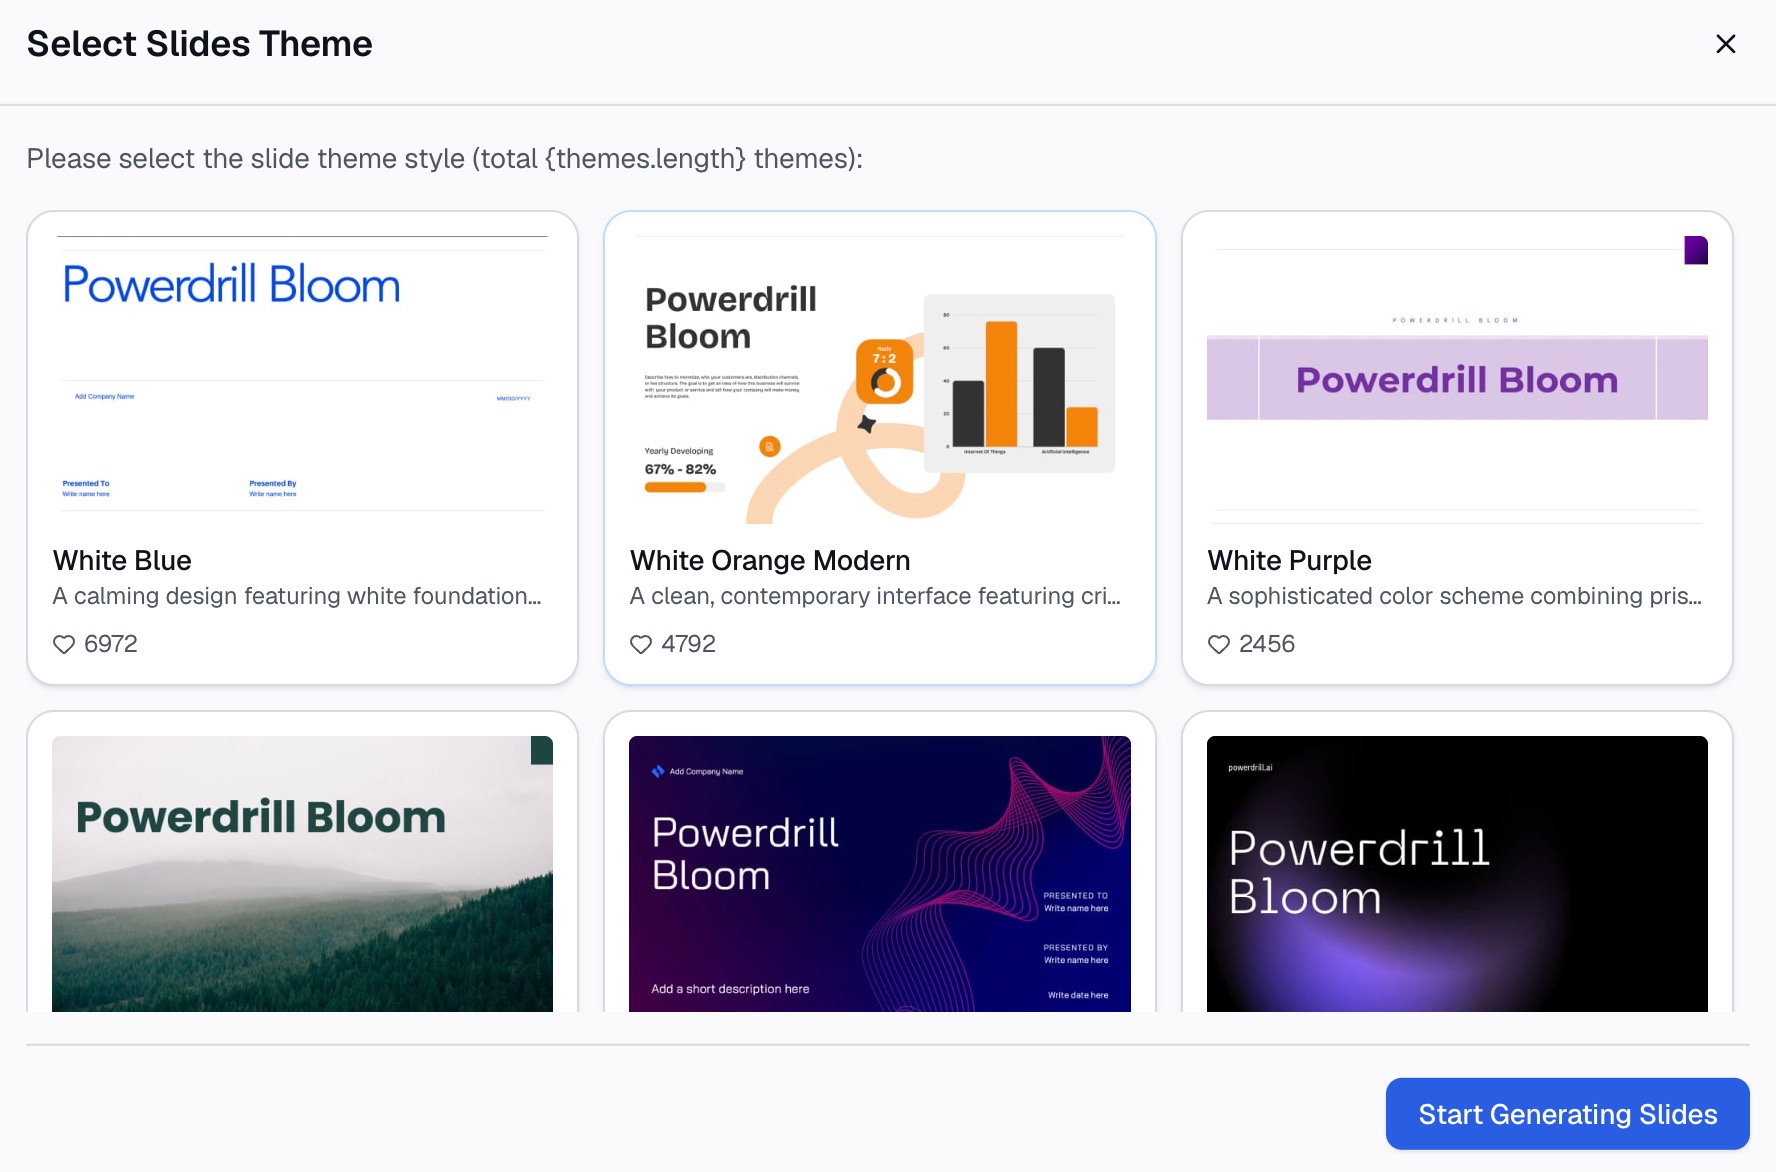
Step 1: Upload the dataset and describe the comparison
Start in Powerdrill Bloom with the CSV or Excel file. Describe the box plot you want in natural language, naming the value to plot and the grouping variable.
Be specific about the grouping. "Delivery time by warehouse" and "delivery time by month" produce different charts from the same file, and only one of them answers your question.
The data may need filtering first: one product line, one quarter, completed orders only. Say so in the same request rather than pre-filtering the file by hand.

Step 2: Check the group sizes before reading anything
A chart with eight observations in one group and eight hundred in another is technically valid and practically misleading. Quartiles from a tiny sample are unstable.
Ask for the count per group alongside the chart. Any group under about twenty observations should be read with caution, and a group under ten is usually better shown as individual points.
This is also the moment to confirm that the value column is numeric throughout. A single text entry in a numeric column silently changes how the groups are calculated.
Step 3: Generate the chart and the supporting numbers
Request the box plot together with the five-number summary per group: minimum, lower quartile, median, upper quartile, maximum, plus the count.
The table matters as much as the chart. A reader who asks "what exactly is the median for the third group" should get an answer without measuring pixels.
Export both, and keep the source file attached so any figure can be traced back when questioned.
Comparing several groups in your own data? Try Powerdrill Bloom.
How to read one
Read the chart in this order, and it will tell you something useful almost every time.
Compare medians first. The line inside each box is the typical value. If those lines sit at different heights, the groups genuinely differ in their central tendency.
Compare box heights second. A tall box means the middle half of that group is spread wide. Two groups with identical medians and very different box heights are not the same story at all.
Check whisker asymmetry third. A whisker much longer on one side indicates skew. The median sitting off-center inside the box says the same thing.
Look at separate points last. These are the values the chart flagged as unusual. They are candidates for investigation, not automatic errors.
One pattern worth naming: if the mean marker sits noticeably above the median, a few large values are pulling the average up. That is exactly the situation where reporting only the average would have misled everyone.
When a box plot is the wrong chart
It is a specialized chart, and it fails in predictable ways.
With one group and no comparison, a histogram usually communicates more. This chart compresses a distribution into five numbers, while a histogram shows its actual shape.
With bimodal data, the summary actively hides the most important feature. Two clusters produce a box that looks unremarkable, and nothing in the chart reveals the gap.
With very small samples, the quartiles move under any single new observation. Plotting the points themselves is more honest.
And with a non-technical audience who has never seen one, expect to spend the first minute explaining the shape rather than the finding. Sometimes a well-labeled range chart lands better.
| Situation | Better choice |
|---|---|
| Comparing spread across groups | Box plot |
| One group, shape of distribution matters | Histogram |
| Suspected two clusters | Histogram or density plot |
| Very small samples | Plot individual points |
| Tracking one group over time | Line chart |
Presenting one to people who have not seen it before
The chart is standard in statistics and unfamiliar almost everywhere else. Three habits close that gap.
Label the axis in the unit people care about — days, dollars, defects per thousand — rather than leaving a generic variable name from the source file.
Put the finding in the title. "Delivery time varies most in the Dallas warehouse" tells a reader what to look at. "Delivery time by warehouse" leaves them to work it out.
Add a one-line legend explaining the box in plain terms. Something like "box holds the middle half of orders; the line is the typical order" costs one line and prevents the most common misreading.
If the audience will see this monthly, the explanation is worth giving properly once. If they will see it once, consider whether a simpler chart carries the same point.
One more thing that helps in a live meeting. Say what the box means before you say what the data shows. People who are still decoding the shape are not listening to the finding.
Comparing groups over time
A frequent follow-up question is how to show change across periods as well as across groups.
The straightforward approach is one box per period, arranged left to right. This works well up to about eight periods, after which the chart gets crowded and the individual boxes get too narrow to read.
Beyond that, a different structure helps. Plot the median as a line over time, and show the interquartile range as a shaded band around it. The information is nearly the same, and the trend becomes legible.
What does not work is mixing both groupings into one chart. A box per warehouse per month produces a wall of boxes that nobody reads. Pick the comparison that matters and chart that one.
If the question is genuinely two-dimensional, small multiples are the honest answer — one small chart per warehouse, each showing months on its horizontal axis.
How this differs from hunting for outliers
A box plot flags unusual points as a by-product of showing distribution. That is related to, but not the same as, going looking for them deliberately.
The distinction is about what you are asking. This chart asks how the groups compare. An outlier investigation asks which specific records are wrong, unusual, or worth a second look. It uses methods beyond quartile rules, including domain checks that no chart performs.
If your goal is the second one, the walkthrough on finding outliers in a dataset without code covers that task directly. Use a box plot when the comparison between groups is the point, and the unusual values are something you notice along the way.
There is also a practical difference in what you do next. An outlier surfaced by a box plot gets investigated. A distribution difference surfaced by the same chart gets explained.
Common mistakes
Charting summary statistics instead of raw values. Excel computes the quartiles, so feeding it pre-computed medians produces a meaningless chart.
Ignoring group sizes. Unequal samples make boxes look comparable when they are not.
Assuming flagged points are errors. The 1.5 times IQR rule is a convention, not a diagnosis. Some flagged values are the most interesting records in the dataset.
Comparing across tools without checking whisker rules. Different implementations extend whiskers differently, and the boxes will agree while the whiskers do not.
Using one where a histogram belongs. A single box plot hides the shape that a single histogram reveals.
Leaving the axis unlabeled. The most common presentation failure, and the easiest to fix.
Reading a box plot as though the box contained most of the data. It contains exactly half. A quarter of the values sit above it and a quarter below, which is easy to forget when the whiskers are short.
Sorting groups alphabetically. Ordering by median instead makes the comparison readable at a glance, and costs nothing.
For related chart work, there are guides to creating a pie chart from Excel data and making beautiful graphs from Excel sheets quickly. For the spread statistic that pairs naturally with this chart, there is calculating standard deviation in Excel.
Frequently asked questions
What is a box plot used for?
It conveys location and variation in a dataset, and it is especially useful for comparing those properties across several groups. NIST describes it as a tool for detecting and illustrating location and variation changes between different groups of data.
How do you read a box plot?
The box spans the middle 50% of the data, from the 25th to the 75th percentile, with a line marking the median. Whiskers show variability beyond the quartiles, and separate points mark values outside that range.
How do I make a box and whisker chart in Excel?
Select your data, either a single series or several. Then choose Insert, Insert Statistic Chart, and Box and Whisker. Supply raw values rather than summary statistics, since Excel calculates the quartiles itself.
Why does my box plot show dots outside the whiskers?
Those are values beyond the whisker range, which Excel treats as outliers. The common rule extends whiskers to 1.5 times the interquartile range beyond each quartile, and anything past that is drawn separately.
What is the difference between a box plot and a histogram?
A box plot summarizes a distribution into five numbers and excels at comparing groups. A histogram shows the full shape of one distribution, including features such as two clusters. A five-number summary describes position and spread rather than shape, so that pattern stays invisible in it.
Sources: NIST/SEMATECH e-Handbook of Statistical Methods, "Box Plot," itl.nist.gov; Microsoft Support, "Create a box and whisker chart."