How to Do a Trend Analysis: 4 Easy Methods in 2026
To do a trend analysis, collect the same metric over regular time periods, chart it, and measure how it changes. Four methods cover most needs: period-over-period change, a moving average, a linear trend line, and the compound annual growth rate (CAGR). Use them together, then explain what drives the trend before you act on it.
This guide explains what a trend analysis is, walks through the four methods with Excel formulas, and works through a full example. It also shows a faster way to run a trend analysis with AI.
What a trend analysis is
A trend analysis looks at how a number changes over time. The goal is to tell a real direction apart from normal ups and downs.
Businesses use trend analysis for many questions:
- Sales and revenue. Is growth speeding up or slowing down?
- Costs. Which expense lines are rising faster than revenue?
- Customers. Are churn, sign-ups, or order values moving in a steady direction?
- Operations. Are delivery times, error rates, or ticket volumes improving?
- Finance. How do margins and ratios change across several years?
A trend analysis does not predict the future on its own. It describes the past in a way that makes the next decision clearer. When you extend a trend forward, treat the result as an estimate.
What you need before you start
A trend analysis is only as good as its data. Check these points first.
- One metric, defined the same way throughout. If the definition of "revenue" changed halfway, the trend is not real.
- Regular periods. Use months, quarters, or years, and keep the gaps equal.
- Enough history. At least 12 monthly points, or three to five years for an annual view.
- A comparison period. The same months last year help you separate a trend from seasonality.
- Notes on one-off events. A price change, a big order, or an outage can explain a spike.
Put the data in two columns: the period and the value. One row per period makes every method below easier. Sort the rows from oldest to newest, and fill any missing period before you start.
Method 1: Period-over-period change
The simplest method compares each period with an earlier one. Two versions are common.
Month-over-month (MoM) or quarter-over-quarter (QoQ). This shows short-term movement. The formula is (this period − last period) ÷ last period.
Year-over-year (YoY). This compares a period with the same period a year earlier. It removes most seasonal effects, which makes it the most common trend measure in business reports.
In Excel, if this month's value is in B13 and the same month last year is in B1, the YoY change is =(B13-B1)/B1. Format the cell as a percentage.
Read period-over-period changes with care. A single month can swing for reasons that have nothing to do with the trend. Look for a run of changes in the same direction.
Method 2: Moving average
A moving average smooths out short-term noise. Each point is the average of the last few periods.
A three-month moving average for March is the average of January, February, and March. For April, you drop January and add April. The line moves forward one period at a time.
In Excel, if your values start in B2, put =AVERAGE(B2:B4) in C4 and fill it down. Use three months for fast-moving data and 12 months to remove seasonality.
Moving averages are useful when single months jump around. If the moving average keeps rising while some months dip, the underlying trend is still up.
Method 3: Linear trend line
A linear trend line fits a straight line through your data. It gives the average change per period and lets you extend the line forward.
Microsoft's support page explains how Excel's TREND function works. It "fits a straight line (using the method of least squares) to the array's known_y's and known_x's." In plain terms, it finds the line that sits closest to all your points.
You can use two Excel functions:
- TREND. Returns values along the fitted line for each period.
- FORECAST.LINEAR. Predicts a value for a future period. Microsoft says you can use it "to predict future sales, inventory requirements, or consumer trends."
For example, with periods 1 to 12 in A2:A13 and values in B2:B13, =FORECAST.LINEAR(13,B2:B13,A2:A13) estimates period 13. You can also add a trendline to a line chart in Excel.
A straight line suits steady growth. It fits poorly when growth speeds up, slows down, or follows a strong season.
Method 4: Compound annual growth rate
The compound annual growth rate, or CAGR, turns several years of growth into one yearly rate. It is the best way to summarize a long-term trend in one number.
The formula is (ending value ÷ starting value) ^ (1 ÷ number of years) − 1. In Excel, with the start in B2, the end in B5, and three years between them, use =(B5/B2)^(1/3)-1.
CAGR assumes steady growth between the two points. It hides the path in between, so pair it with a chart. Two companies can share the same CAGR while one grew smoothly and the other swung wildly.
Which method to use for which question
Each method answers a different question. Pick the one that matches what you need to know, and add a second method as a check.
"Are we growing faster or slower than last year?" Use year-over-year change. It compares like with like, so seasons do not distort the answer. Look at the YoY figures for the last six months. A rising run means growth is speeding up.
"Is this dip a real problem?" Use a moving average. If the three-month average is still rising, one weak month is probably noise. If the average turns down for two or three months in a row, look for a cause.
"Where will we be next quarter if nothing changes?" Use a linear trend line. It gives a simple baseline for planning. Treat it as a starting point and adjust for known events, such as a price change or a product launch.
"How fast have we grown over several years?" Use CAGR. It turns a long history into one number you can compare with a target, a competitor, or a market growth rate.
"Which of our products or regions is driving the trend?" Run the same method on each segment. A total can rise while one segment falls. Splitting the data shows where to act.
Most reports use two or three methods together. A common set is a line chart with a moving average, a table of YoY changes, and one CAGR figure in the summary. That gives readers the picture, the detail, and the headline in one place.
If you only have time for one method, start with year-over-year change. It is easy to explain, it handles seasons, and most readers already know how to read it.
How to do a trend analysis with AI
Running these four methods by hand is slow when you have many metrics. You build columns, write formulas, and make charts for each one. An AI tool can do the calculations and charts from your file.
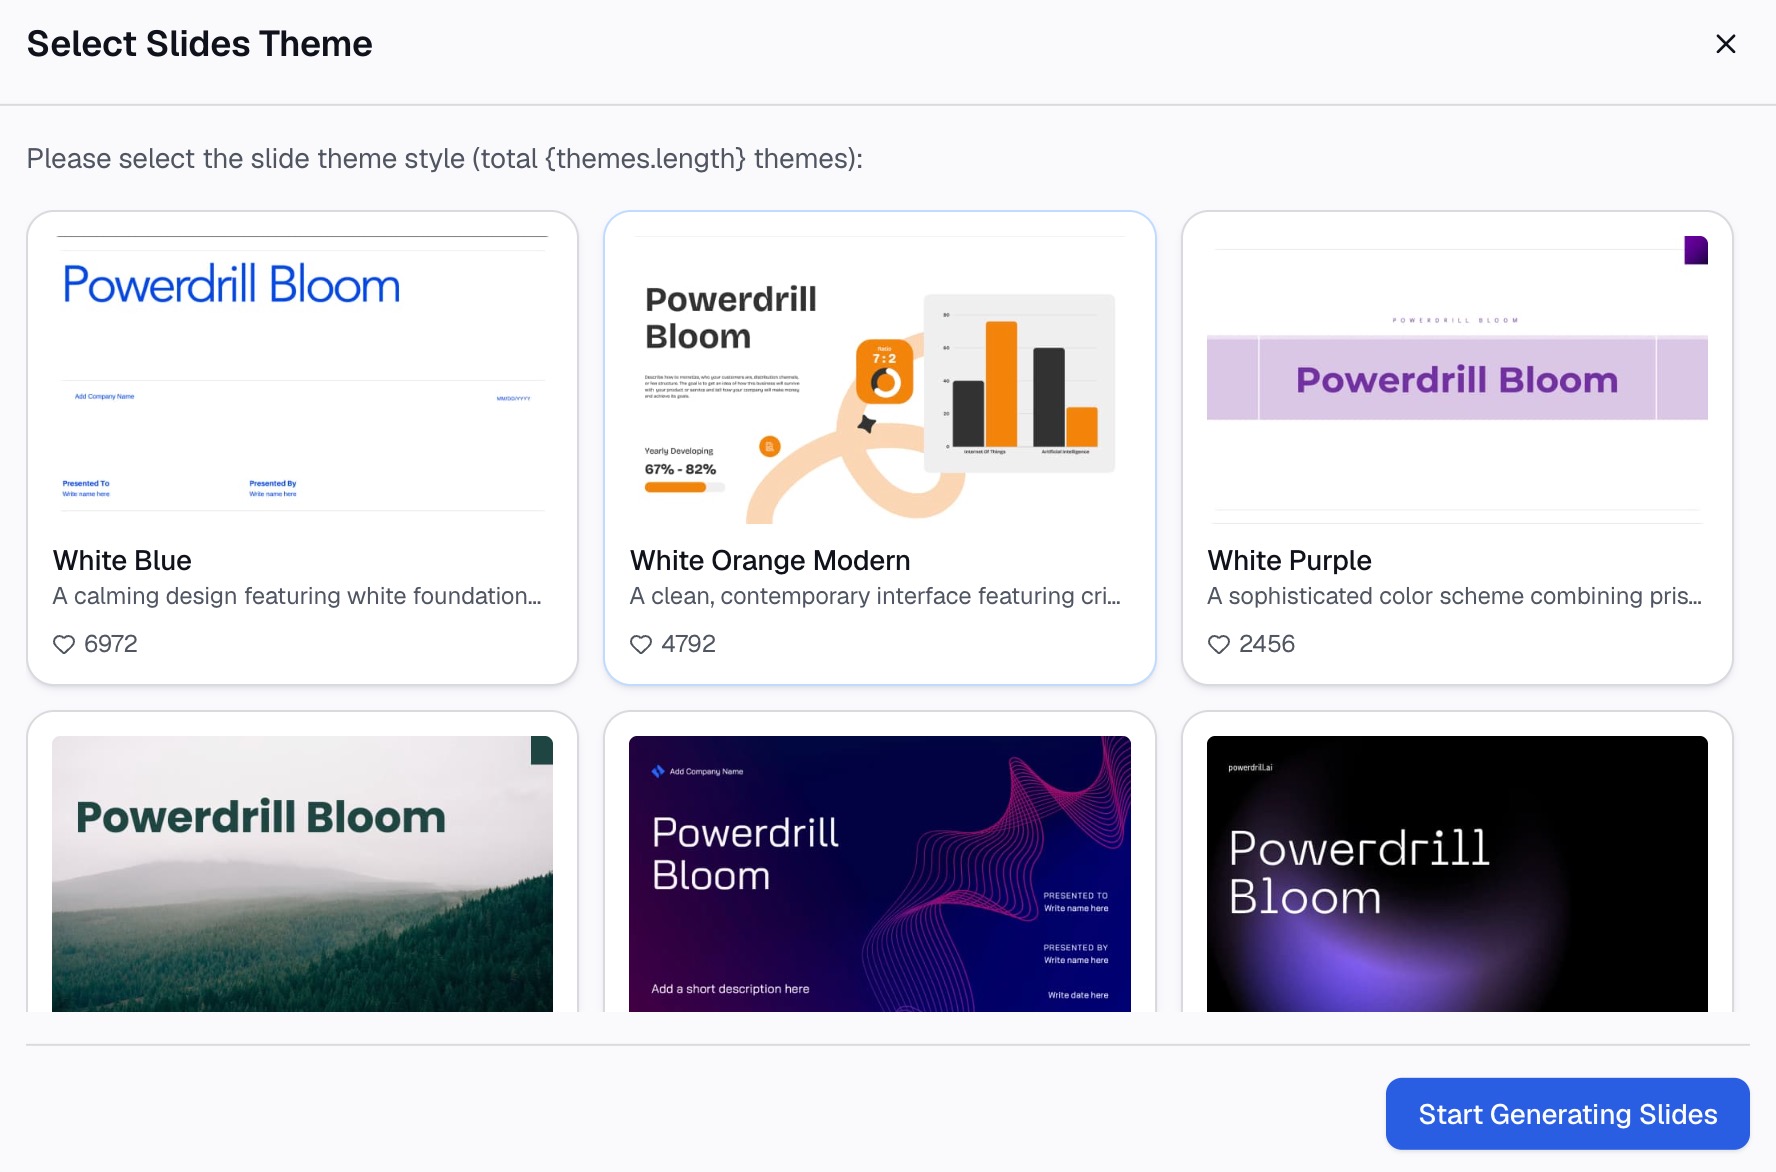
Here is the method in three steps, using Powerdrill Bloom.
Step 1: Upload your time-series data
Start with a file that has one row per period. Excel, CSV, and PDF files all work. If you have several metrics, keep each in its own column with a clear name.
For financial statements, the AI Financial Analysis Tool lists "Multi-period trend lines across the financials with QoQ and YoY change." For other metrics, the Line Graph Creator turns raw data into line graphs.

Step 2: Ask for the trend in natural language
Describe the analysis you want. For example: "Show monthly sales for the last 12 months with a three-month moving average. Add the year-over-year change for each month, a linear trend line, and the three-year CAGR. Flag any month that moved more than 10% from the trend."
The tool runs the calculations and returns charts with a short summary. If you need a forward view, the AI Forecasting Tool offers a "Forecast chart with confidence bands and seasonality decomposition."
Step 3: Check the numbers and export the trend report
Check a few results against your own math before you share them. The homepage says "Every number comes back with the page, the row and the figure behind it," so you can trace each figure.
Then export the charts and summary as a report or slides. If the analysis ends up in a deck, the Excel to PPT tool builds slides from the same file.
A trend analysis example
Here is a worked example for a made-up online store, Juniper Home. The table shows monthly sales in 2025, in thousands of dollars, with 2024 for comparison.
| Month | 2025 sales | 2024 sales | YoY change | 3-month moving average |
|---|---|---|---|---|
| Jan | $120K | $110K | 9.1% | — |
| Feb | $115K | $104K | 10.6% | — |
| Mar | $130K | $118K | 10.2% | $121.7K |
| Apr | $128K | $117K | 9.4% | $124.3K |
| May | $135K | $121K | 11.6% | $131.0K |
| Jun | $142K | $126K | 12.7% | $135.0K |
| Jul | $138K | $125K | 10.4% | $138.3K |
| Aug | $150K | $133K | 12.8% | $143.3K |
| Sep | $155K | $137K | 13.1% | $147.7K |
| Oct | $149K | $134K | 11.2% | $151.3K |
| Nov | $168K | $150K | 12.0% | $157.3K |
| Dec | $182K | $160K | 13.8% | $166.3K |
Here is what each method shows:
- Period-over-period. Four months dipped from the month before: February, April, July, and October. But every month beat the same month in 2024. Full-year sales were $1.712M, up 11.5% from $1.535M.
- Moving average. The three-month average rose in every month, from $121.7K in March to $166.3K in December. The dips were noise, not a turn.
- Linear trend. A straight line through the 12 months rises about $5.1K per month. It points to about $176K for January 2026.
- CAGR. Annual sales were $1.180M in 2022 and $1.712M in 2025. That is a CAGR of about 13.2% over three years.
The YoY changes also tell a story. Growth was about 9% to 10% early in the year and 12% to 14% late in the year. The trend is not just up; it is speeding up. A good next step would be to split the sales by product line. That would show which products drive the faster growth in the second half.
How to read and present a trend
Numbers alone do not explain a trend. Before you share the analysis, add context.
Name the drivers. For each trend, list two or three causes. In the example, Juniper Home might point to a new product line and higher repeat orders.
Separate trend from season. Compare with the same months last year, or use a 12-month moving average. A December spike is often seasonal, not a new trend.
Mark one-off events. Note big orders, price changes, or outages on the chart. They explain sudden jumps.
Show the right chart. Use a line chart for trends over time. Add the moving average as a second line. Our guide on how to make a line graph covers the options.
State the confidence. Say how much history the trend rests on. Twelve months is a start. Three years is stronger.
For finance teams, the same approach applies to statements. Our guide to spotting financial trends with AI tools covers margins and ratios.
Common trend analysis mistakes
These mistakes are common and easy to avoid.
Too few data points. Three months cannot show a trend. Use at least 12 monthly points.
Ignoring seasonality. Comparing December with November can mislead. Compare with last December instead.
Changing definitions. If you change how a metric is counted, mark the break on the chart or restate the history.
Reading one month as a turn. A single dip is rarely a trend change. Wait for the moving average to turn.
Trusting a straight line too far. A linear trend line assumes steady change. Extending it many periods ahead adds a lot of error.
Mixing nominal and real values. Over several years, inflation can make flat sales look like growth. Note whether figures are adjusted.
When you are ready to run your next trend analysis on your own data, try Powerdrill Bloom with a 12-month export.
Frequently asked questions
What is a trend analysis?
A trend analysis looks at how a metric changes over time to find a steady direction. It uses methods such as year-over-year change, moving averages, trend lines, and CAGR.
How do you do a trend analysis in Excel?
Put periods and values in two columns. Calculate year-over-year change, add a moving average with AVERAGE, and use FORECAST.LINEAR or a chart trendline for the fitted line. Chart the results.
How many data points do you need for a trend analysis?
Use at least 12 monthly points for a short-term view. For a long-term trend, three to five years of annual data is better.
What is the difference between trend analysis and forecasting?
Trend analysis describes how a metric has moved in the past. Forecasting uses that history, often with seasonality, to estimate future values. A trend line is a simple forecast.
Can AI do a trend analysis?
Yes. An AI tool can calculate the changes, moving averages, and trend lines, then chart them from your file. You still need to check the numbers and explain what drives the trend.
Sources: Microsoft Support, TREND function · Microsoft Support, FORECAST and FORECAST.LINEAR functions.