How to Spot Financial Trends Fast Using AI Tools in 2026
Introduction
In today’s fast-moving economy, spotting financial trends quickly is essential for staying competitive. However, financial professionals often face challenges such as heteroskedasticity, where data volatility changes over time, making traditional forecasting less reliable. Interpreting complex indicators like stochastic oscillators can also be time-consuming when done manually.
AI is transforming financial analysis by processing large datasets in seconds, uncovering hidden patterns, identifying emerging opportunities, and detecting potential risks. With AI-powered insights, businesses and investors can make faster, more informed decisions and respond to market changes before competitors do.
Why Financial Trend Analysis Matters More Than Ever in 2026
Hyper-Connected Global Markets
In today’s digital economy, geopolitical events or supply chain disruptions on one side of the globe impact local markets instantly. Real-time trend analysis is essential to anticipate these ripples and prevent portfolio devastation.
Agile Business Competition
Companies are pivoting faster than ever before. If you cannot spot a sudden shift in your operational costs or a subtle decline in a specific revenue stream, your competitors will quickly outpace you.
Capitalizing on Micro-Trends
Macro-economic cycles are shrinking. The ability to spot short-lived, emerging micro-trends allows businesses and investors to make rapid, high-yield decisions that traditional quarterly reporting would miss completely.
Proactive Risk Mitigation
Early detection of downward trajectories in cash flow, customer retention, or sector health enables organizations to implement proactive hedging strategies rather than reacting out of panic when the damage is already done.
Common Challenges in Identifying Financial Trends
Paralyzing Data Overload
The sheer volume, velocity, and variety of modern financial data make it virtually impossible to analyze manually. Human analysts often suffer from analysis paralysis when staring at thousands of rows in a spreadsheet.
Siloed Information
Crucial financial metrics are frequently scattered across different CRMs, ERP systems, localized spreadsheets, and bank statements, preventing leaders from gaining a cohesive, holistic view of their financial health.
Inherent Human Bias
Even the best analysts suffer from unconscious confirmation bias, inadvertently cherry-picking data points that support their pre-existing financial theories while ignoring contradictory evidence.
Technical Bottlenecks
Traditional data science requires complex SQL queries, Python scripts, or advanced Excel macro skills. This creates a severe bottleneck, delaying the time between data collection and the extraction of actionable business insights.
How AI Tools Detect Financial Trends Faster
Instant Pattern Recognition
Advanced AI models can instantly sift through millions of data points to find hidden correlations and historical trends that would take human analysts weeks of tedious work to discover.
Automated Anomaly Detection
Machine learning algorithms work around the clock to automatically flag unusual spikes in business expenses or sudden, unexplainable drops in revenue, serving as an invaluable early warning system.
Natural Language Processing (NLP)
Instead of writing complex code or formulas, users can simply ask conversational questions about their financial data (e.g., "What caused the revenue dip in March?") and receive immediate, chart-backed answers.
Predictive Analytics
By analyzing massive sets of historical data, AI can project future financial trajectories with high accuracy, effectively transitioning financial teams from backward-looking descriptive reporting to forward-looking predictive forecasting.
Step-by-Step: How to Spot Financial Trends with AI
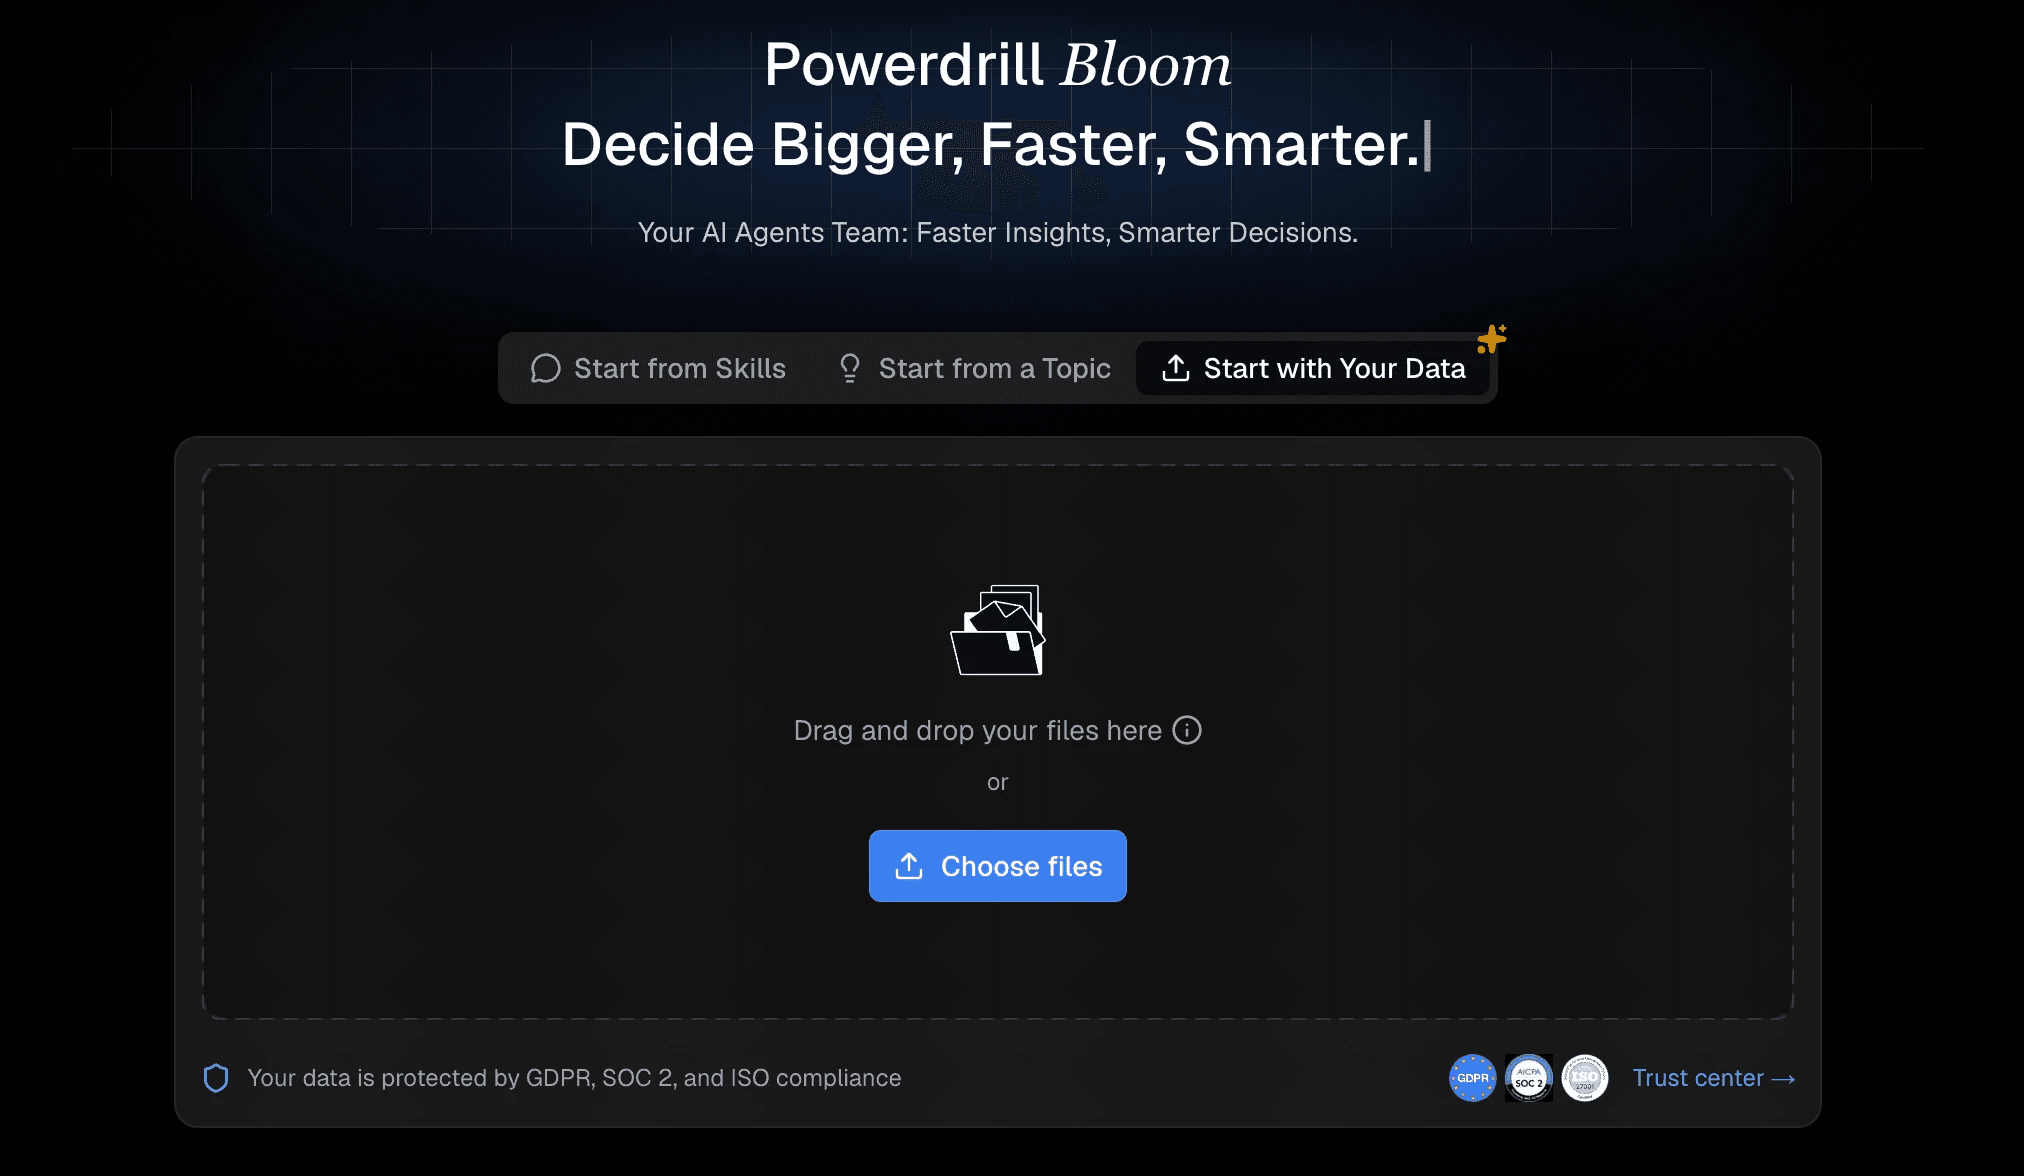
Spotting trends no longer requires a degree in data science. Modern AI platforms have gamified and simplified the process. Here is how you can uncover financial insights in minutes using Powerdrill Bloom, a leading AI-driven data analysis and visualization tool.
Step 1: Upload or Connect Data
Begin by bringing your data into the platform. With Powerdrill Bloom, you can simply drag and drop your massive CSV files, Excel spreadsheets, or directly connect to your existing databases. The platform utilizes enterprise-grade encryption, ensuring your sensitive financial data remains completely secure and private from the moment of upload.
Step 2: Explore the Data
Once uploaded, you do not need to manually clean the rows. Powerdrill Bloom’s AI instantly scans your dataset, identifies column headers, rectifies formatting errors, and provides a high-level summary of your financial landscape. It prepares the raw numbers for deep analysis automatically.
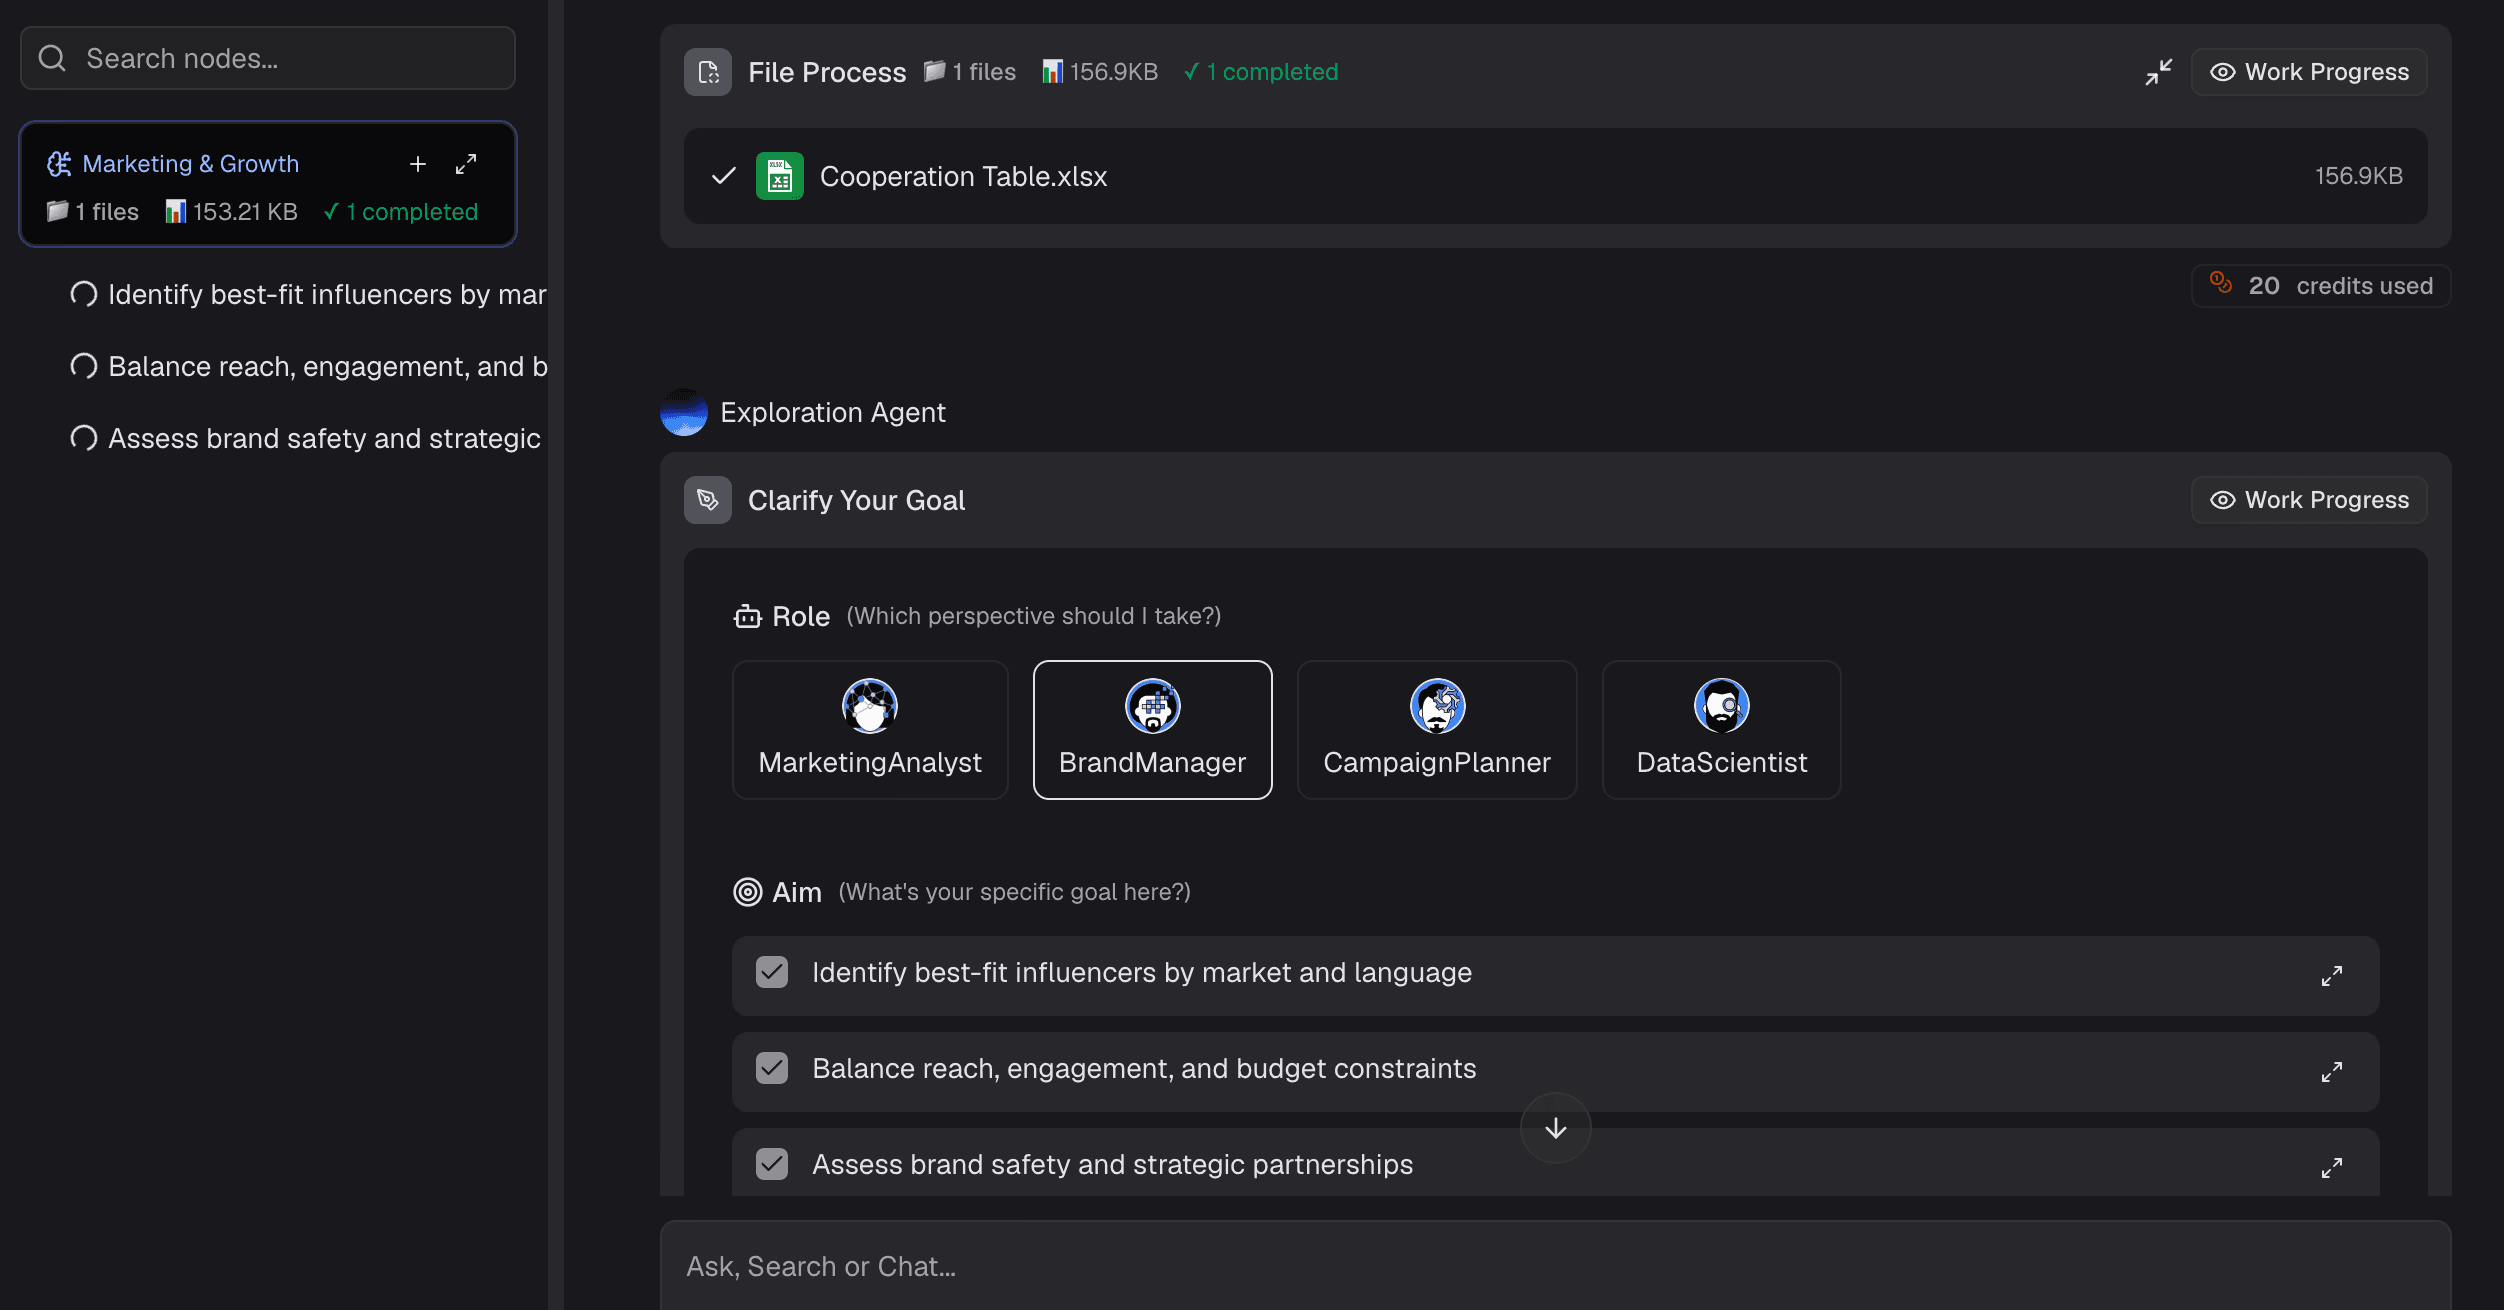
Step 3: Ask Natural Language Questions
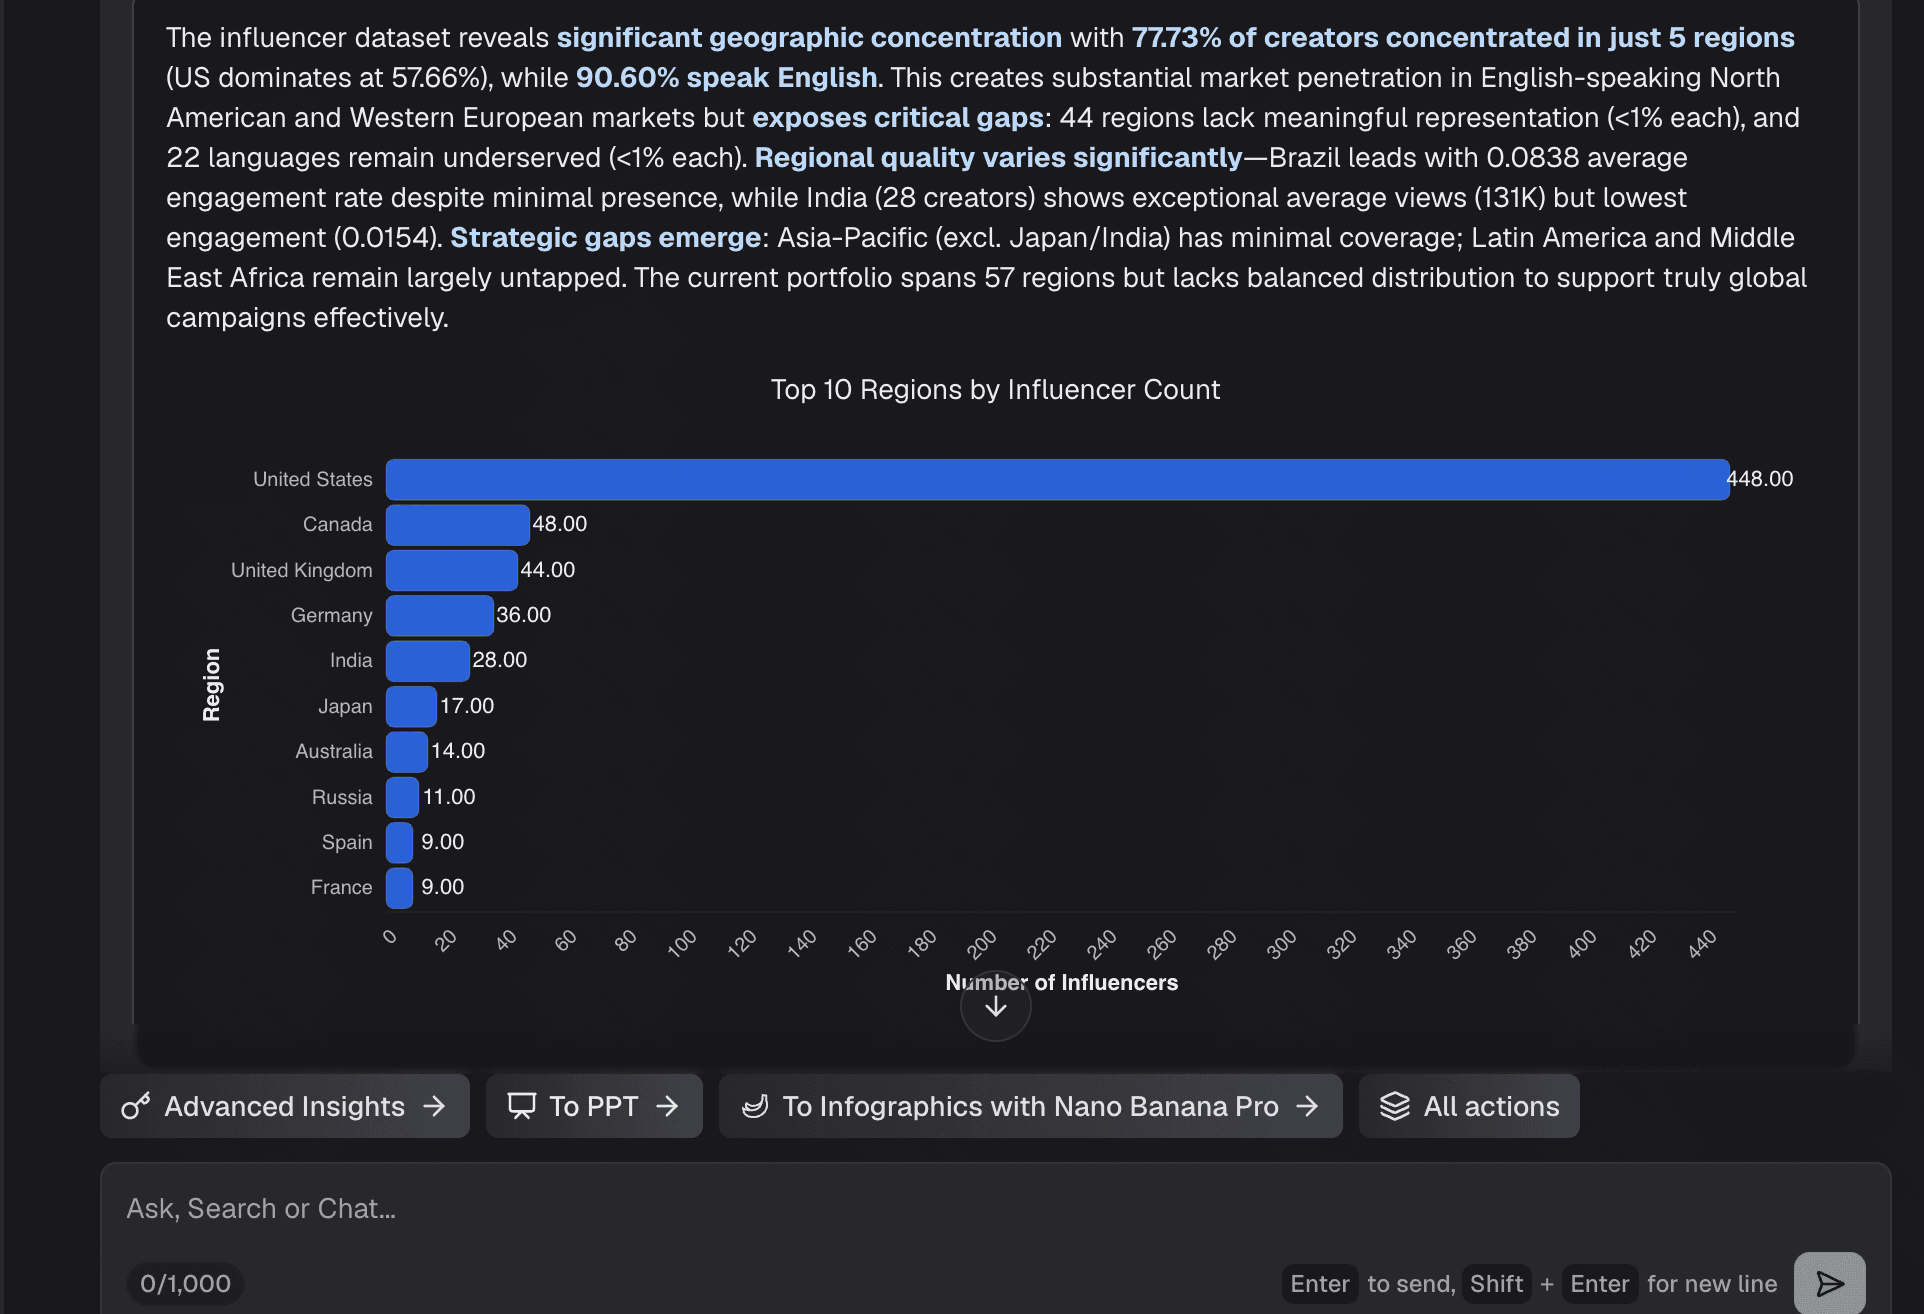
This is where the magic happens. Instead of building pivot tables, you just type questions into the chat interface. You can ask Powerdrill Bloom things like "Map influencer coverage across regions and languages."
Step 4: Review and Generate AI-Generated Insights
Within seconds, Powerdrill Bloom processes your query and generates highly accurate, beautifully formatted, and interactive charts. It doesn't just give you a graph; it provides a text-based analytical summary explaining the trend, allowing you to instantly export the visual to a dashboard or a stakeholder presentation.
Best Practices for AI-Powered Financial Analysis
Maintain Strict Data Hygiene: AI is powerful, but it is only as good as the data you feed it. Ensure your financial records are consistently updated, clearly labeled, and free of duplicate entries for the best results.
Ask Highly Precise Prompts: Instead of asking vague questions like "How is our company doing?", use specific parameters. Ask, "What is the month-over-month trend in customer acquisition costs for Q1 compared to Q2?"
Combine AI with Human Intuition: Use AI to do the heavy lifting of detecting outliers and patterns, but always apply your human domain expertise to understand the strategic, real-world context behind the numbers.
Practice Iterative Querying: Treat the AI like a financial consultant. If an initial chart reveals an unexpected drop in profits, ask follow-up questions to drill down into specific sub-categories or regional data to find the root cause.
Conclusion
Financial trend analysis is no longer about crunching numbers in a spreadsheet for hours on end, desperately hoping to spot a hidden pattern. It is about asking the right questions and getting immediate, visual, and highly accurate answers. By leveraging the power of modern artificial intelligence, professionals can bypass technical bottlenecks, eliminate human bias, and make proactive decisions at unprecedented speeds.
If you want to stop wrestling with complex formulas and start making data-driven financial decisions with confidence, it is time to upgrade your toolkit. Transform your raw financial data into clear, actionable, and beautiful insights today. Try Powerdrill Bloom and experience the absolute fastest, zero-code way to master your financial trend analysis!
FAQs
Is my financial data secure with AI tools?
Yes, top platforms like Powerdrill Bloom use enterprise-grade encryption to ensure your financial data remains completely private and secure.
Do I need to know how to code?
Not at all. Modern AI tools rely entirely on natural language, allowing you to generate insights without any programming knowledge.
What types of financial data can I analyze?
You can analyze CSVs, Excel spreadsheets, or database exports covering sales, expenses, cash flow, and market performance metrics easily.
Can AI predict future stock market crashes?
While AI identifies historical patterns and risk factors, no tool can perfectly predict unpredictable black swan events or market crashes.
Why choose Powerdrill Bloom for financial analysis?
It offers intuitive natural language querying, instant chart generation, and automated data cleaning, making financial trend-spotting incredibly fast and effortless.