How to Create a Supplier Scorecard: 5 Easy Steps in 2026
Two procurement teams publish a supplier scorecard. One weights on-time delivery at 40%. The other weights it at 20%.
Both weightings come from published industry guidance. Neither is wrong, and the same supplier can score 93 on one card and 86 on the other.
That is the thing to understand before you build anything. A supplier scorecard is not a standard measurement. It is your operating priorities, written as arithmetic.
This guide covers what the scorecard is for and the five steps to build one. It also covers why on-time delivery is the hardest line to define, and how to produce the card from your own exports.
What a supplier scorecard is for
The purpose is consistency, not judgement by numbers.
Without one, supplier performance gets discussed from memory. SourceDay's guide to supplier scorecards notes that performance "often becomes subjective" without structured evaluation. Different teams end up holding different views of the same relationship.
A scorecard replaces that with the same metrics applied the same way. Most cards, in SourceDay's description, combine delivery, quality, service and financial performance.
Keep the ambition modest at first. SPS Commerce's guide to building one advises that more than 20 metrics "may dilute focus for suppliers." It recommends 8 to 15 metrics that drive real business priorities.
One framing is worth holding onto. SPS calls scorecards "frameworks for informed judgment, not replacements for critical thinking."
The five steps
1. Pick eight to fifteen metrics
Draw from four groups so the card stays balanced. Delivery, quality, responsiveness, and cost.
SPS Commerce publishes a workable starter list. On-time delivery rate, order fill rate, defect rate, invoice accuracy, return rate, advance ship notice accuracy, item data accuracy, and one strategic alignment measure.
Choose them with the people who feel the pain. SPS suggests convening procurement, warehouse operations, quality, category management and finance, and having each name three to five supplier behaviours that most affect operations.
Then cut. Every metric you keep is a data pull you will repeat every quarter.
2. Write the measurement rules before you count anything
This step gets skipped, and skipping it is why scorecards get disputed in supplier meetings.
SPS Commerce lists five things to document per metric. The calculation method, the data source, the measurement frequency, the exclusions, and the minimum sample size.
Exclusions need a decision, not a shrug. SPS gives natural disasters and specification errors as examples of what may not count against a supplier.
Sample size needs one too. Its example threshold is 50 or more units, or three months of history, before a score means anything.
3. Score each metric on one scale
Convert every metric to the same range so they can be combined. A 0 to 100 scale is the usual choice.
Set the target from your own history rather than an aspiration. SPS gives the method directly: if 80% of your suppliers already achieve 95% on-time delivery, that is your baseline.
Differentiate targets where the supply base genuinely differs. A private label supplier and a national brand do not face the same constraints.
4. Weight the metrics to 100% and compute one score
This is the step that encodes your priorities, and there is no standard answer.
SourceDay publishes one example: on-time delivery 40%, quality 25%, lead time reliability 20%, responsiveness 15%.
SPS Commerce publishes a flatter one across eight metrics, with on-time delivery at 20% and strategic alignment at 5%.
Pick the shape that matches your operation. Delivery reliability deserves heavy weight for production-critical parts, and cost accuracy deserves more where margins are thin.
Compute the weighted total with SUMPRODUCT, which multiplies the score row by the weight row in one pass.
5. Publish it with the trend and a review cadence
A single score is a snapshot. The trend is what changes behaviour.
SourceDay describes the common cadence as monthly for critical suppliers, quarterly for strategic ones, and annually for long-term evaluation. SPS lands on quarterly scoring as the balance point, while tracking critical metrics monthly.
Give suppliers a running start. SPS recommends a 60 to 90 day baseline period before scores count officially.
And invite the return fire. SPS names one-way evaluation as a pitfall, noting that scorecards "should invite feedback about your forecasting accuracy and payment performance."
Why on-time delivery is the hardest line to define
Every scorecard has this metric, and almost no two define it identically.
SPS Commerce asks the question that exposes it. For on-time delivery, "will it be measured by orders, line items, or units?"
Those three produce different numbers from the same data. A partial shipment on a ten-line order is one late order, or one late line, or a few hundred late units.
The second question is the grace period. SPS asks whether you will allow one, and the answer changes the score for every supplier at once.
Then there is the date you measure against. A requested date and a confirmed date are different commitments, and scoring against the wrong one either flatters or punishes the supplier unfairly.
Write the answer down once. A metric that cannot be reconstructed from your notes cannot be defended in a review.
Where the manual route slows down
The first scorecard takes a week. The fourth takes longer, because three things drifted while nobody was looking.
Supplier records split. One supplier appears twice under slightly different names, and its performance is averaged across both halves.
The data sources move. SourceDay notes performance data may come from enterprise systems, purchasing systems, and operational reporting tools. Each of those changes on its own schedule.
Then the exclusions get reapplied by hand. A weather event last February needs excluding, and remembering that becomes somebody's private knowledge.
There is a fourth cost that only shows in a supplier meeting. When a supplier disputes a score, the answer is a definition, and that definition is in a file you did not bring.
The tooling side has its own roundup, in AI tools for supply chain analytics.
How to build it with Powerdrill Bloom
Step 1: Upload your purchasing and receiving exports
Upload the purchase order file and the receipts file together. Powerdrill Bloom profiles the columns on arrival, so duplicate supplier names, missing confirmed dates, and blank quantities surface before any score is computed.
Step 2: Describe the scorecard in natural language
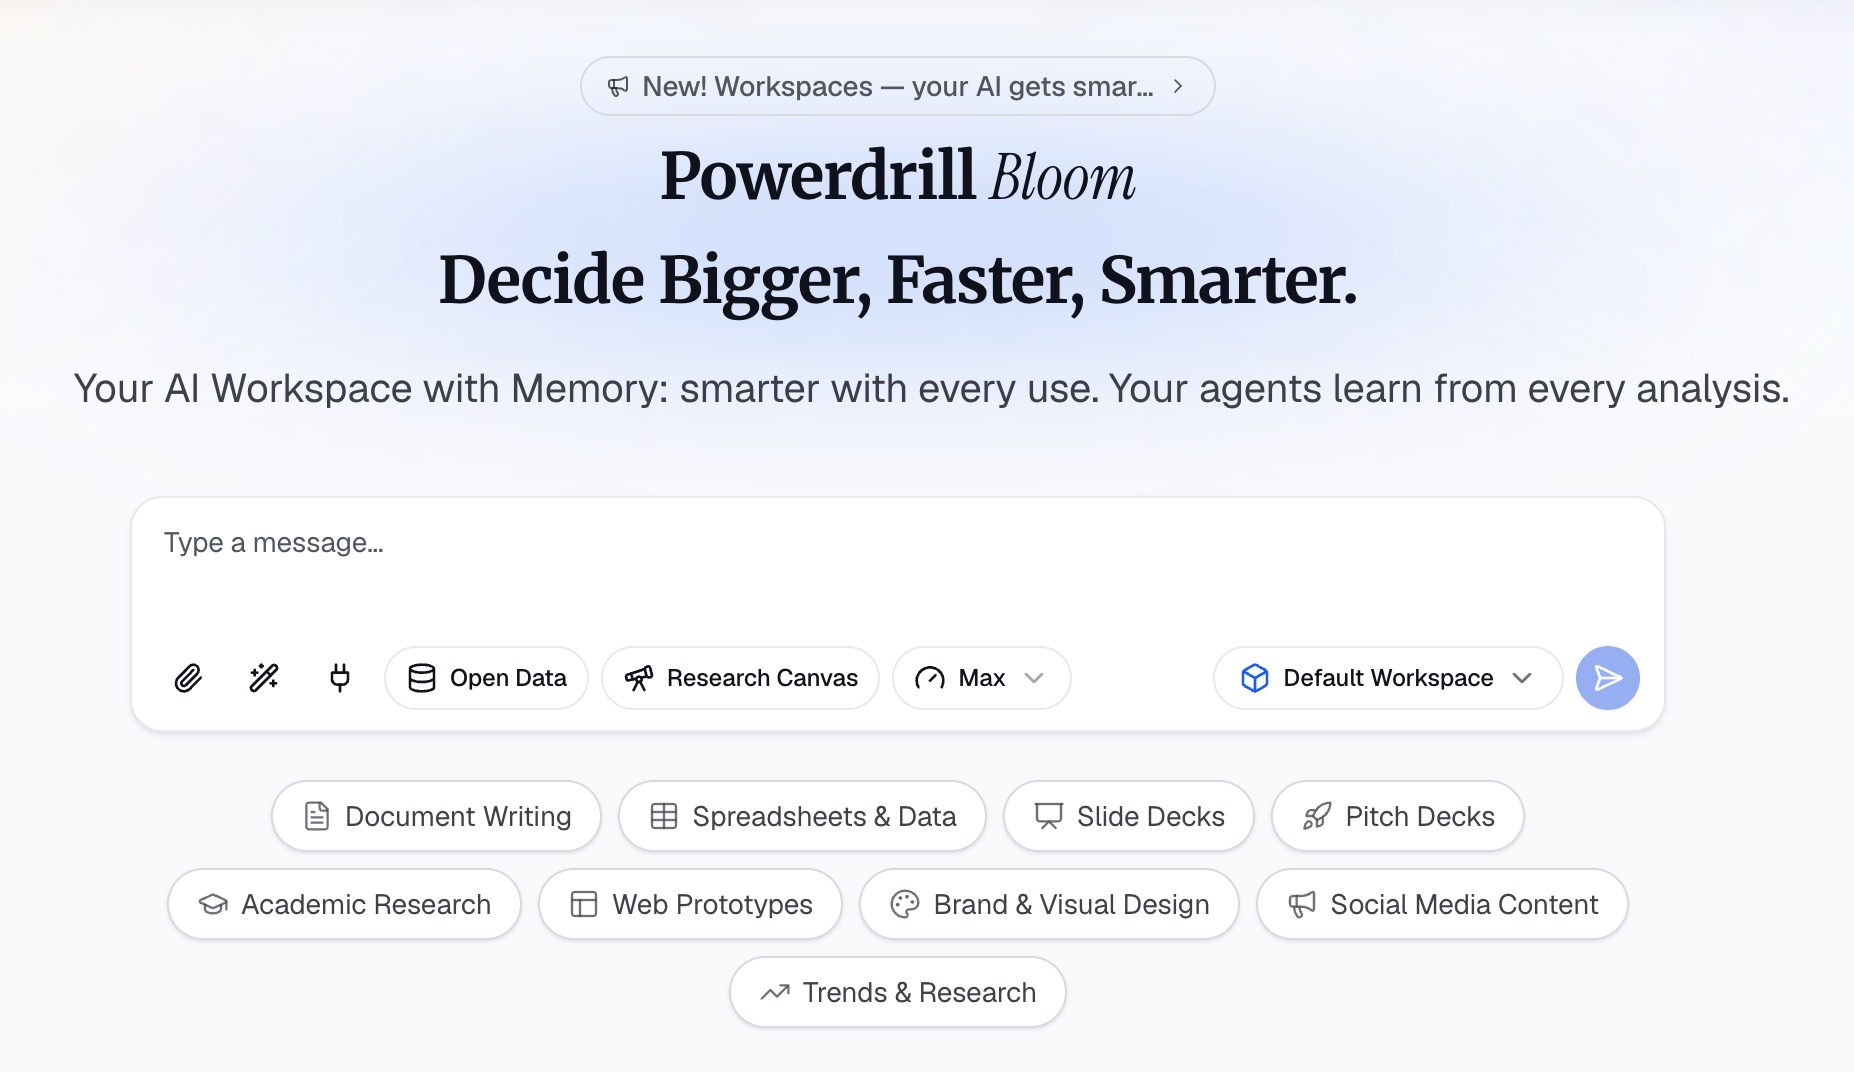
State the rules rather than building them. Name the metrics, the date field to score against, the grace period, the exclusions, and the weights.
Then ask the questions that catch the errors. Ask which supplier names look like duplicates. Ask how many lines have no confirmed date. Then ask for the same scores measured by line and by unit, so you can see how much the choice moves them.
Step 3: Export the chart, report, or deck
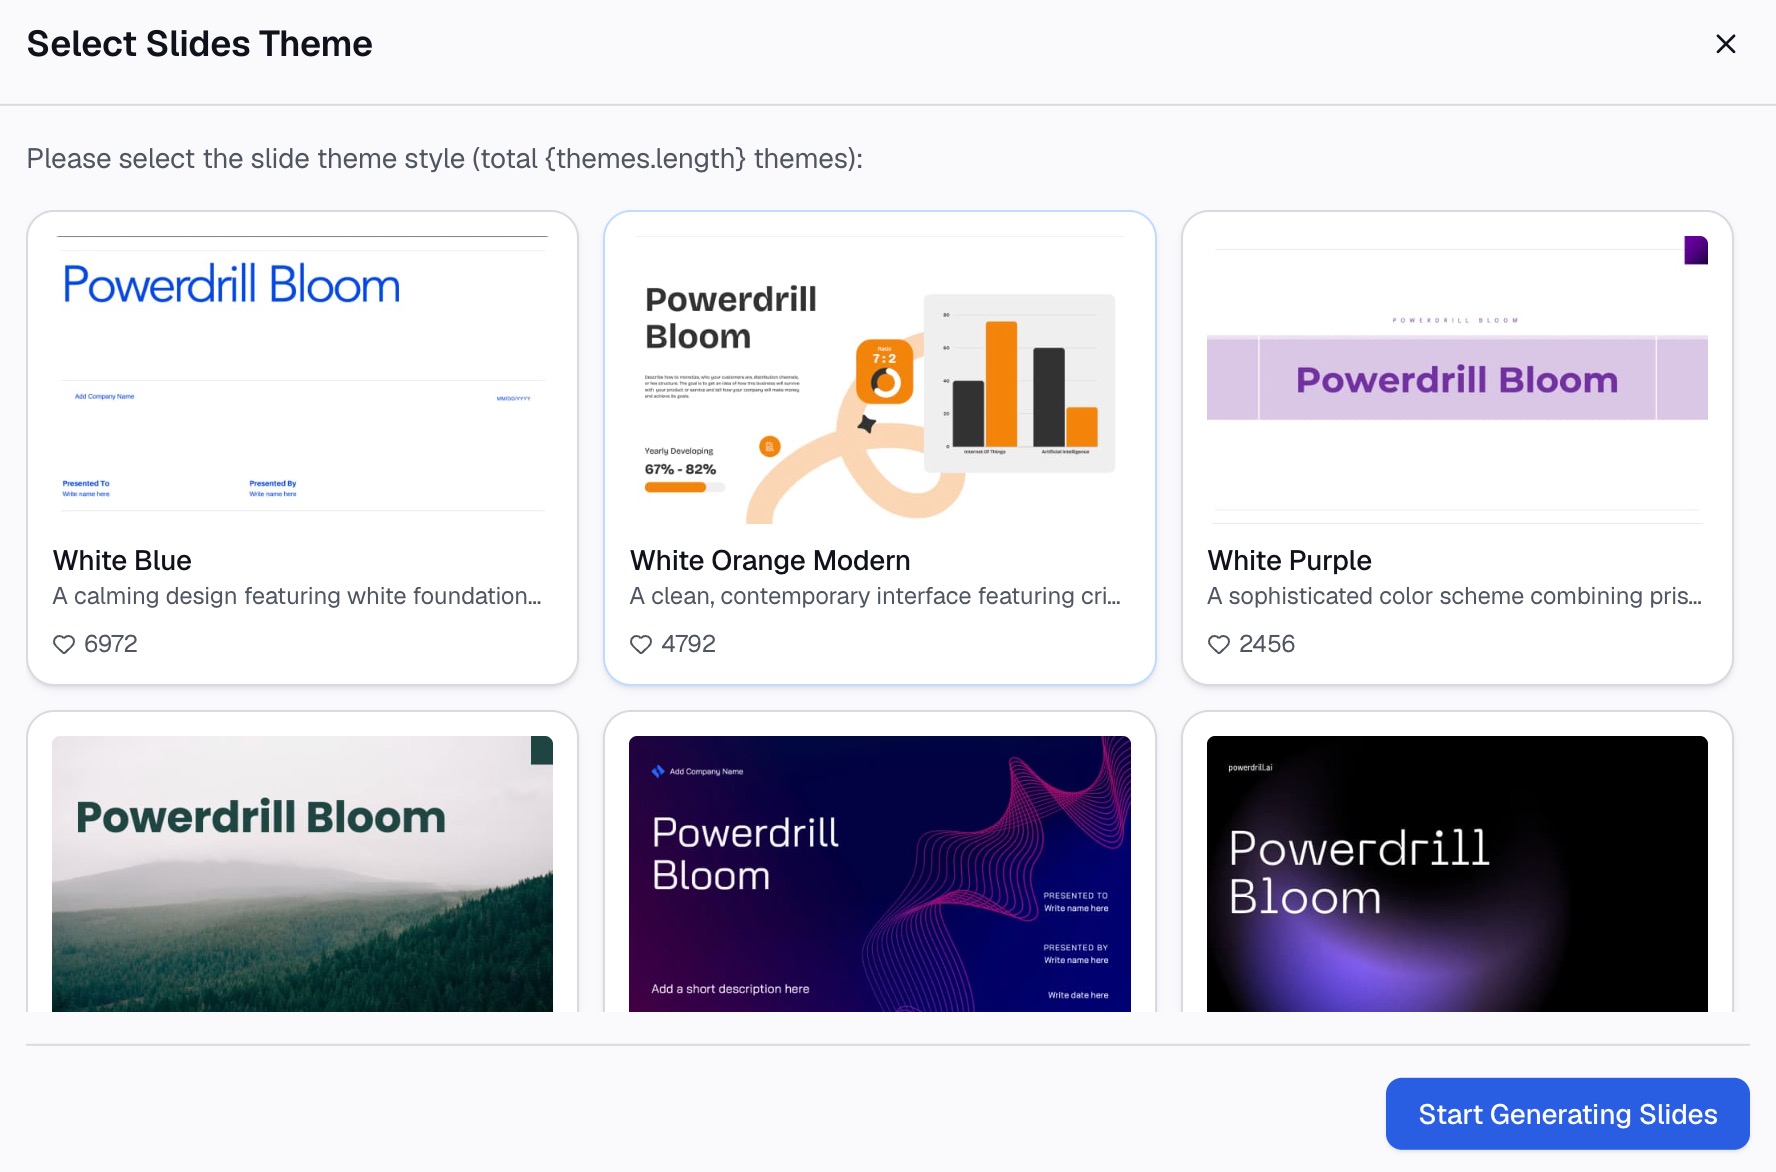
Take out the scorecard table, a ranked chart of weighted scores, or slides that carry the measurement rules beside each supplier's number.
Why this beats rebuilding it each quarter
| Manual route | Powerdrill Bloom | |
|---|---|---|
| Duplicate supplier names | Manual spot check | Surfaces on upload |
| Switching from orders to lines | Rebuild every formula | Ask for both |
| Reapplying exclusions | Remembered by one person | Stated in the rules each run |
| Next quarter's card | Rebuild against a changed export | Swap the file, keep the rules |
The second row is where most of the value sits. Seeing the same supplier scored by orders and by units tells you how fragile the ranking is.
Common mistakes
Tracking too many metrics. SPS warns that more than 20 dilutes focus. Eight to fifteen is the working range.
Copying someone else's weights. Published examples differ widely. Weight to your own operational priorities.
Leaving on-time delivery undefined. Orders, lines and units give different answers. Write the choice down before scoring.
Scoring on too little data. A supplier with four deliveries has no meaningful score. Set a minimum sample and honour it.
Scoring from the first day. Suppliers need a baseline period before results count. Sixty to ninety days is the published guidance.
Averaging a supplier across duplicate records. Two spellings of one name hides real performance. Deduplicate before you score.
Only pointing outward. Late deliveries sometimes follow late purchase orders. Invite feedback on your own forecasting and payment behaviour.
Conclusion
Pick eight to fifteen metrics, write the measurement rules first, score on one scale, weight to 100%, then publish with a trend and a cadence. That is the whole build.
The overall score is not the deliverable. The metric that moved, and the definition it depends on, is what carries a supplier conversation.
If rebuilding that card each quarter eats a week, try Powerdrill Bloom on your purchasing export. See also our guide to spotting slow-moving inventory, the roundup of AI tools for inventory and demand forecasting, and the AI report generator page.
Frequently asked questions
What metrics belong on a supplier scorecard?
Start with delivery, quality, responsiveness and cost. SPS Commerce suggests 8 to 15 metrics, warning that more than 20 dilutes focus for suppliers.
How should I weight the metrics?
To your own priorities, since published examples disagree. One industry example puts on-time delivery at 40%, while another puts it at 20% across a wider metric set.
How often should I score suppliers?
Quarterly for most, monthly for critical suppliers, and annually for long-term evaluation. Track the critical metrics monthly even when you publish quarterly.
Can I build a supplier scorecard in a spreadsheet?
Yes, and many teams start there. SPS Commerce notes that spreadsheet templates often suffice initially, with software worth evaluating as the programme matures.
Should suppliers see their own scorecard?
Yes, and they should be able to respond. SPS Commerce names one-way evaluation as a pitfall, since your forecasting and payment behaviour affect their results.