How to Create a Stockout Report with AI: 6 Easy Checks in 2026
A stockout report lists which items went out of stock, for how long, and what it cost. This guide shows how to build one from an inventory or order export. It covers three steps to generate it with AI, plus the six checks that separate a useful report from a list of zeroes.
What a stockout report answers
Most inventory exports can tell you what is on hand right now. That is a snapshot, and it hides the thing you actually need to know: what ran out, when, and whether anyone noticed.
A stockout report is the historical view. For each item it answers four questions. When did available quantity reach zero? How long did it stay there? How much demand arrived during that window? And which supplier or lead time sits behind it?
There is a compliance edge to this that inventory teams sometimes discover late. If you sell direct to consumers in the United States, running out of stock is not only a replenishment problem. The FTC's Mail, Internet, or Telephone Order Merchandise Rule is explicit. It states that "when you advertise merchandise, you must have a reasonable basis for stating or implying that you can ship within a certain time." With no shipment statement, you need "a reasonable basis for believing that you can ship within 30 days."
The obligation continues after the order arrives. The FTC writes that if "you learn that you cannot ship within the time you stated or within 30 days," you must then act. Its wording is that "you must seek the customer's consent to the delayed shipment." If you cannot ship or send the notice in time, "you must cancel the order and make a prompt refund." A first delay notice must give "a definite revised shipment date." If that date is unknown, it must carry "a statement that you are unable to provide a revised shipment date."
This is a US federal rule and this article is not legal advice; your obligations depend on where you sell and what you promised. The point for the report is narrower: the moment an item goes to zero, a clock may already be running.
What you need before you start
- An inventory movement or stock-on-hand export with a date column, an item identifier, and a quantity.
- Order or sales lines covering the same period, so demand during the gap can be measured.
- Supplier and lead-time fields if you have them. They turn a description into a cause.
- A working definition of "out of stock" for your business. Zero on hand, or below safety stock, are different reports.
That last item causes more rework than anything else. Decide it once, write it at the top of the report, and keep it stable between months.
How to do it manually
Option 1: Filter for zero and eyeball it
Sort the export by quantity, filter to zero, and read the list. It takes two minutes and answers almost nothing, because a snapshot cannot tell you duration.
Useful as a sanity check before a stock count. Not useful as a report.
Option 2: Pivot by item and date
Build a pivot with items as rows and dates as columns, then look for runs of zeroes. This does surface duration, and for a few dozen SKUs it is perfectly workable.
The friction is scale and shape. A year of daily data across a thousand items is a wide, slow sheet, and spotting consecutive zeroes by eye across 365 columns is unreliable.
Option 3: Formula-based gap detection
Write a helper column that flags the first day quantity hits zero. Add another that counts the run length, and a third that joins demand from the order lines. This produces a real stockout report.
It also produces a workbook that only one person understands. When the export schema changes, the formulas break quietly, and the report keeps producing numbers that are now wrong.
Where the manual route slows down
The bottleneck is not the arithmetic. It is that a stockout report is a joining exercise across three files that rarely share keys.
Inventory movements use a warehouse SKU. Order lines use a channel-specific product ID. The supplier list uses a vendor part number. Someone has to reconcile those before any counting starts, and that reconciliation gets redone every month because nobody wrote it down.
The second slowdown is definitional drift. Last month's report counted an item as out of stock at zero. This month someone used "below reorder point" because it looked more useful. The two reports are no longer comparable, and the trend line everyone is about to discuss is meaningless.
How to create a stockout report with Powerdrill Bloom
Step 1: Upload the inventory and order exports together
Drop the stock movement export and the order lines into Powerdrill Bloom in the same pass. The Free plan covers Excel, CSV, PDF, and document uploads, so both files go in without a paid plan.

Uploading them together is what lets the join happen. Add the supplier list too if you have one.
Step 2: State your stockout definition, then ask for the gaps
Say it in natural language. Treat available quantity at or below zero as out of stock. Find every run of consecutive days per item, and show the demand that arrived during each run.
Being explicit about the threshold is the whole trick. The agent will apply it consistently across every item, which is exactly what hand-built reports fail to do.
Step 3: Generate the report with the ranked table and chart
Ask for the output you need: a ranked table of items by lost demand, a timeline of when the gaps clustered, and a short summary. Powerdrill Bloom's Free plan lists generating insights, charts, and summaries, and creating basic slides, docs, sheets, and images.
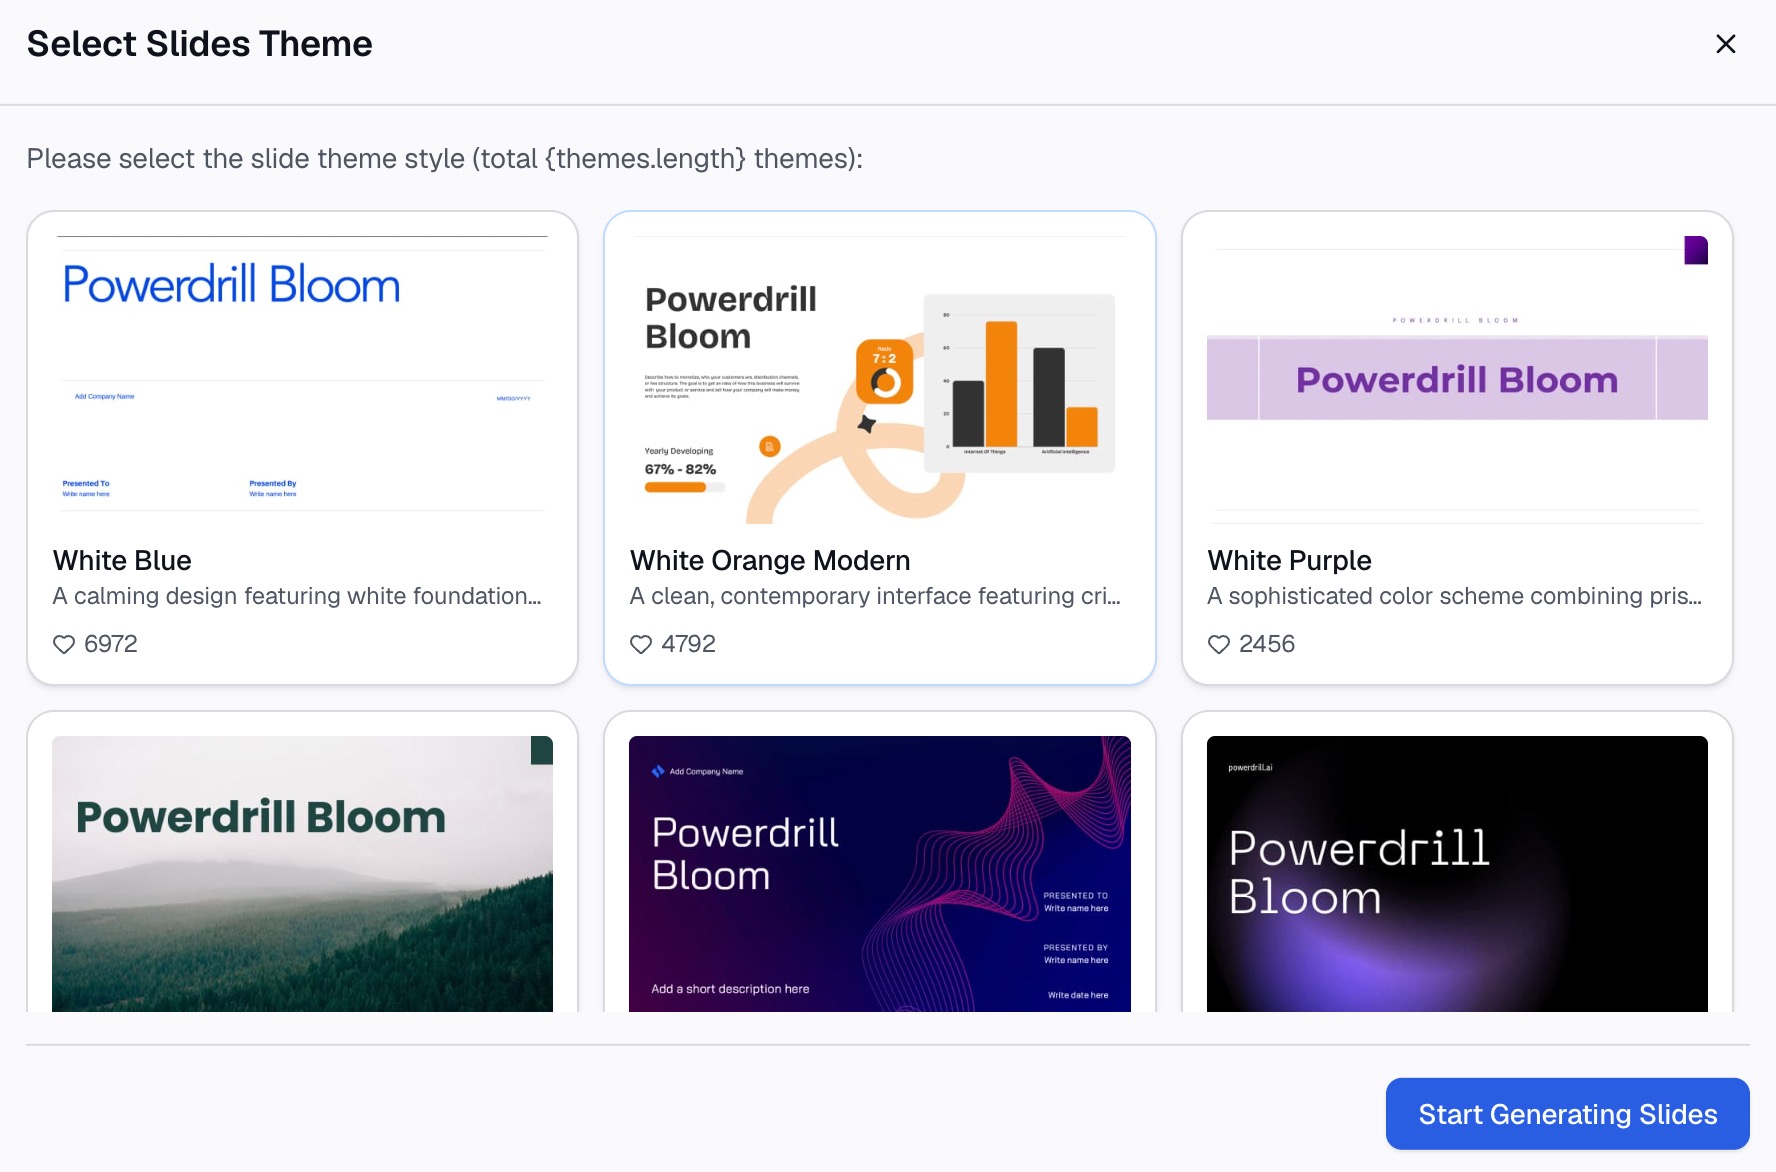
If the report is going to a supplier review, the Pro plan extends this to full slide and Office document output. The table and the commentary then land in one file.
The 6 checks every stockout report should pass
Check 1: Is the out-of-stock threshold stated on the report?
Zero on hand and below safety stock produce different lists. Whichever you chose, print it on the report. Without it, next month's comparison is guesswork.
Check 2: Does each gap have a duration, not just a flag?
An item that was out for four hours overnight and an item that was out for eleven days are not the same event. A report that only marks "yes, this went out of stock" cannot be prioritised.
Check 3: Is demand during the gap included?
This is the field that turns a list into a business case. An item nobody tried to buy while it was empty cost you nothing. Attach orders, add-to-carts, or backorders — whatever demand signal you actually capture.
Check 4: Are phantom stockouts excluded?
Items discontinued mid-period, seasonal lines deliberately run down, and SKUs migrated to a new code all read as permanent stockouts. They will dominate any ranking sorted by duration. Filter them out and say so.
Check 5: Is the supplier or lead time attached?
Without it, the report ends at "we ran out." With it, the report says which of your suppliers is producing the gaps, which is the version that changes something. A supplier scorecard is the natural next artefact.
Check 6: Does it cover the same window as last month's?
Compare a 30-day report to a 31-day report and the difference is arithmetic, not performance. The same applies when one period includes a campaign and the other does not. Fix the window and note any campaign that ran inside it.
What this saves
| Task | By hand | From the uploaded exports |
|---|---|---|
| Reconciling SKU, product ID, and vendor part number | 20–40 minutes, redone each month | Handled in the same pass |
| Finding consecutive zero runs across 1,000 items | Formula column plus verification, 30+ minutes | Part of the question you asked |
| Joining demand into each gap | A second lookup pass | Included when both files are uploaded |
| Applying one definition consistently | Manual discipline, drifts over time | Stated once, applied to every row |
Best practices
Report lost demand, not lost revenue, unless you can defend the price. Demand during the gap is observable. Revenue assumes a conversion that did not happen.
Separate "never stocked" from "ran out." A SKU that was never received is a purchasing issue, not a stockout.
Look at the opposite tail in the same review. Items that never move tie up the capital that would have prevented the gaps. The slow-moving inventory view is the counterpart to this report.
Keep the raw gap table. Summaries get argued with. The row-level list of item, start date, end date, and demand is what settles it.
Conclusion
A stockout report is only as good as its definition and its joins. Both are places where manual work quietly drifts, which is why the monthly version so often stops being comparable to the last one.
If you have the exports but not the time to reconcile them, try Powerdrill Bloom with the inventory and order files together. For a broader view of the tooling in this space, see the inventory and demand forecasting roundup. The Excel AI assistant route suits data that lives in workbooks.
Frequently asked questions
What is a stockout report?
It is a historical report showing which items went out of stock and when each gap started and ended. It also records how long each gap lasted and how much demand arrived during it. Unlike a stock-on-hand snapshot, it measures duration and cost.
How do you calculate a stockout in Excel?
Flag each date where available quantity meets your threshold, then count consecutive flagged days per item to get run lengths. Joining order lines to those windows gives demand during the gap. This works, but the formulas break when the export schema changes.
Should a stockout be counted at zero or at safety stock?
Either is defensible, and the choice depends on whether you are measuring customer impact or replenishment failure. What matters is stating the threshold on the report and keeping it constant between periods.
Does running out of stock create a legal obligation?
In the United States the FTC's Mail, Internet, or Telephone Order Merchandise Rule sets shipping-time obligations. Those include seeking consent to a delayed shipment, and cancelling with a prompt refund if you cannot ship or notify in time. Rules vary by jurisdiction, so check what applies to you.
How often should a stockout report run?
Monthly suits most review cycles, with a weekly version during peak season. Keep the window length identical between runs so the comparison holds.