How to Create a QBR Presentation: A Full Guide
To create a QBR presentation, start with last quarter's goals and show how you did against each one. Then cover the main wins, the misses and their causes, the plan for next quarter, and what you need from the audience. Keep the main deck to about 10 to 12 slides and move detail into an appendix.
This guide explains what a QBR presentation is, the two main types, a slide-by-slide outline, and a worked example. It also shows a faster way to build the deck from your data with AI.
What a QBR presentation is
QBR stands for quarterly business review. A QBR presentation is the deck you bring to that review. It looks back at the last quarter and sets the plan for the next one.
A good QBR presentation answers four questions:
- Did we hit our goals? Each goal from last quarter, with the target and the result.
- What drove the results? The wins, the misses, and the causes behind both.
- What happens next? The priorities and targets for the coming quarter.
- What do we need? Decisions, budget, or help from the people in the room.
A QBR is more than a report. It is a meeting with a decision at the end. The deck should make that decision easy.
Internal QBRs vs. customer QBRs
Two kinds of meeting share the name. The structure is similar, but the audience and the goal differ.
| Internal QBR | Customer QBR | |
|---|---|---|
| Audience | Leadership, or the heads of other teams | A customer's decision makers and users |
| Presented by | A team or business unit leader | An account manager or customer success manager |
| Main goal | Review performance and agree on next quarter's plan | Show the value delivered and plan the next quarter together |
| Core numbers | Revenue, pipeline, margins, KPIs, and headcount | Usage, adoption, outcomes, and support data |
| Typical asks | Budget, hires, or a change in priorities | Expansion, renewal, or access to more teams |
Internal QBRs run inside a company. A sales, marketing, or product team presents its quarter to leadership. The focus is performance against plan and the resources needed next.
Customer QBRs run with a client. Customer success and account teams use them to show the return on the product. A strong customer QBR ties usage to outcomes the customer cares about, such as hours saved or costs cut.
This guide covers both. Where the slides differ, the outline notes it.
What to include: a slide-by-slide outline
Most QBR presentations fit in 10 to 12 main slides. Here is a standard outline.
- Title and agenda. The quarter, the attendees, and the topics with time for each.
- Executive summary. The quarter in three bullets, plus the main ask.
- Goals vs. results. Each goal from last quarter with its target, the result, and a status.
- KPI scorecard. Six to ten metrics with the trend over the last few quarters.
- Wins. Two or three results that mattered, with numbers.
- Misses and root causes. What fell short, why, and what changes.
- Value delivered. For a customer QBR, the outcomes the customer got from the product.
- Segment or account detail. Results by region, product, or team.
- Next quarter's plan. Three to five priorities with targets and owners.
- Risks. The main risks and how you will track them.
- Asks and next steps. Decisions needed, owners, and dates.
- Appendix. Full data tables, methods, and backup.
Keep the order the same each quarter. People learn where to look, and changes stand out.
How to set up the QBR scorecard
The scorecard is the core of a QBR presentation. It turns a quarter of work into a table people can read in a minute.
Build it with these rules:
- Use last quarter's goals. The scorecard should match what was agreed, not what looks good now.
- Show target, actual, and gap. A number without a target means little.
- Add a trend. Show the last three or four quarters, so one good quarter does not hide a decline.
- Use a simple status. Ahead, on track, or behind is enough.
- Keep it stable. Use the same metrics each quarter, and explain any change once.
For a customer QBR, the metrics change. Typical ones are active users, feature adoption, support tickets, and response times. Add one or two outcome metrics the customer named at the start, such as time saved.
If your team also runs a monthly review, the QBR scorecard can roll up those months. Our guide to building a monthly business review deck covers the monthly version.
How to prepare: timeline and data sources
A quarterly review goes faster when the data work starts early. Plan backward from the meeting date.
- Three weeks before. Agree on the agenda, the attendees, and the main ask with your manager or the customer sponsor.
- Two weeks before. Close the quarter's numbers. Pull exports from each system you report on.
- Ten days before. Build the scorecard and draft the slides.
- One week before. Review the draft with one colleague who was not involved. Ask what is unclear.
- Two or three days before. Send the deck as a pre-read.
Most of the data sits in a handful of places. Collect it before you start on slides.
| Data | Where it usually lives | Used on |
|---|---|---|
| Revenue and margin | Finance system or monthly close file | Goals vs. results, scorecard |
| Pipeline and new deals | CRM export | Scorecard, wins |
| Retention and churn | Billing system or CRM | Scorecard, misses |
| Product usage | Product analytics export | Customer value, adoption |
| Support volume and response times | Help desk export | Customer value, risks |
| Goal progress | OKR tracker or planning sheet | Goals vs. results, next quarter |
Use the same date range in every export. A mismatch, such as one file ending on the 30th and another on the 1st, causes totals that do not agree.
Name each export with the quarter in the file name. Next quarter, you can start from the same files and compare like with like.
How to create a QBR presentation with AI
Rebuilding the scorecard and charts by hand takes hours each quarter. You export data from several tools, rebuild charts, and fix the layout. An AI tool can do much of this from your data files.
Here is the method in three steps, using Powerdrill Bloom.
Step 1: Upload your quarter's performance data
Start with the data behind the deck. For an internal QBR, that is usually a KPI tracker, the financials, and team updates. For a customer QBR, it is usage data, support data, and the goals you agreed with the customer.
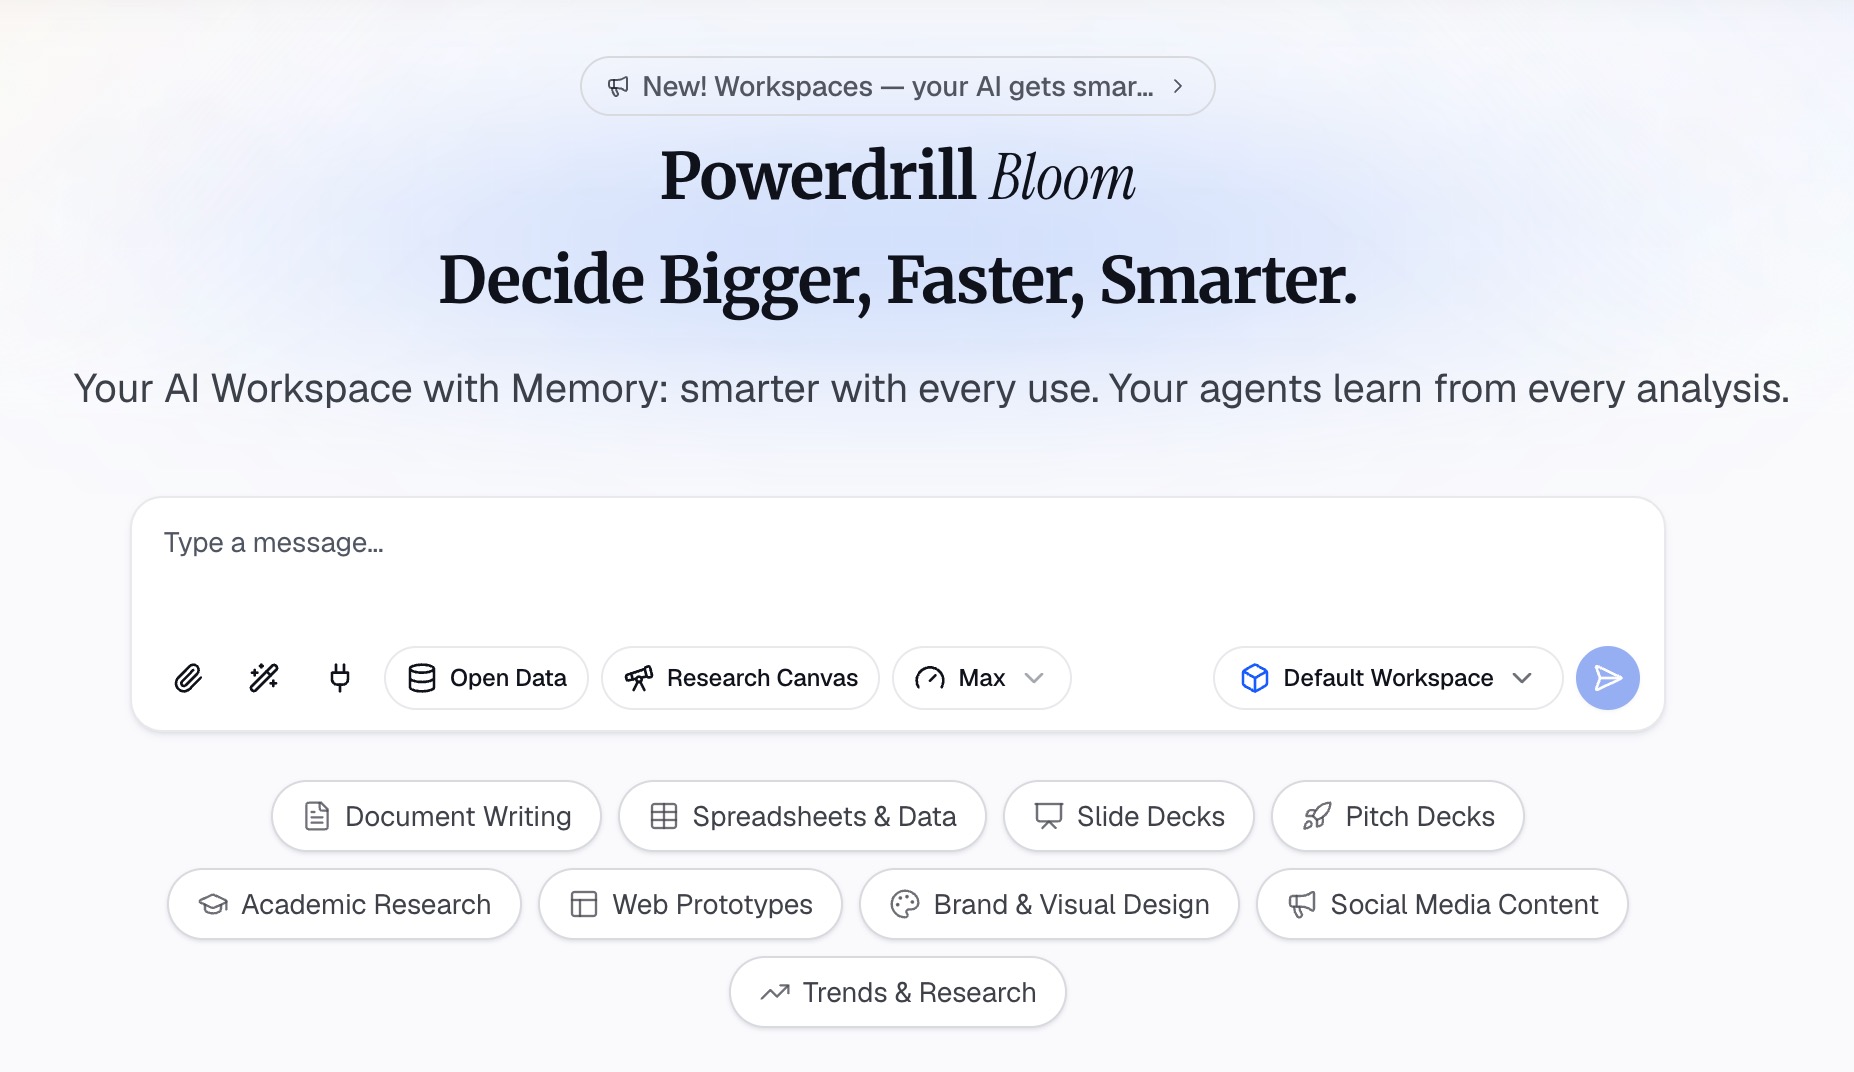
The AI Business Review Generator asks you to upload "KPIs, financials, customer data and OKR progress." Excel, CSV, and PDF files all work. If the numbers sit in several files, upload them together so the tool can link them.
Step 2: Pick the cadence and describe the story
Next, choose the format. The tool page lists three cadences: "QBR, MBR or weekly sync."
Then describe what you need in natural language. For example: "Build a Q3 QBR deck. Show each goal against target, a KPI scorecard with the last four quarters, the top wins, and the misses with causes. End with next quarter's plan and our asks."
The page describes the output as a "Full QBR deck with KPI roll-up, segment performance, wins and risks." It also offers an "MBR one-pager with KPI deltas and root-cause callouts."
Step 3: Check the numbers and export the review
Check every figure against the source files before you present. The homepage says "Every number comes back with the page, the row and the figure behind it," so you can trace each input.
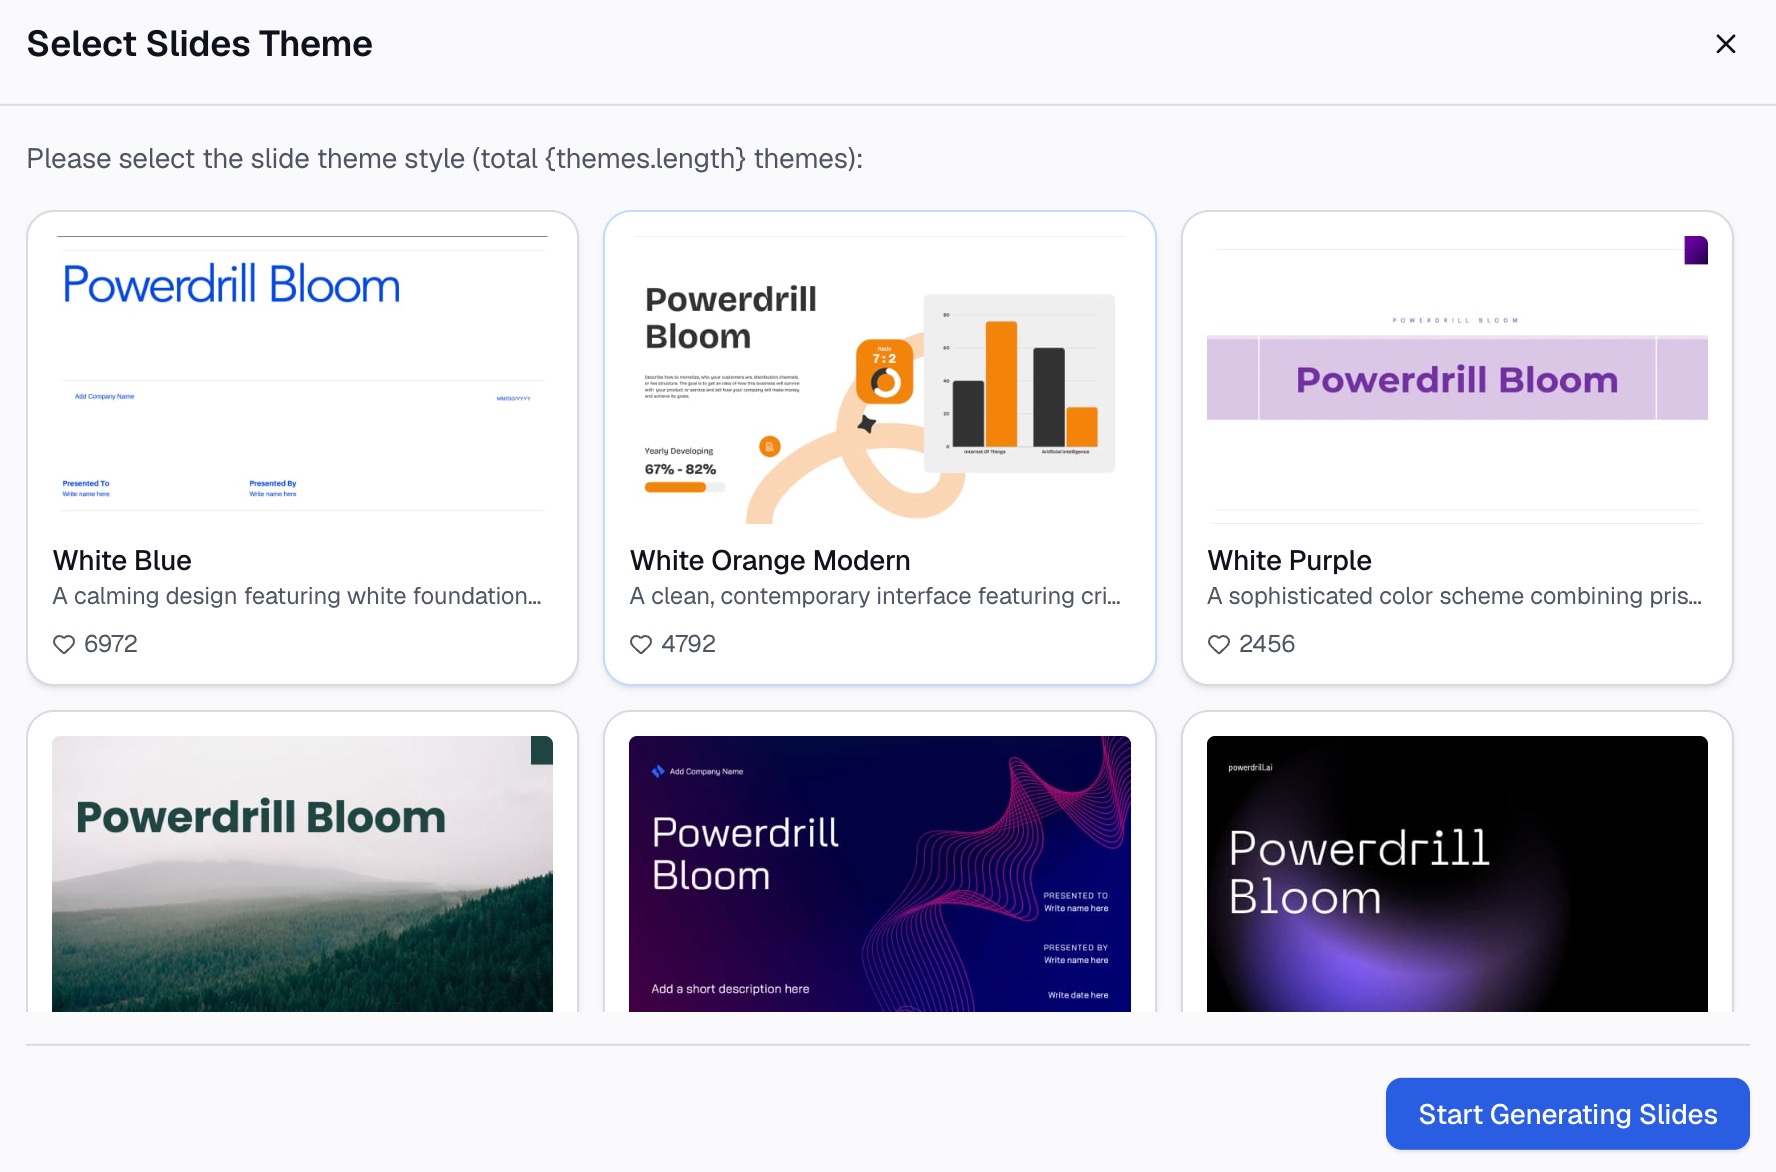
Then export. The tool page says you can export the review as a "branded deck, one-pager or Notion page." For styling, the Nano Banana slides page lists styles such as McKinsey and Executive. If your data lives in one spreadsheet, the Excel to PPT tool covers the same path.
A QBR presentation example
Here is a worked example for a made-up company, Cobalt Desk. It sells help desk software. The support team leader is presenting an internal QBR for Q3.
Executive summary slide:
- Q3 revenue came in at $4.80M, 4% above the $4.60M target.
- Net revenue retention fell to 104%, below the 108% target, after two large customers cut seats.
- Main ask: approve two customer success hires to protect renewals in Q4.
Goals vs. results slide:
| Goal | Target | Q3 result | Status |
|---|---|---|---|
| Revenue | $4.60M | $4.80M | Ahead |
| New customers | 110 | 120 | Ahead |
| Net revenue retention | 108% | 104% | Behind |
| Gross margin | 75% | 76% | On track |
| Customer satisfaction | 90% | 92% | Ahead |
Revenue grew from $4.50M in Q2, a rise of about 6.7%. Revenue beat the target by $200K.
Misses and root causes slide:
- What happened. Two of the top 20 accounts reduced seats in August.
- Why. Both had merged teams and had fewer agents.
- What changes. Success managers will review seat counts with every top-20 account each month.
Customer value slide (for a customer QBR version):
If Cobalt Desk presented to one of its customers instead, this slide would show outcomes. For example: average first response time fell from 2.1 hours to 1.4 hours, about 33% faster. The team resolved 18,400 tickets in the quarter.
The whole internal deck has 11 main slides and a 6-slide appendix.
How to present a QBR
A QBR is a working meeting. Plan it so most of the time goes to discussion.
Send the deck ahead. Share it two or three days before the meeting. People can read the numbers and come with questions.
Open with the summary and the ask. Do not save the ask for the last minute. Say it early so people can think about it as you go.
Spend time on the misses. It is tempting to rush past what went wrong. Leaders and customers trust teams that explain misses plainly and show a fix.
Keep slides short. Put one message on each slide, written as a full sentence in the title. For example: "Revenue beat target by 4%."
End with owners and dates. Read back each decision and next step before people leave. Send a short recap within a day.
For customer QBRs, add one more habit. Ask the customer what they want to achieve next quarter, and write it into the plan.
Prepare for the hard questions. Before the meeting, list the three questions you least want to hear. Common ones are "Why did this metric drop?" and "What will you do differently?" Write a short answer for each, with the number that supports it. Put the backup slides in the appendix so you can jump to them.
Bring the right people. For an internal review, invite the owners of each main metric. For a customer meeting, bring someone who can speak to the product roadmap. Short, direct answers from the right person build more trust than a long slide.
Design tips for QBR slides
QBR slides should be easy to scan. A few rules help.
- Show targets beside actuals. Never show a result alone.
- Use the same colors for status. Pick one color each for ahead, on track, and behind.
- Keep charts simple. Use bar charts for comparisons and line charts for trends.
- Show four quarters, not one. A trend gives context that one number cannot.
- Number every slide. People refer to slide numbers in questions.
- Move detail to the appendix. Keep the main slides for results and decisions.
If your QBR goes to a board, the same rules apply with more focus on decisions. Our guide to board meeting presentations covers that format.
Common QBR presentation mistakes
These mistakes are common and easy to fix.
Too many slides. A 40-slide QBR hides the main message. Keep the main deck short and move the rest to the appendix.
Changing the goals. If the scorecard does not match last quarter's goals, people stop trusting it. Report against what was agreed.
Only good news. A QBR that hides misses loses credibility. Show what fell short and what you will change.
No ask. A QBR without a clear request leaves the meeting with nothing to decide. Name the decision you need.
Usage without outcomes. In a customer QBR, login counts alone do not show value. Tie usage to a result the customer cares about.
Numbers that do not match. A revenue figure should be the same on every slide. Check totals across slides before you send the deck.
When you are ready to build your next QBR presentation from your own data, try Powerdrill Bloom with last quarter's KPI tracker.
Frequently asked questions
What should be included in a QBR presentation?
Include an agenda, an executive summary, goals versus results, a KPI scorecard, wins, misses with root causes, next quarter's plan, risks, and your asks. A customer QBR also needs a slide on the value the customer received.
How long should a QBR presentation be?
Most QBR presentations have 10 to 12 main slides, plus an appendix. Plan for a 60 to 90 minute meeting, with at least half the time for discussion.
What is the difference between a QBR and an MBR?
A QBR, or quarterly business review, covers a full quarter and sets the next quarter's plan. An MBR, or monthly business review, is shorter and tracks progress within the quarter.
Who presents a QBR?
For an internal QBR, a team or business unit leader usually presents to leadership. For a customer QBR, the account manager or customer success manager presents to the customer.
Can AI create a QBR presentation?
Yes. An AI tool can build the scorecard, charts, and slides from your KPI and financial files. You still need to check the numbers, explain the causes behind them, and decide what to ask for.