How to Build a Monthly Business Review Deck From a Spreadsheet (2026 Guide)

To build a monthly business review deck from a spreadsheet, start from the four questions an MBR has to answer — what happened, why, what it means, and what we do next. Pull and reconcile the numbers, chart only the metrics that moved, write the takeaway on each slide, and keep the layout identical to last month so the audience compares content instead of relearning the format.
The hard part is not making slides. It is that you do this again in thirty days, from a spreadsheet that has changed shape, on a deadline you did not set.
This guide covers the manual route in full, shows exactly where it starts costing you a day a month, and then walks through the faster path.
What an MBR deck actually has to answer
A monthly business review is not a data dump with a title slide. Four questions run through it, and every slide should serve one of them.
What happened? The headline metrics against target and against last month. Three to six numbers, not thirty.
Why did it happen? The driver behind each move. Revenue up 12% because enterprise renewals landed early is a different story from revenue up 12% because one deal closed.
What does it mean? The implication for the quarter. This is the part people skip, and it is the reason executives ask "so what" halfway through.
What are we doing about it? Owners and dates. A review without decisions is a status update.
If a slide does not answer one of those four, it belongs in the appendix. That single rule cuts most MBR decks by a third.
The manual route, honestly
Pull and reconcile the numbers
Export from each system — CRM, billing, product analytics, finance — and get them into one workbook. Then reconcile: the revenue number in your billing export will not match the one in the CRM, and you need to know which one you are presenting before you build anything on top of it.
Budget real time here. In most teams reconciliation, not charting, is the step that overruns.
Build the charts
One chart per question, not one per column. Trend over time is a line, comparison across segments is a bar, contribution to a total is a stacked bar. Match the axis ranges to last month's deck so the shapes stay comparable.
If you build these in Excel, our guide on making a presentation from Excel data covers the chart-to-slide handoff in more detail.
Write the takeaway before you paste
Each slide needs a one-line finding as its title: "Enterprise renewals pulled Q3 revenue forward" beats "Q3 Revenue". Write that line first. If you cannot write it, the chart is not telling you anything and should not be in the deck.
Assemble and format
Paste each chart into the template, resize, fix the colours that shifted, update the date in the footer, and re-check that the numbers on the summary slide still match the charts behind them. That last check catches more errors than any other step, because summary slides get built early and edited last.
Where the manual route breaks down
Four things go wrong, reliably, and none of them are about effort.
The source data changes shape. A column gets renamed, a new segment appears, someone adds a totals row inside the range. Your formulas and chart ranges silently point at the wrong cells.
You rebuild rather than refresh. Most MBR decks are recreated each month rather than updated, because the previous month's file has hardcoded ranges and manual edits layered on top. The work does not compound.
Consistency drifts. Month three's colours do not match month one's. The order of segments changes. Small drift makes month-over-month comparison harder, which is the entire point of a recurring review.
The commentary is written last, in a hurry. The analysis that matters most gets the least time, because assembly ate the afternoon.
Numbers-in-a-hurry is also how the same mistake recurs: the summary slide says one thing, the chart behind it says another, and nobody catches it until someone asks in the meeting.
How to build an MBR deck with Powerdrill Bloom
The shortcut is not a better slide template. It is skipping the assembly step entirely — analysing and presenting in the same place, so the deck is a view of the analysis rather than a copy of it.
Step 1: Upload this month's exports
Drop the CRM, billing, product, and finance exports into one workspace. Powerdrill Bloom reads Excel, CSV, TSV, and PDF, and auto-cleans on ingest, so a renamed column or a stray title row does not break the run.

Keep uploading into the same workspace each month. That is what makes "compare this month to the last three" a question you can just ask, rather than a file-merging project.
Step 2: Ask for the review, not for a chart
Describe the deck you need in natural language:
"Compare this month against the prior three months on revenue, new customers, churn, and pipeline. Flag every metric that moved more than 10%, tell me the likely driver from the data, and chart only the metrics that moved."
That instruction produces the analysis and the charts together, with a written read on each one — which is the commentary you would otherwise write at 11pm. If your MBR is a fixed routine, save it as an agent skill and re-run it next month instead of retyping.
Step 3: Export the deck
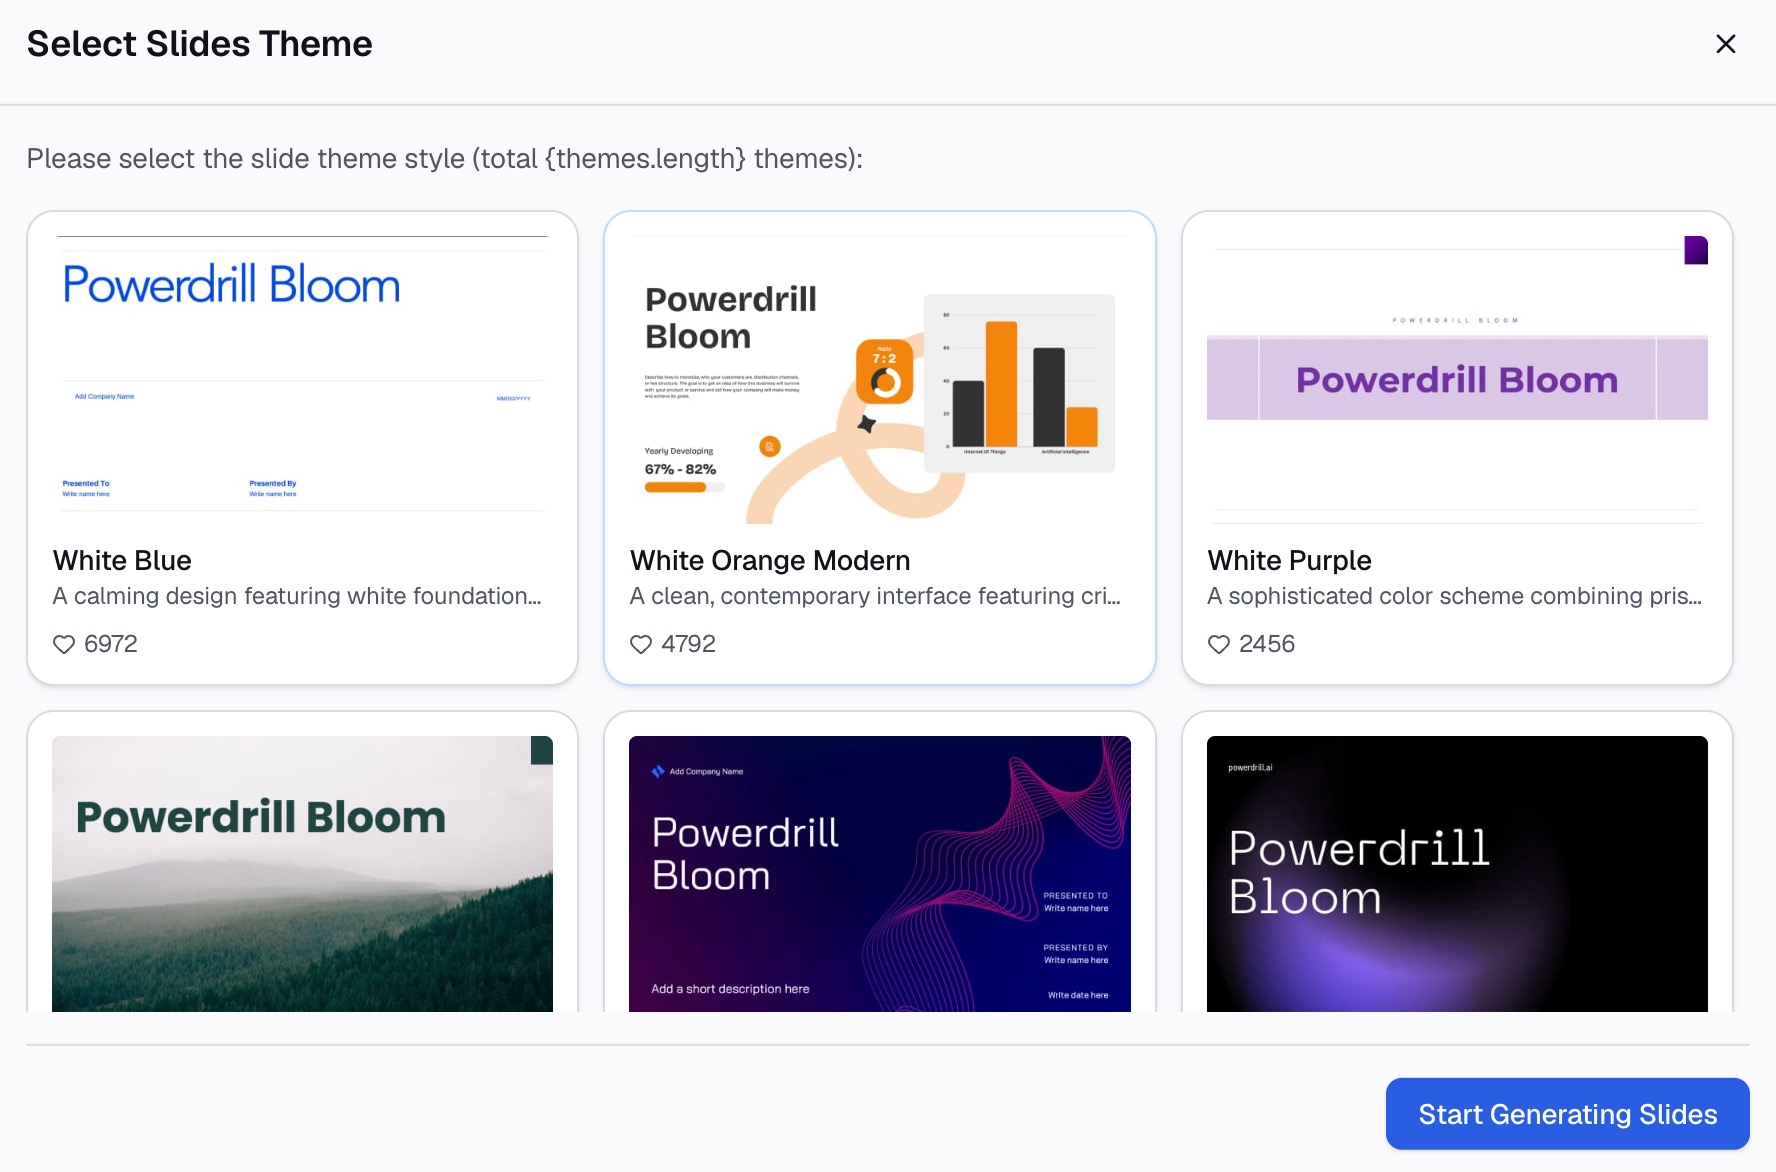
Rearrange the canvas cards into your running order, then convert the canvas into a presentation-ready deck in one click — Professional, Business, or Fancy — and export it to PowerPoint or Notion for final edits.
Because the same workspace and the same instruction produce next month's version, the format stays consistent by default rather than by discipline.
Why this beats rebuilding it every month
| Manual route | Powerdrill Bloom route | |
|---|---|---|
| Reconciling several exports | Manual, per month | Handled at question time |
| Source column renamed | Breaks ranges silently | Handled on ingest |
| Charts | Built one at a time | Generated from the question |
| Slide commentary | Written last, in a hurry | Produced with each chart |
| Month-over-month consistency | Depends on discipline | Same workspace, same instruction |
| Next month | Largely rebuilt | Re-run and review |
The honest trade-off: a hand-built deck gives you total control of every pixel, and for a board-level narrative that control is sometimes worth the day. For a recurring internal review, it rarely is.
What belongs on each slide
One finding per slide, in the title
The title carries the conclusion; the chart is the evidence. If your titles read as a list of nouns, the deck has no argument in it.
Keep the metric set fixed
Changing which metrics you show each month makes trends invisible. Fix the core set, and put anything new in an appendix until it earns a place.
Show the target, not just the value
A revenue number alone is not reviewable. Against plan, against last month, or against the same month last year — pick one comparison and use it consistently.
Put the detail in an appendix
Executives ask for the underlying cut roughly one time in five. Have it ready behind the main deck rather than in it. If you need a tool-by-tool view of how teams run these, top AI tools for quarterly business reviews covers the wider landscape.
Common mistakes to avoid
- Presenting a metric you cannot explain. If nobody knows why churn moved, say so explicitly and name who is investigating. An unexplained number invites twenty minutes of speculation.
- Letting the summary slide drift from the charts. Rebuild the summary last, from the final numbers, every time.
- Changing chart types between months. A bar chart in March and a line chart in April for the same metric destroys comparability.
- Burying the decision. If the review needs a call, put it on its own slide with an owner and a date.
- Including every metric you have. Coverage is not insight. Six well-chosen metrics beat thirty complete ones.
Conclusion
An MBR deck is a recurring product, not a one-off document. Build it so that next month is a re-run rather than a rebuild: fix the metric set, fix the layout, reconcile before you chart, and write the finding into every slide title.
If the assembly step is the part eating your day, Powerdrill Bloom turns the analysis canvas into a deck in one click, and the free plan includes 1,000 daily refreshed credits so you can test it on this month's real files. The Excel to PowerPoint and AI report generator pages show the same workflow from the tool side.
Frequently asked questions
What should a monthly business review deck include?
Headline metrics against a consistent comparison, the driver behind each significant move, the implication for the quarter, and the decisions with owners and dates. Detailed cuts belong in an appendix rather than the main flow.
How long should an MBR deck be?
Most run 8 to 15 slides in the main body, with an appendix of any length. The constraint is the discussion, not the document: if the deck takes the whole meeting to present, there is no time left to decide anything.
How do I stop rebuilding the same deck every month?
Fix three things: the metric set, the slide order, and the source of each number. Then make the build repeatable — either a refreshable query feeding a fixed template, or a saved instruction re-run against the new month's files.
Can AI write the commentary for an MBR?
It can draft the read on each chart — what moved, by how much, and what in the data most likely explains it. The judgement calls, particularly what to do next, stay with the person presenting, because those depend on context that is not in the spreadsheet.
What is the difference between an MBR and a QBR?
A monthly business review is operational and short-horizon: what moved this month and what we adjust now. A quarterly business review is strategic, covers a longer window, and usually involves a wider audience and target-setting for the next quarter.