Data Facts: World's Best-Selling Phone's Sales

In today's rapidly evolving technology landscape, understanding the sales dynamics of the world's best-selling phones is crucial for industry stakeholders, including manufacturers, marketers, and analysts.Today we'll analyze the evolution of form factors, from classic bar phones to modern touchscreens, and track changes in consumer preferences over the years. By examining sales figures and market trends, this blog provides valuable insights into the competitive landscape of the mobile phone industry and its technological advancements.
Source: kaggle
Given the dataset, Powerdrill AI detects and analyzes the metadata, then gives these relevant inquiries:
1. Top Manufacturers: Which manufacturers have the highest number of best-selling mobile phones?
2. Sales Performance: What are the top 5 best-selling mobile phone models by units sold?
3. Yearly Trends: How have the best-selling mobile phones evolved over the years?
4. Form Factor Popularity: What is the distribution of form factors among the top 120 best-selling mobile phones?
5. Smartphone vs Non-Smartphone: What percentage of the top 120 best-selling mobile phones are smartphones?
6. Units Sold Analysis: What is the average number of units sold for the top 120 best-selling mobile phones?
7. Historical Shifts: How has the popularity of different form factors changed over time?
These inquiries can help in understanding market trends, consumer preferences, and the competitive landscape in the mobile phone industry.
Top Manufacturers: Which manufacturers have the highest number of best-selling mobile phones?
Conclusion on Best-Selling Mobile Phone Manufacturers
Based on the analysis of the 'Manufacturer' column from the provided dataset, here are the key findings regarding the manufacturers with the highest number of best-selling mobile phones:
Top Manufacturers by Number of Best-Sellers
Samsung leads significantly with 43 best-selling models.
Nokia follows with 26 best-selling models.
Apple is third with 16 best-selling models.
Additional Observations
Other manufacturers like LG and Xiaomi each have 7 best-selling models.
The data indicates a wide disparity in market dominance, with Samsung clearly leading the pack.
This analysis highlights the market leaders in terms of best-selling mobile phones, providing valuable insights for market analysis and strategic planning.
Sales Performance: What are the top 5 best-selling mobile phone models by units sold?
Overview
The dataset has been sorted by 'Units Sold (million)' in descending order to identify the top 10 best-selling mobile phone models. The analysis includes models from manufacturers such as Apple and Nokia, spanning various years and both smartphone and non-smartphone categories.
Key Findings
Leading Models by Units Sold
The Nokia 1100 leads with 250 million units sold, followed closely by the Nokia 1110 with 247.5 million units.
The best-selling smartphone is the Apple iPhone 6 & 6 Plus with 222.4 million units sold.
Manufacturer Representation
Nokia models appear prominently in the top ranks, indicating their dominance in the mobile phone market during the early 2000s.
Apple shows strong sales figures, particularly with models released in the mid-2010s.
Form Factor and Technology
The top two models are non-smartphones ('Bar' form factor) which highlights the market preference during their time of release.
Subsequent models in the list are primarily smartphones with touchscreen capabilities, reflecting the market shift towards smart devices.
Year of Release
The models span from 1999 to 2019, showing a range of both older and more recent devices.
There is a noticeable concentration of models released in the mid-2010s, aligning with the rapid growth of smartphone technology.
Detailed Top 5 Models
Nokia 1100 (2003, Bar, Non-smartphone): 250 million units
Nokia 1110 (2005, Bar, Non-smartphone): 247.5 million units
Apple iPhone 6 & 6 Plus (2014, Touchscreen, Smartphone): 222.4 million units
Nokia 105 Series (2013, Bar, Non-smartphone): 200 million units
Apple iPhone 6S & 6S Plus (2015, Touchscreen, Smartphone): 174.1 million units
Conclusion
The analysis of the top 10 best-selling mobile phone models reveals a diverse range of products that have achieved significant sales figures. The dominance of Nokia in the early 2000s and the strong performance of Apple's smartphones in the mid-2010s highlight key trends and shifts in consumer preferences and technology adoption over the years.
Yearly Trends: How have the best-selling mobile phones evolved over the years?
Trends in Best-Selling Mobile Phones by Year
Volatility in Popularity: The number of best-selling phones has shown significant fluctuations over the years, with a notable peak around 2020. This suggests periods of intense competition and innovation within the market.
Growth and Decline Phases: The graph indicates a general increase in the number of best-selling models starting from the early 2000s, reaching a peak in 2020, followed by a sharp decline, possibly indicating market saturation or stabilization.
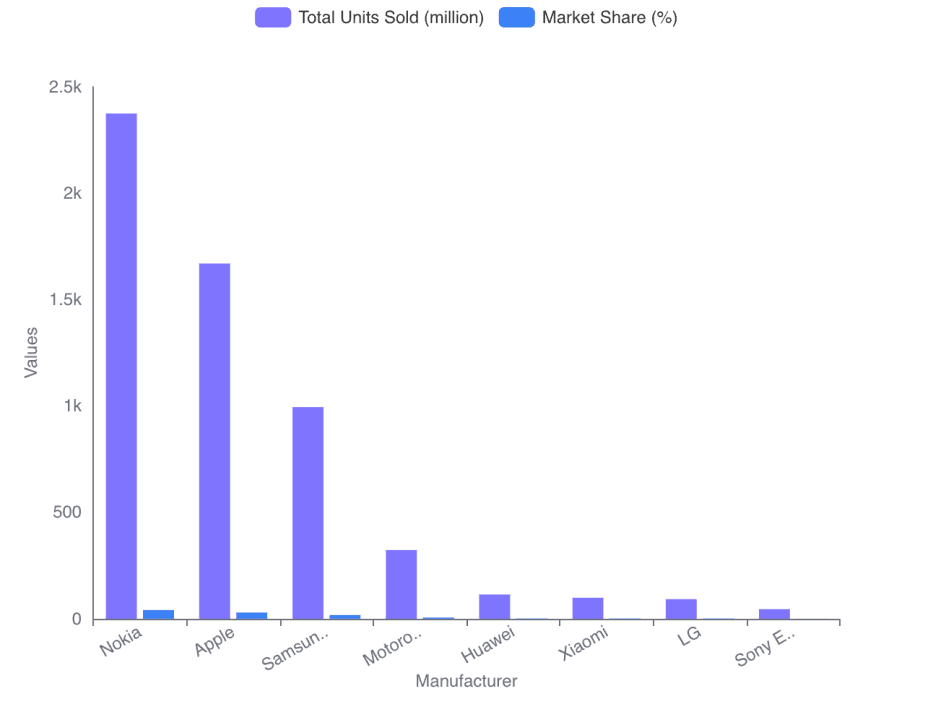
Top Manufacturers and Market Share
Dominance of Major Brands: Nokia, Apple, and Samsung have emerged as the top manufacturers with significant market shares, indicating their strong market presence and consumer preference.
Market Share Reflects Competitive Position: Nokia leads with a substantial margin in both total units sold and market share, highlighting its dominance during the peak of its popularity. Apple and Samsung also hold considerable shares, underscoring their success in the smartphone era.
Evolution of Mobile Phone Designs
Diverse Form Factors: The evolution of mobile phone designs shows a variety of form factors, with traditional bar phones initially dominating.
Rise of Touchscreens: There has been a significant rise in touchscreen models, reflecting technological advancements and changing consumer preferences towards more interactive and feature-rich devices.
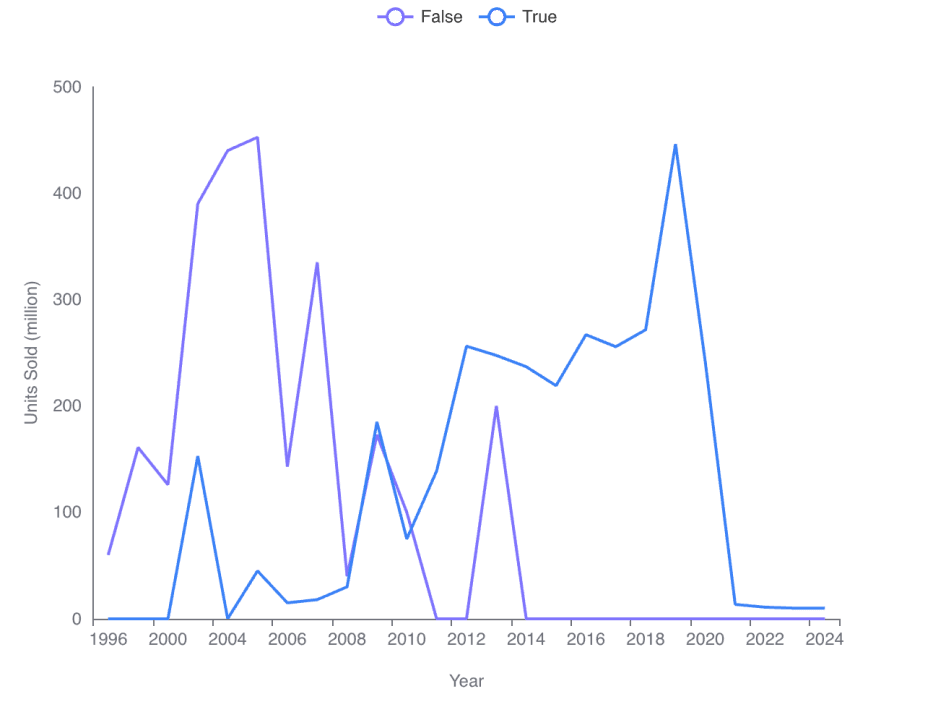
Shift from Feature Phones to Smartphones
Increasing Preference for Smartphones: The data shows a clear trend towards smartphones over the years, with a significant increase in units sold, especially post-2010. This shift underscores the technological evolution and increased consumer demand for more advanced features.
Key Insights
Technological Advancements and Consumer Preferences: The mobile phone market has evolved dramatically, driven by technological innovations and shifts in consumer preferences towards smartphones with advanced features.
Market Dynamics: The fluctuations in the number of best-selling phones and the shifts in market share among manufacturers highlight the dynamic nature of the mobile phone market, influenced by technological trends, competitive marketing, and consumer behavior.
Overall, the mobile phone market has seen significant transformations over the years, with shifts towards more advanced technologies and changes in consumer buying patterns. The dominance of key players like Nokia, Apple, and Samsung has shaped the market landscape, reflecting their ability to innovate and adapt to consumer needs.
Form Factor Popularity: What is the distribution of form factors among the top 120 best-selling mobile phones?
Overview
The analysis of the form factor distribution among the top 120 best-selling mobile phones reveals a clear preference in the market. The data and subsequent visualization provide insights into the popularity of different types of mobile phone designs.
Key Findings
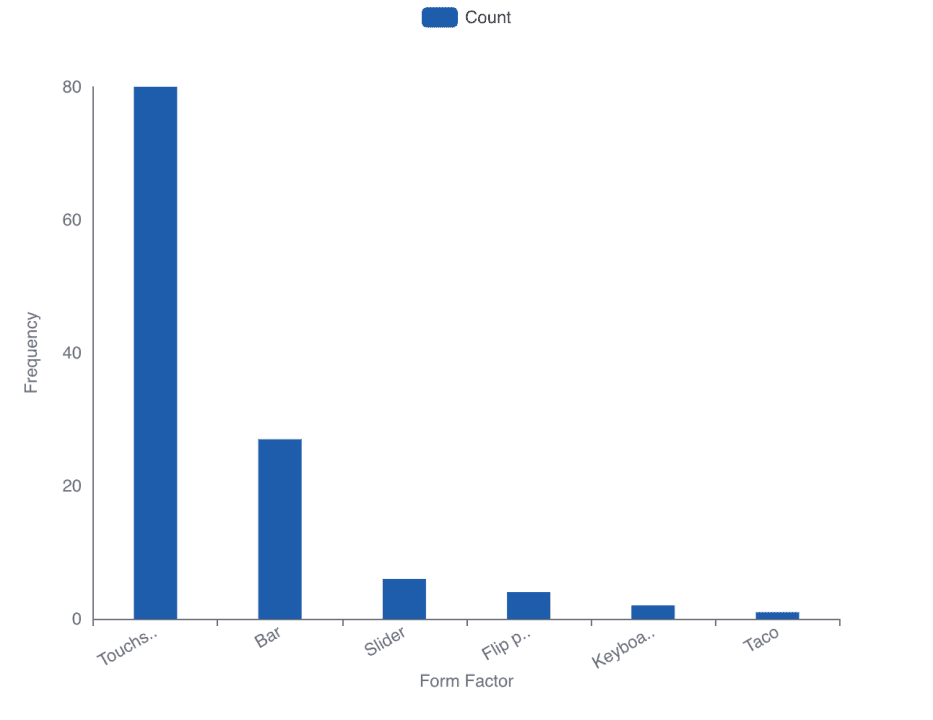
Dominance of Touchscreen Phones: The touchscreen form factor is overwhelmingly the most popular, with 80 units sold among the top 120. This represents a significant majority of the market share in this sample.
Moderate Presence of Bar Phones: The bar form factor, while not as prevalent as touchscreen, still holds a notable presence with 27 units sold.
Limited Popularity of Other Form Factors: Other form factors such as Slider, Flip phone, and Keyboard bar have much lower counts, indicating a niche market. Specifically, Slider phones have 6 units, Flip phones have 4 units, and Keyboard bars have 2 units sold.
Absence of Taco Form Factor: The Taco form factor is not represented in the top 120 best-selling phones, suggesting it either has no sales or is extremely unpopular in the current market.
Visualization Analysis
The bar chart visualization clearly illustrates the distribution:
The height of the Touchscreen bar significantly surpasses others, visually emphasizing its market dominance.
The decreasing heights from Bar to Keyboard bar reflect the descending order of popularity.
Implications
This distribution suggests that manufacturers and marketers should primarily focus on touchscreen devices, considering their high market demand. However, there remains a market segment for bar phones which could be targeted for specific consumer needs. The minimal interest in other form factors like sliders, flip phones, and keyboard bars indicates these are less favorable options for major production investments.
In conclusion, the market for mobile phones is heavily skewed towards touchscreen devices, with bar phones being a secondary preference. Other form factors currently play a minor role in the top-selling segments.
Smartphone vs Non-Smartphone: What percentage of the top 120 best-selling mobile phones are smartphones?
Analysis of Data:
Total Number of Mobile Phones Analyzed: 120
Number of Smartphones: 85
Number of Non-Smartphones: 35
Conclusion:
Percentage of Smartphones: 70.83%
This indicates that a significant majority of the top 120 best-selling mobile phones are smartphones.
Units Sold Analysis: What is the average number of units sold for the top 120 best-selling mobile phones?
Average Units Sold for Top 120 Best-Selling Mobile Phones:
Average Units Sold: The computation for the average number of units sold for the top 120 best-selling mobile phones has been successfully completed.
Result: The average number of units sold is 48.05 million per mobile phone model.
This figure represents a significant volume, indicating strong market performance for these top-selling mobile phones.
Historical Shifts: How has the popularity of different form factors changed over time?
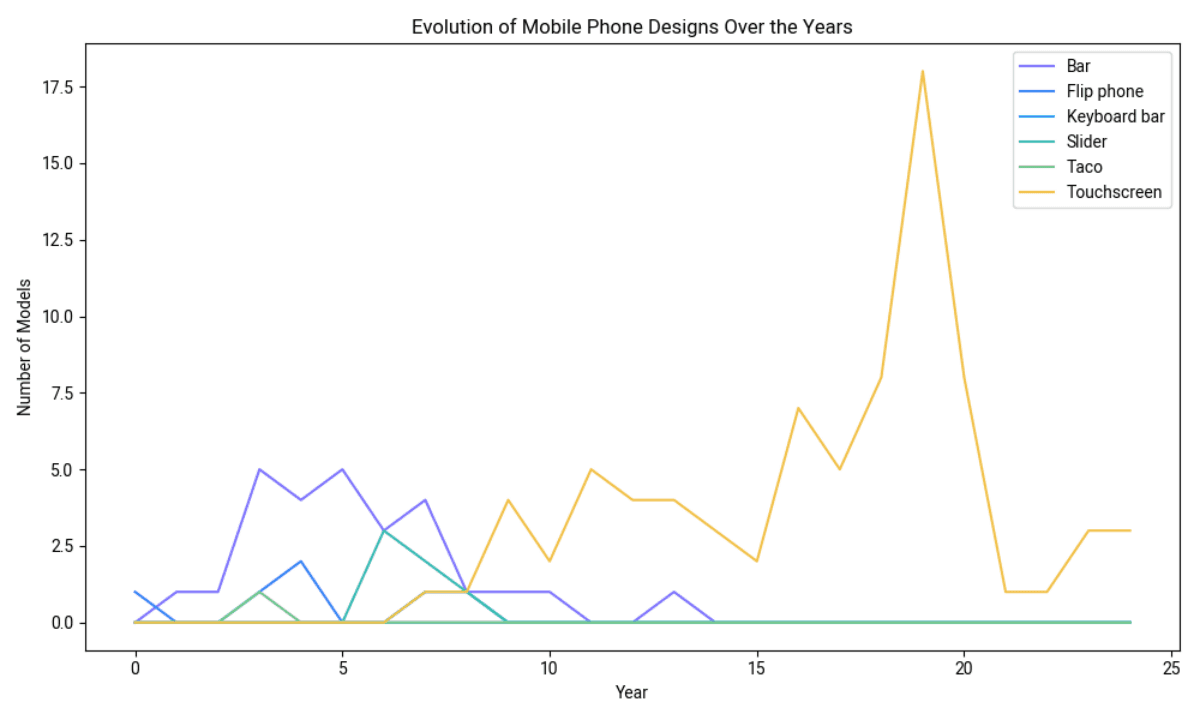
Overview
The analysis of the historical changes in the popularity of different mobile phone form factors over time reveals significant trends and shifts in consumer preferences. The data provided and the subsequent visualization highlight how different form factors have risen and fallen in popularity over the years.
Key Observations from Data
Form Factors Analyzed: The data includes various form factors such as Touchscreen, Bar, Flip phone, Slider, Keyboard bar, and Taco.
Years Covered: The analysis spans from 1996 to 2024.
Sales Trends: The sales data shows fluctuations in the units sold, with some years experiencing high sales and others showing a decline.
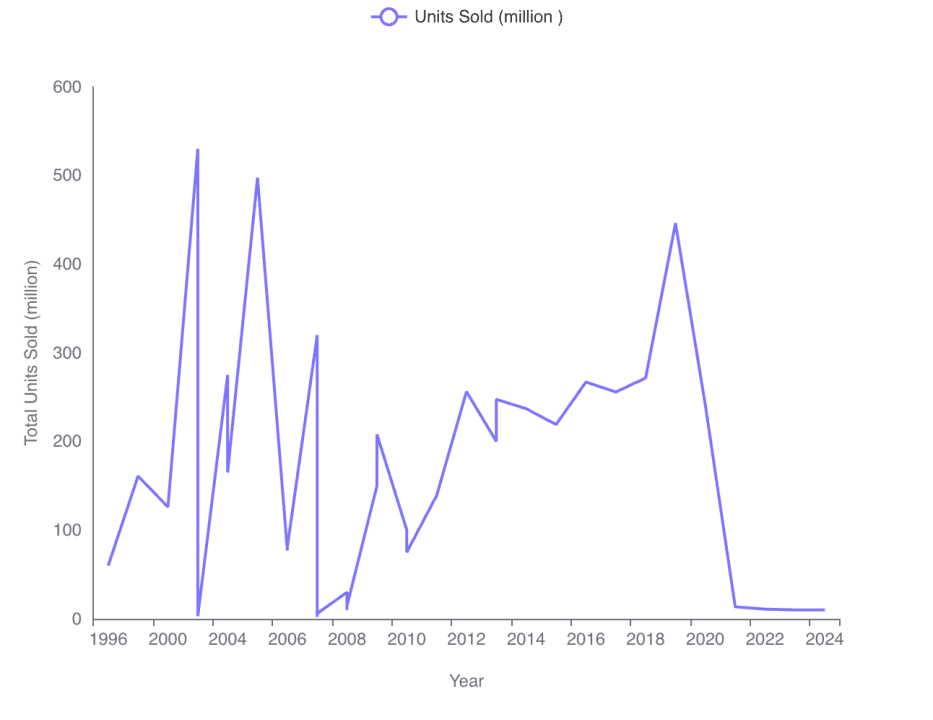
Visual Analysis
Line Chart Insights: The line chart visualizes the total units sold across different years. It shows peaks and troughs which indicate the varying popularity of mobile phones over time.
Peak Sales: The highest peaks appear around the early 2000s and mid-2010s, suggesting periods of high popularity or successful product launches.
Recent Trends: There is a noticeable decline towards the latest years in the dataset, indicating a possible saturation in the market or shifts to newer technologies or form factors not covered in the dataset.
Conclusion
The historical data on mobile phone sales by form factor indicates that consumer preferences have evolved significantly over the past decades. The rise and fall of different form factors reflect technological advancements, market saturation, and changing consumer needs. The peak periods likely correspond to the introduction of innovative features or highly competitive market strategies. The decline in recent years could suggest a market shift towards newer, unrepresented form factors or technologies, highlighting the dynamic nature of the mobile phone industry.
Try Now
Try Powerdrill AI now, explore more exciting data stories in an effective way!