Data Facts: The Popularity of AI and ML

This dataset captures global AI and ML trends using data from search engines, social media, research, courses, and job postings.
With the AI data analysis in Powerdrill, let's take a look at the data facts of AI and ML trends globally.
Given the dataset, Powerdrill detects and analyzes the metadata, then gives these relevant inquiries:
1.Global Popularity and Trends:
What is the average popularity score of AI and ML across different countries?
2.City and Regional Insights:
Which cities show the highest AI and ML popularity scores?
3.Search Trends Analysis:
What are the most frequent search terms related to AI and ML?
How have the frequencies of these search terms changed over time?
4.Rising Trends and Emerging Technologies:
Which rising search terms indicate emerging trends in AI and ML?
How have new technologies impacted AI and ML popularity scores?
5.Sectoral and Demographic Analysis:
How does AI and ML interest vary across sectors such as education, healthcare, and finance?
What demographic factors (e.g., GDP, internet access) correlate with higher AI and ML interest?
6.Temporal Analysis:
How has the global interest in AI and ML evolved over recent years?
What significant trends in AI and ML adoption can be identified over time?
7.Top Searches and Popular Applications:
Which AI and ML applications or technologies are most commonly searched for?
How do these interests differ across regions?
8.Correlation and Relationship Analysis:
What are the correlations between different AI and ML popularity metrics?
These inquiries aim to provide a comprehensive understanding of the dataset, offering insights into global AI and ML trends, regional interests, and future projections.
Then for each of the inquiries, Powerdrill can automatically generate Python code to analyze the dataset, and then give the answer.
Global Popularity and Trends
Average Popularity Score by Continent/Economic Zone:
Asia: Data not available (NaN)
Europe: 11.5
North America: 18.0
Observations on Country-Level Data:
The dataset contains 250 countries.
The average popularity score for AI and ML across these countries is 21.28.
The standard deviation is 15.85, indicating a wide range of popularity scores.
Scores range from a minimum of 4 to a maximum of 100.
Several countries, including Afghanistan and Albania, have missing data (NaN).
City and Regional Insights
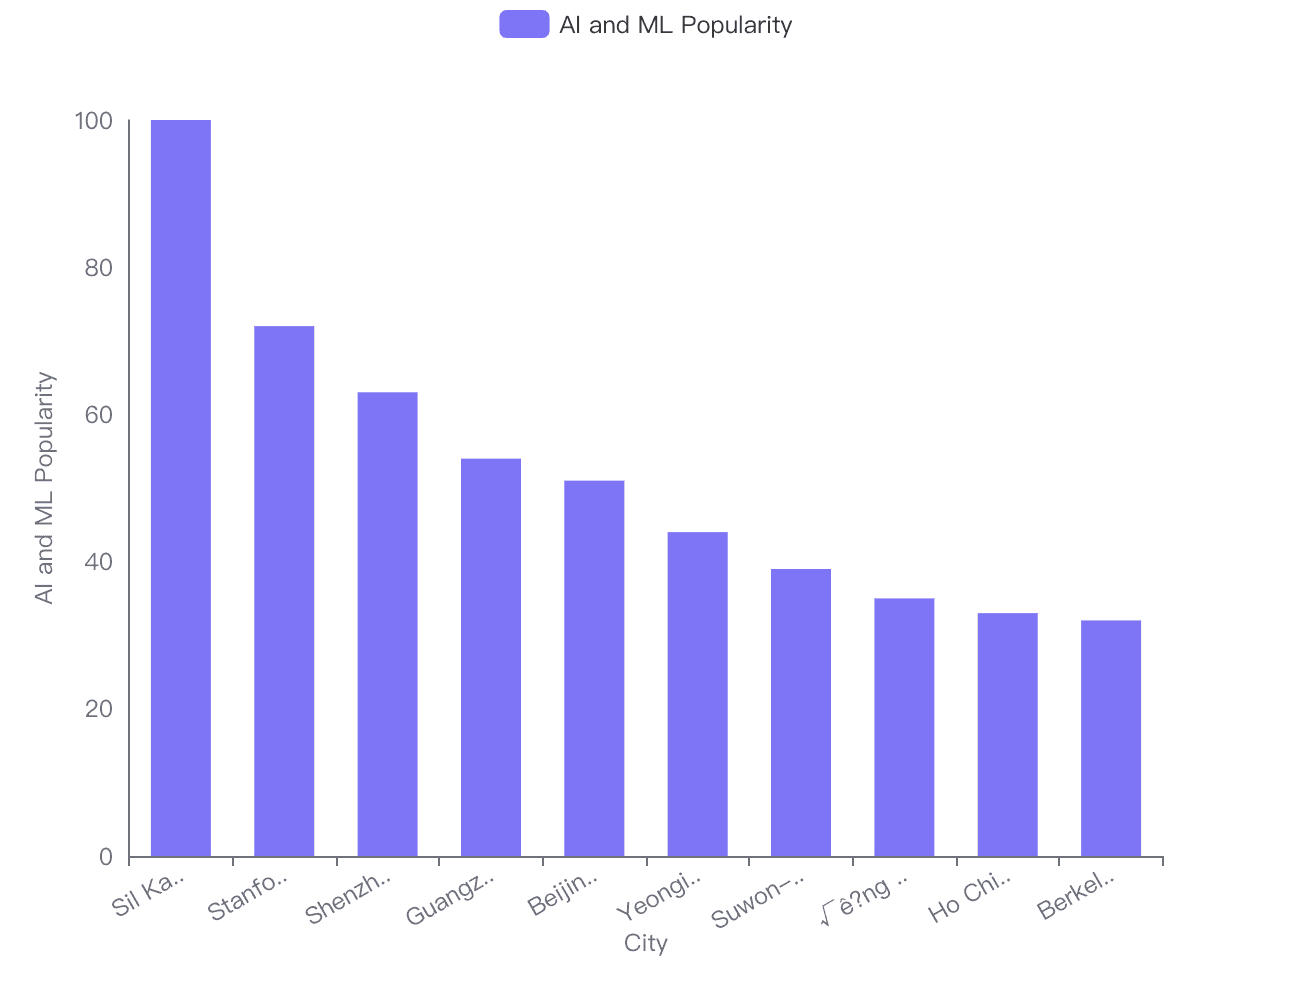
Cities with the Highest AI and ML Popularity Scores
Top City: Sil Kapra with a score of 100
Second Place: Stanford with a score of 72
Third Place: Shenzhen with a score of 63
Other notable cities include Guangzhou (54) and Beijing (51)
Search Trends Analysis
Most Frequent Search Terms Related to AI and ML:
Top Search Terms: The data indicates that the most frequent search terms related to AI and ML include 'Perplexity.ai', 'GPT-4', 'Ask AI - Chat with Chatbot', 'Artificial intelligence content detection', and 'Stable Diffusion'. Each of these terms has a frequency of 2.
Changes in Frequencies Over Time:
Rising Searches Percentage: The mean percentage change for the first set of search terms is 44.94% with a standard deviation of 14.01%.
Rising Searches Percentage.1: For the second set of search terms, the mean percentage change is 50.00%; however, the standard deviation is 0.00%, indicating no variability and suggesting a possible static or single data point.
Rising Trends and Emerging Technologies
Emerging Trends in AI and ML:
Rising Search Terms: The data indicates that terms such as A.I.VOICE, Gemini, QuillBot, Poe, and Perplexity.ai are among the top rising searches related to AI and ML. These terms represent emerging trends or products in the field.
Uniform Interest: Each of the listed search terms has a count of 1, suggesting a uniform level of interest or emergence among these terms.
Impact on AI and ML Popularity Scores:
Mean Popularity Scores: The mean popularity score for 'Ai and ML(Popularity)' is 18.56, while for 'Ai and ML(Popularity).1' it is slightly higher at 18.96.
Variability in Popularity: The standard deviation for 'Ai and ML(Popularity)' is 3.84, indicating less variability. In contrast, 'Ai and ML(Popularity).1' has a much higher standard deviation of 13.81, suggesting a greater spread in the popularity scores.
Range of Popularity: The minimum and maximum popularity scores for 'Ai and ML(Popularity)' are 15.85 and 21.28 respectively, while for 'Ai and ML(Popularity).1' they are 9.19 and 28.72 respectively, indicating a wider range in the latter.
Sectoral and Demographic Analysis
Interest in AI and ML Across Different Sectors:
The mean popularity for AI and ML is 35.28 with a high standard deviation of 43.75, suggesting significant variability.
The alternate measure of AI and ML popularity has a mean of 39.73 and a similarly high standard deviation of 40.98.
The maximum interest in both measures is 100, indicating at least one sector with very high interest, while the minimum interest is 4 and 9.19 respectively, showing that some sectors have low engagement with AI and ML.
Demographic Factors Correlating with Higher Interest in AI and ML:
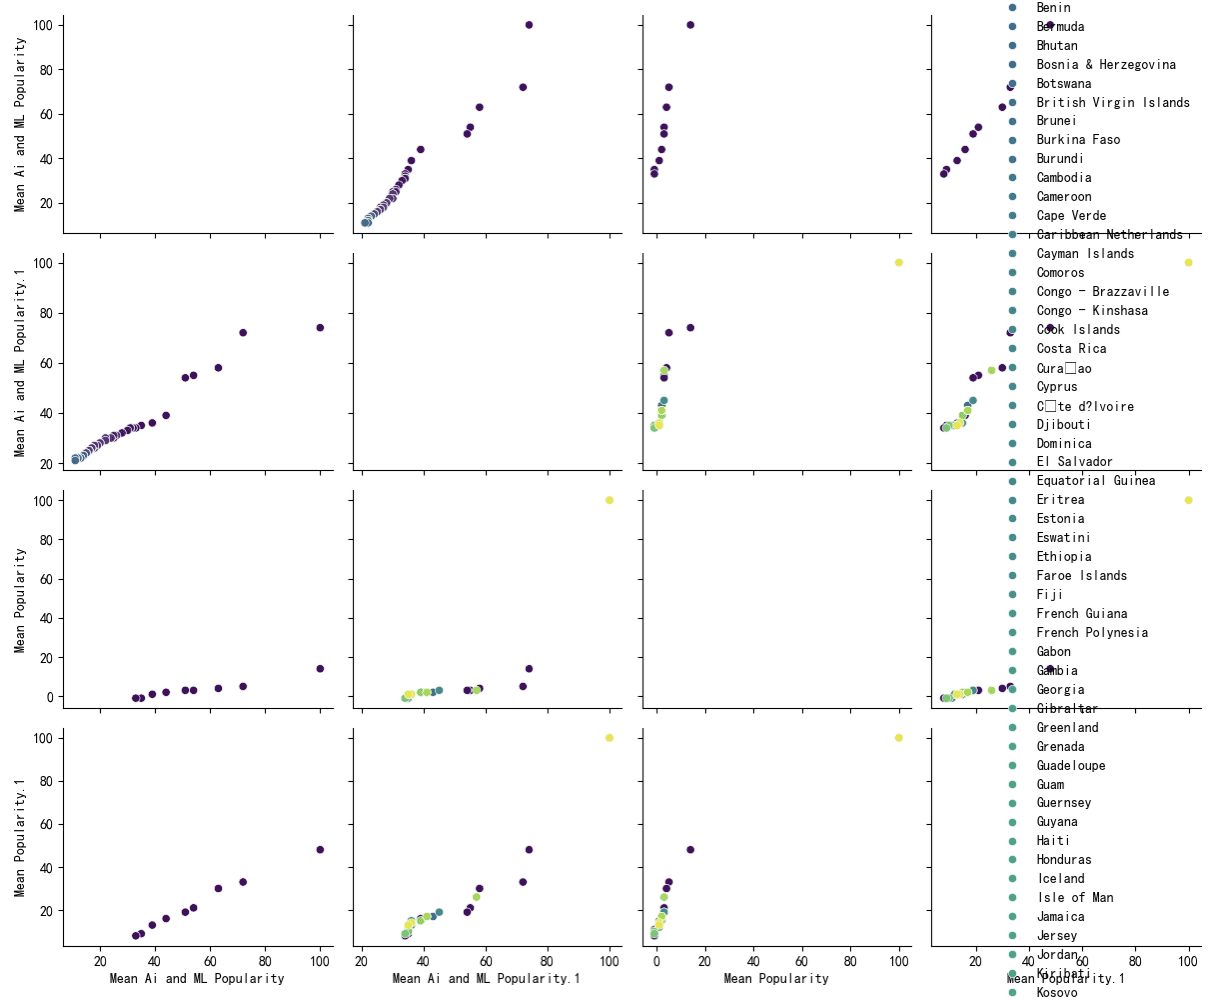
The scatter plot visualizations show the relationship between demographic factors (such as country and city) and the interest in AI and ML.
There is a positive correlation between the 'Mean Ai and ML Popularity' and 'Mean Ai and ML Popularity.1' columns, suggesting that locations with high interest in one measure also tend to have high interest in the other.
The plots also indicate that some countries and cities have significantly higher interest levels, as seen by the data points clustered towards the higher end of the popularity scales.
Variability is observed across different locations, with some showing very high interest (data points near 100) and others showing moderate to low interest.
Key Observations from the Data:
Vietnam (Sil Kapra) shows the highest interest with a score of 100 for 'Mean Ai and ML Popularity' and 74 for 'Mean Ai and ML Popularity.1'.
China (Stanford) and Romania (Shenzhen) also show high interest levels with scores in the 70s and 60s respectively.
The mean popularity scores for general searches are lower, indicating that while AI and ML are of high interest in certain areas, they may not be as popular in the broader context.
Recommendations for Further Analysis:
To gain a more comprehensive understanding, it would be beneficial to analyze additional demographic factors such as education levels, industry presence, and economic factors in these regions.
A deeper analysis into the sectors represented by the highest and lowest popularity scores could provide insights into industry-specific drivers of AI and ML interest.
Data Limitations:
The data provided is limited to 200 rows and does not cover all possible demographic factors that could influence AI and ML interest.
The high standard deviations suggest that there are outliers or a wide range of interest levels that may require more nuanced analysis to fully understand the underlying trends.
Conclusion: Interest in AI and ML varies widely across different sectors and demographic regions. Certain locations demonstrate a particularly high interest, which could be influenced by various factors not fully captured in the provided data. Further analysis with additional demographic and sector-specific data would be necessary to draw more detailed conclusions about the drivers of AI and ML interest.
Temporal Analysis
How has the global interest in AI and ML evolved over recent years?
What significant trends in AI and ML adoption can be identified over time?
Evolution of Global Interest in AI and ML
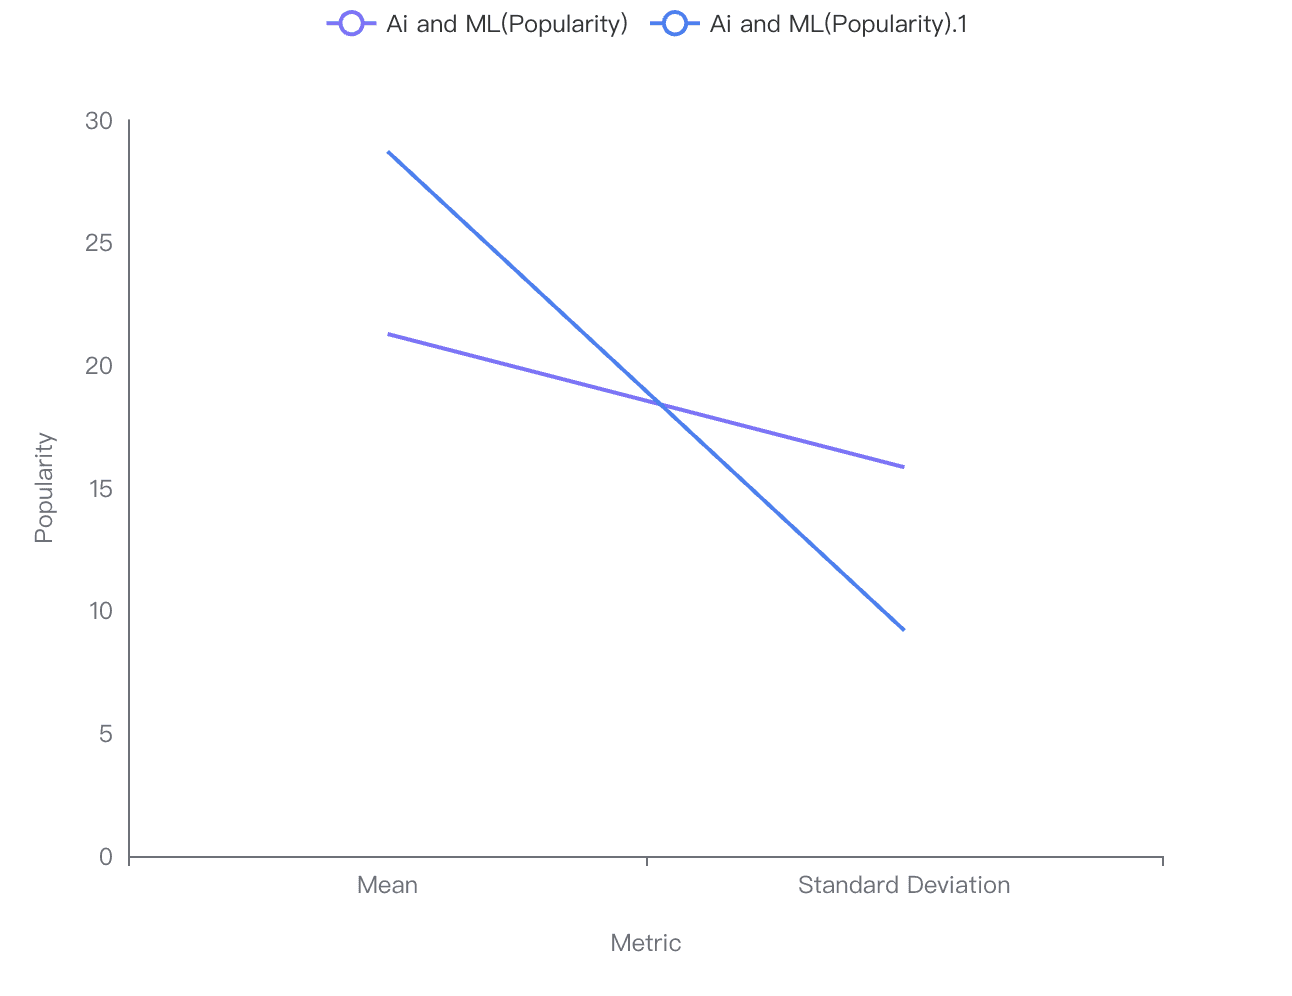
The line chart provided indicates a downward trend in both 'Ai and ML(Popularity)' and 'Ai and ML(Popularity).1' over time. This suggests a decrease in global interest in AI and ML based on the metrics of mean and standard deviation.
Specifically, the 'Ai and ML(Popularity)' shows a decline from a mean of 21.28 to a standard deviation of 15.85, while 'Ai and ML(Popularity).1' decreases from a mean of 28.72 to a standard deviation of 9.19.
Significant Trends in AI and ML Adoption
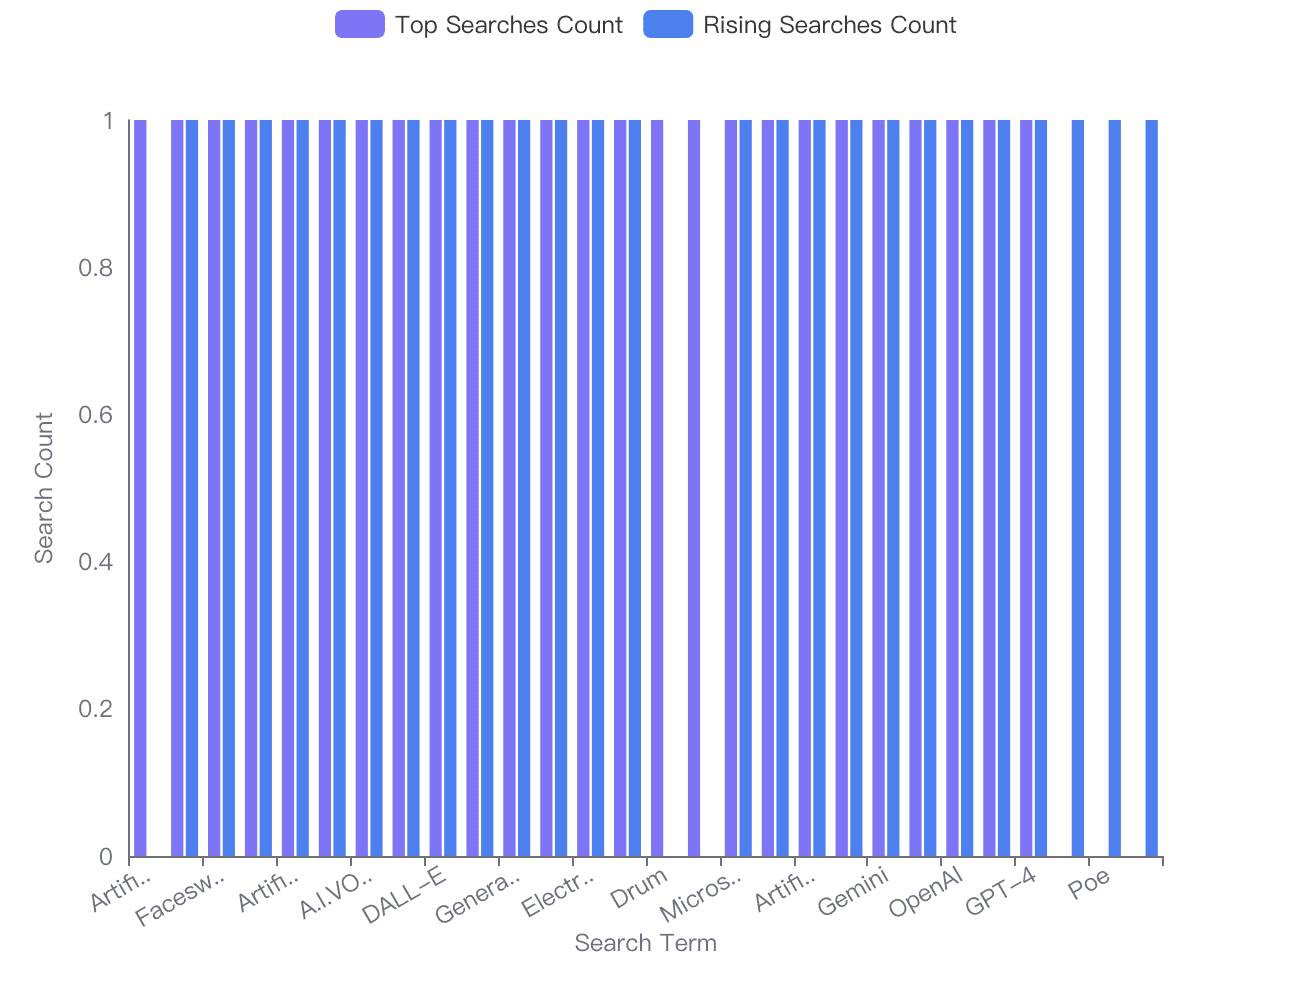
The bar chart visualizes the frequency of 'Top (Searches)' and 'Rising (Searches)' for various AI and ML-related search terms.
High frequency in both 'Top Searches Count' and 'Rising Searches Count' is observed for terms like 'Midjourney', 'Faceswap', and 'Stable Diffusion', indicating these are significant trends in AI and ML adoption.
The search terms 'Artificial intelligence' and 'Ask AI - Chat with Chatbot' also show a strong presence in top searches, but not in rising searches, suggesting they are established interests rather than emerging ones.
Summary
The interest in AI and ML appears to be declining over time based on the provided popularity metrics.
However, specific applications and tools such as 'Midjourney', 'Faceswap', and 'Stable Diffusion' are gaining traction, as indicated by their prominence in both top and rising search counts.
The data suggests a shift in focus from general AI and ML concepts to specific technologies and applications within the field.
Top Searches and Popular Applications
Most Commonly Searched AI and ML Applications/Technologies
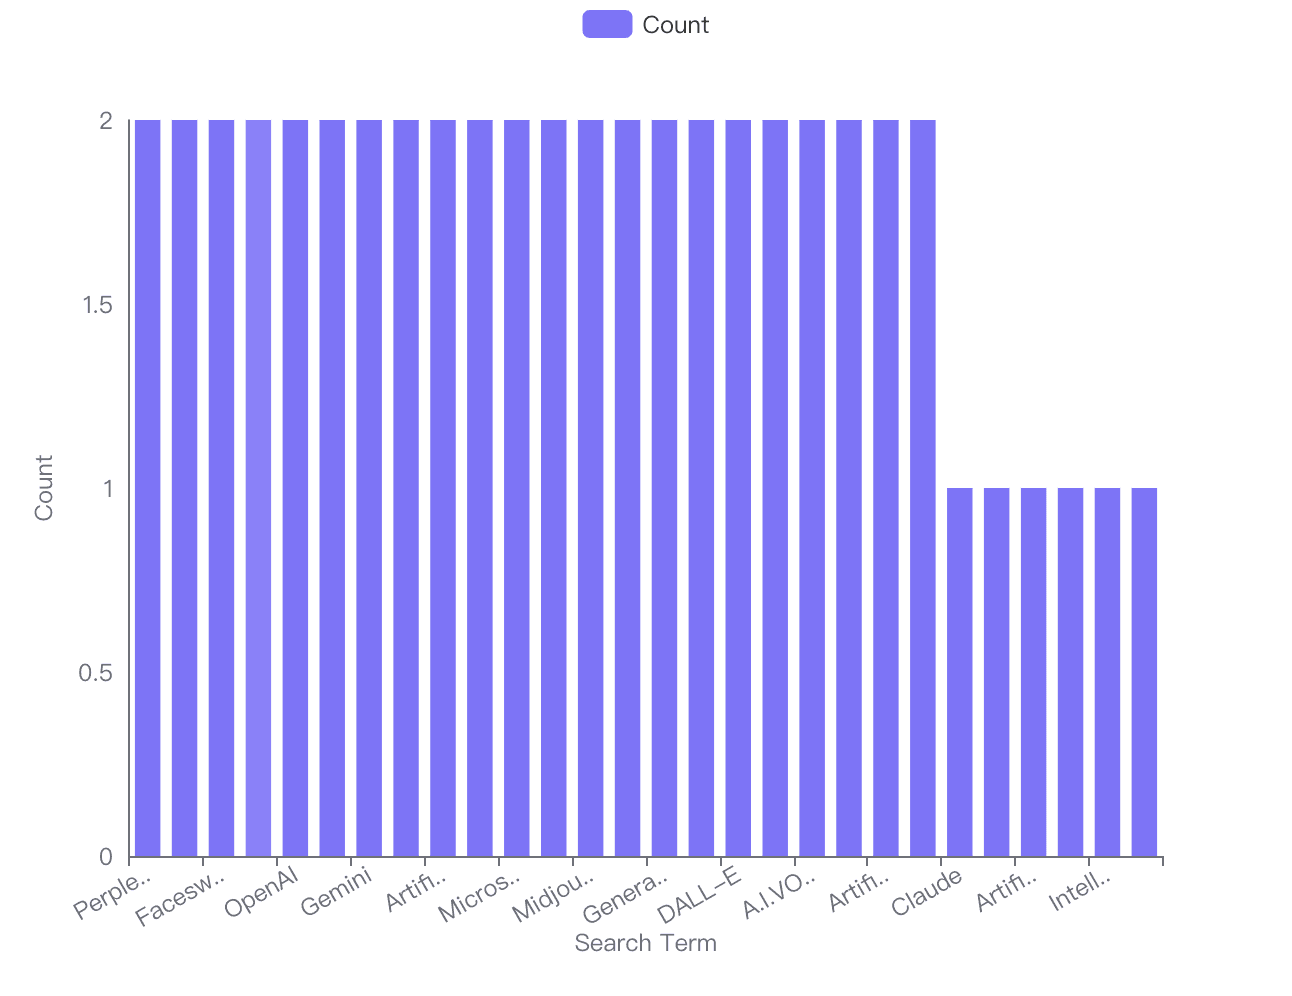
Based on the provided bar chart visualization and the common searches data, the most commonly searched AI and ML applications/technologies include:
Perplexity.ai
Electric generator
Faceswap
Online chat
OpenAI
Each of these terms has a count of 2, indicating they are the top searches in the dataset.
Variation of Interests Across Different Regions
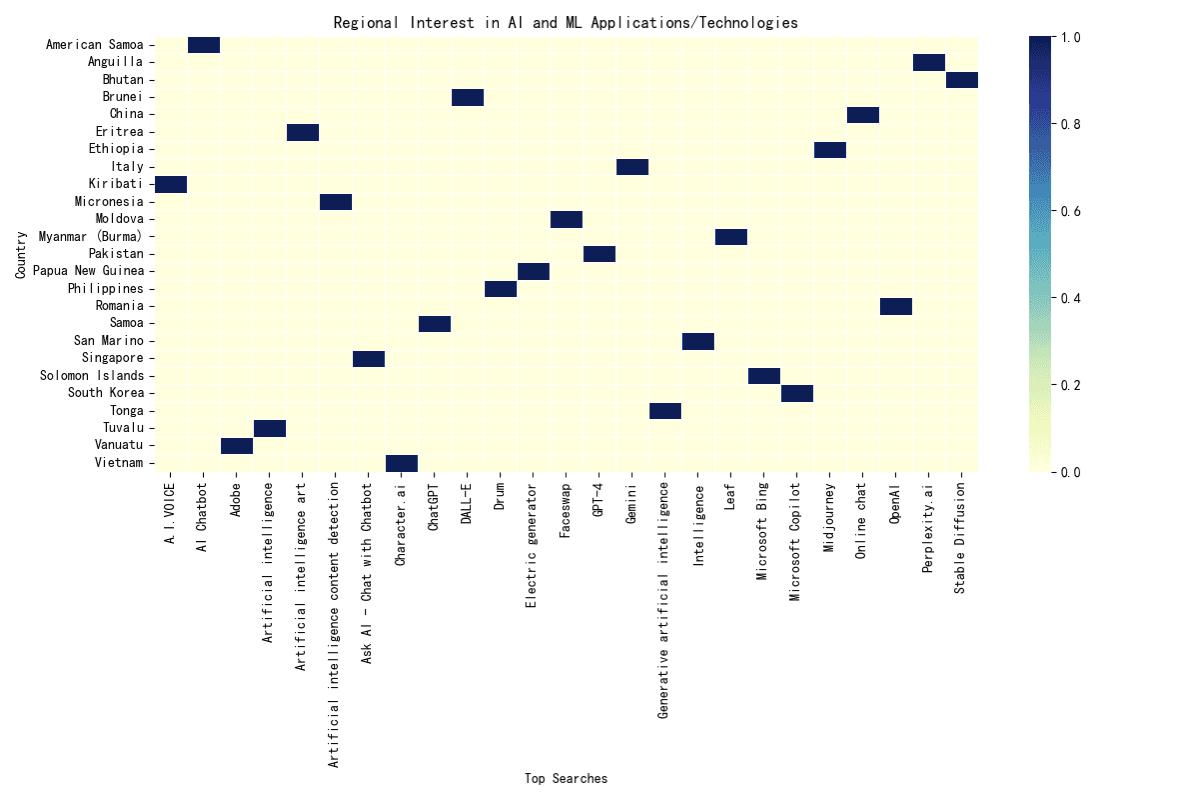
The heatmap visualization indicates that the interest in AI and ML applications/technologies varies significantly across different regions. Some key observations include:
American Samoa shows interest in AI Voice and Chatbot.
Vietnam has a notable interest in Perplexity.ai and Stable Diffusion.
There is a diverse range of interests across countries, with no single technology dominating globally.
Regional Interest Analysis
The regional interest data, although not visualized, provides insight into specific cities and countries' top and rising searches. For example:
In American Samoa, the top search is AI Chatbot, with DALL-E as the rising search.
Additional Observations
The data suggests that while some technologies are consistently popular, there are emerging trends that vary by region.
The heatmap indicates that some countries have a higher concentration of searches for certain technologies, which could be influenced by local industry demands, media coverage, or regional developments in AI and ML.
Note: The analysis is based on the available data, and the actual interests may be influenced by factors not captured in the dataset. For a more comprehensive understanding, additional context and data may be required.
Correlation and Relationship Analysis
The correlation between 'Ai and ML(Popularity)' and 'Ai and ML(Popularity).1' is high, with a value close to 1 (0.981275), indicating a strong positive relationship.
'Ai and ML(Popularity)' and 'Popularity' also show a strong positive correlation, with a coefficient of 0.973913.
The correlation between 'Ai and ML(Popularity)' and 'Popularity.1' is very strong, almost perfect, with a value of 0.994648.
'Ai and ML(Popularity).1' and 'Popularity' have the lowest correlation among the metrics, with a coefficient of 0.780441, which is still considered a moderate to strong correlation.
'Ai and ML(Popularity).1' and 'Popularity.1' have a strong positive correlation, with a coefficient of 0.933217.
Lastly, 'Popularity' and 'Popularity.1' are strongly correlated, with a coefficient of 0.939056.
Try Now:
Try Powerdrill Discover now, explore more interesting data stories in an effective way!