Data Facts of Romania’s Road To EURO 2024

On June 17, 2024, in the first round of the UEFA European Championship group stage, Romania achieved a 3-0 victory, marking a successful start.
Romania was not favored before the start of this match, with the total value of their team being only 92.13 million euros, ranking last among the 24 teams participating in this European Championship. In contrast, their opponent today, Ukraine, has a total team value of 379 million euros, ranking 10th among the 24 teams. However, in this match, Romania performed excellently on the offensive end and was very solid on defense, showcasing their impressive overall strength.
Powerdrill AI has connected to Data.World, which has the most fresh data about the EURO 2024. With the AI data analysis in Powerdrill for this EURO 24 dataset,let's take a look at the data fact of Romania’s Road To EURO 2024.
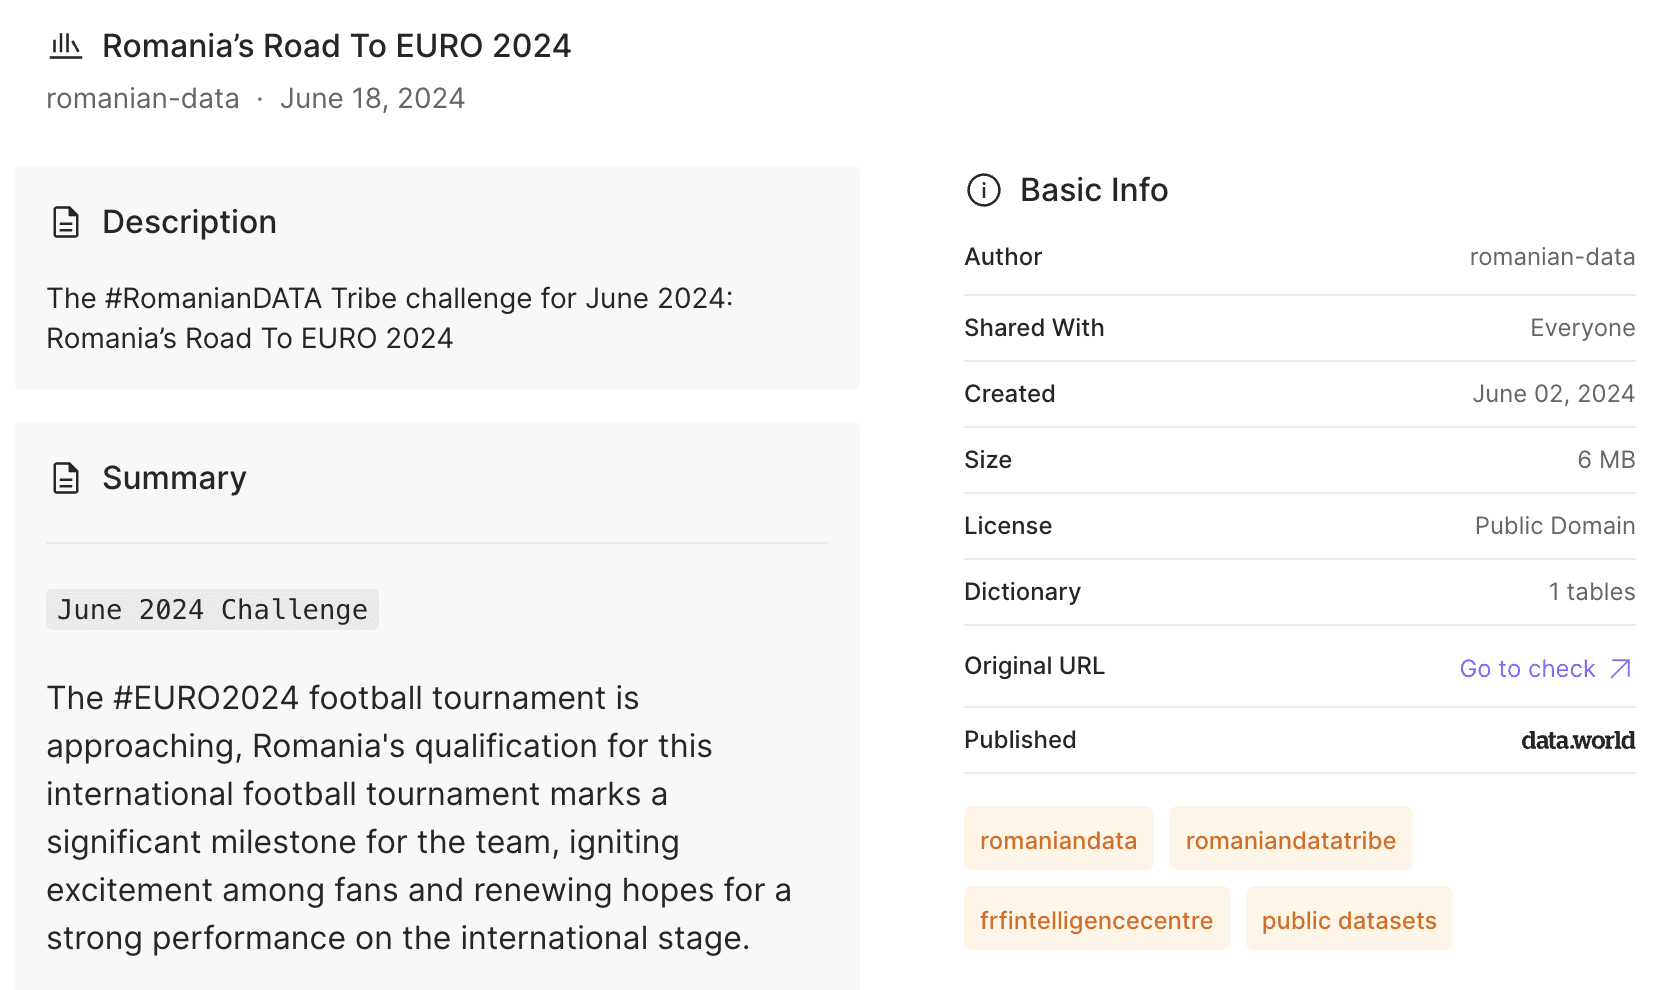
Given the dataset, Powerdrill AI detects and analyzes the metadata, then gives these relevant inquiries about Match Analysis,Team Stratege,Event Analysis,Player Demographics.Then for each of the inquiries, Powerdrill AI can automatically generate Python code to analyze the dataset and provide the answer.
1. Match Analysis:
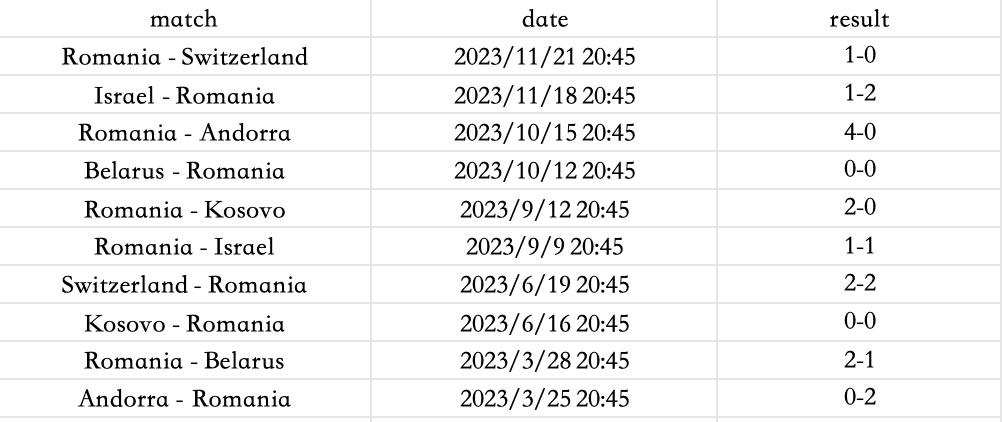
What were the outcomes of Romania's matches leading up to Euro 2024?
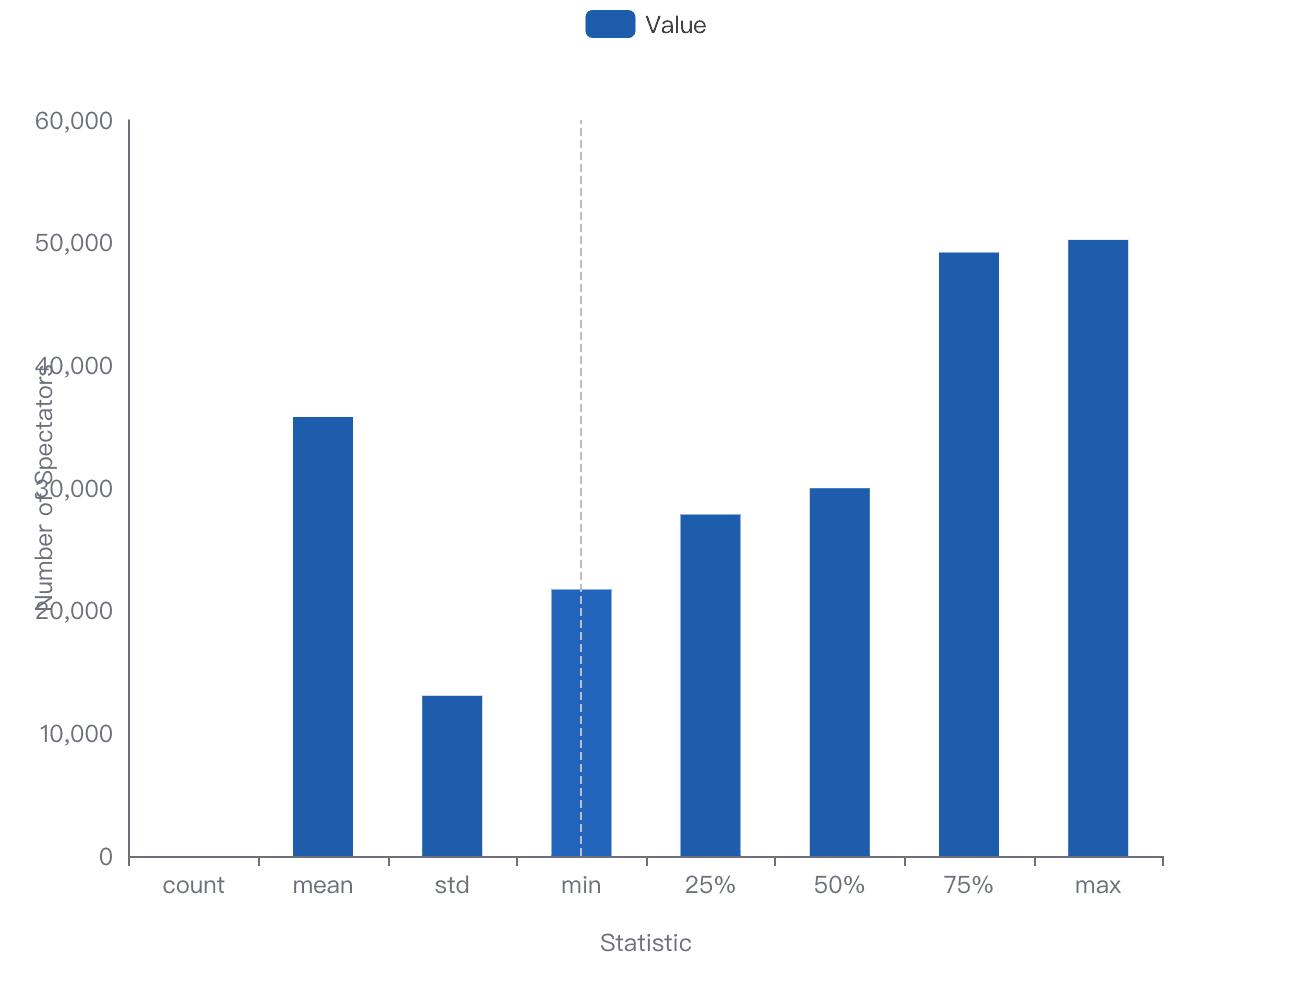
How did the number of spectators vary across different matches?
Based on the provided context and the visualized analytical data, the following conclusions can be drawn about the variation in the number of spectators across different matches of Romania leading up to Euro 2024:
Average Spectators: On average, there were 35,791.8 spectators per match.
Variability in Spectators: The standard deviation is 13,065.6, suggesting a moderate level of variability in the number of spectators across different matches.
Range of Spectators: The minimum number of spectators recorded was 21,723, while the maximum was 50,224.
2. Team Strategy:
What formations has Romania used in different matches?
Variety of Formations:
The Romanian national team has utilized a diverse range of formations in different matches.
Formation List:
The formations recorded include '4-1-4-1', '4-2-3-1', '3-4-3', and '4-4-1-1'.
Most Recent Formation:
The latest formation used, as per the dataset, is '4-1-4-1'.
Repeated Formations:
The formation '4-2-3-1' appears more than once, indicating a possible preference for this setup in multiple games.
How does the team's formation correlate with match outcomes?
Based on the provided context and visualized data, we can draw the following conclusions about the correlation between the Romanian national team's formation and match outcomes:
Most Effective Formations:
The formations 4-1-4-1 and 4-2-3-1 have resulted in the highest number of goals scored (7 goals each) and shots on target (22 and 21 respectively).
Least Effective Formations:
The formations 3-4-3 has been the least effective, with 3-4-3 resulting in 0 goals scored and only 1 shot on target.
Moderate Performance:
The 4-3-3 formation has a moderate outcome with 2 goals scored and 2 shots on target.
Additional Observations:
The visualized data indicates that the Romanian national team has a tendency to perform better in terms of goals scored and shots on target when using a formation with four defenders, one or two holding midfielders (4-1-4-1 or 4-2-3-1), and an attacking orientation.
3. Event Analysis:
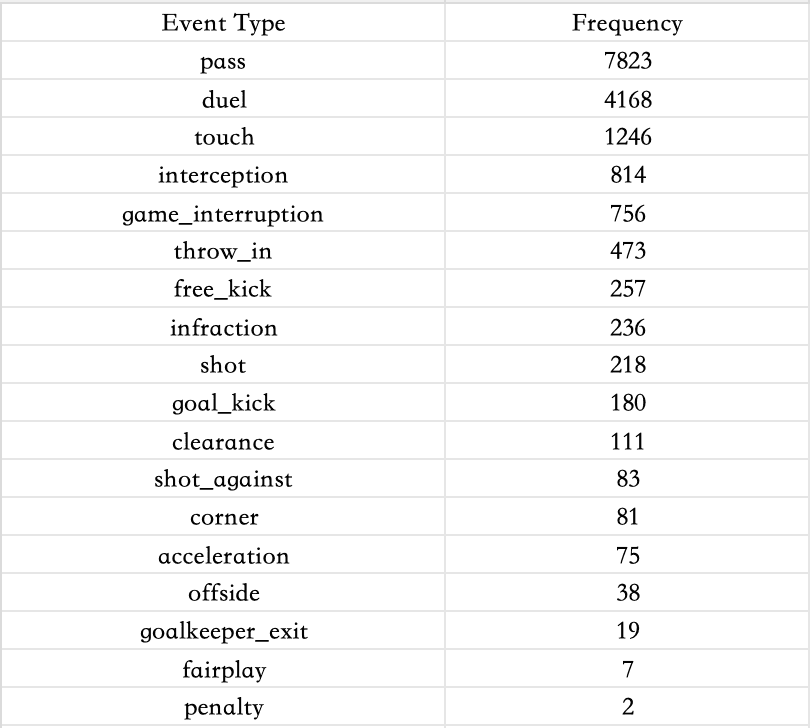
What types of events (e.g., passes, duels, shots) are most frequent in Romania's matches?
Most Frequent Event:
The most common type of event in Romania's matches is the pass, with a frequency of 7823 occurrences.
Second Most Frequent Event:
The duel event is the second most frequent, with 4168 occurrences.
Additional Event Information:
Other events such as touch (1246 occurrences), interception (814 occurrences), and game interruption (756 occurrences) also occur but with less frequency compared to passes and duels.
Statistical Overview:
The data provided has a mean frequency of 921.50 events, with a standard deviation of 1978.29, indicating a wide variation in the frequency of different event types. The minimum frequency recorded is 2, and the maximum is 7823.
How did the timing and location of key events (e.g., goals, interceptions) influence match outcomes?
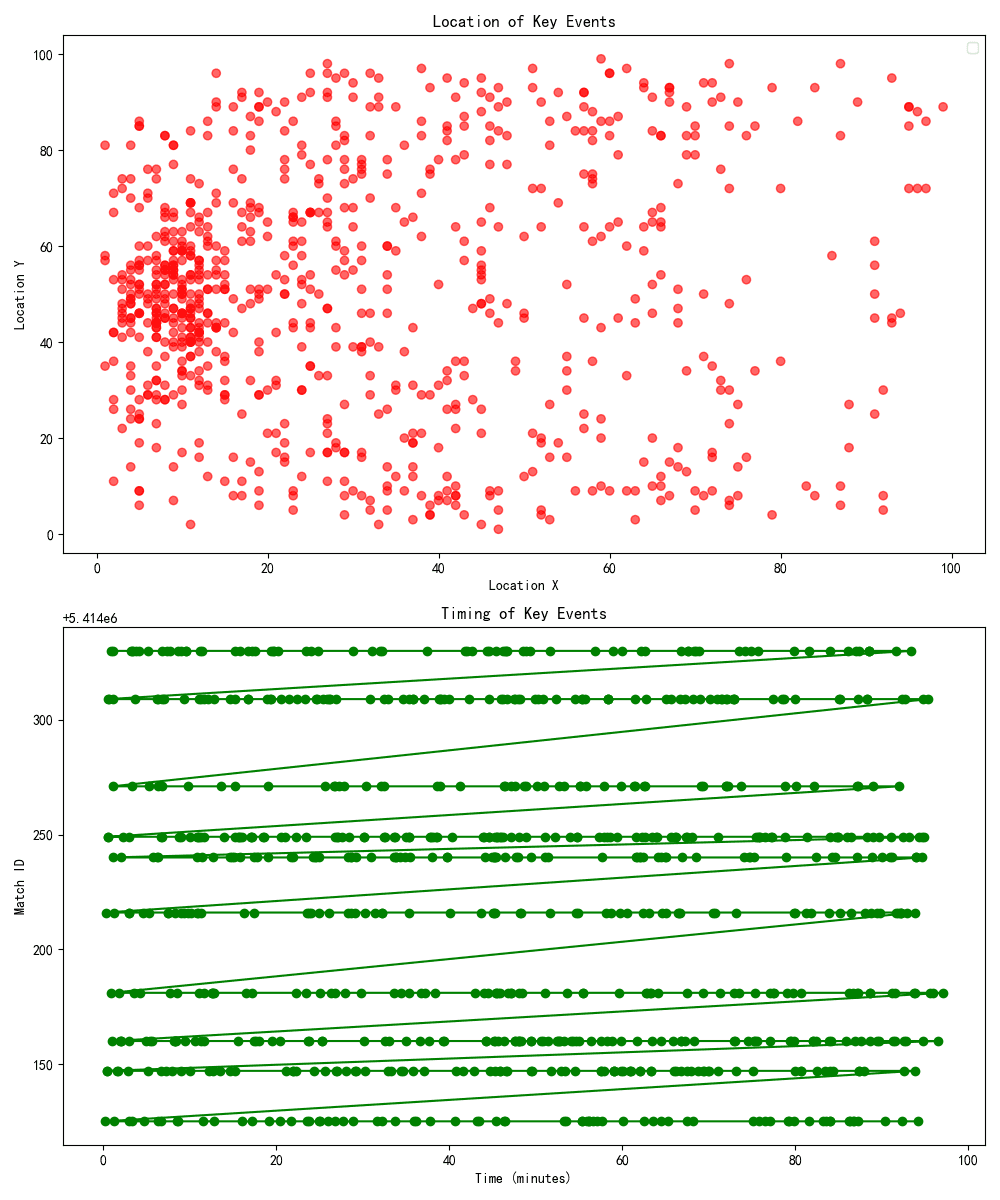
Location of Key Events:
The scatter plot visualizes the distribution of key events across the field, with the x-axis representing the width of the pitch (Location X) and the y-axis representing the length of the pitch (Location Y).
High concentration of events is observed in the central area of the pitch, particularly between the 20-60 range on the x-axis and the 30-70 range on the y-axis. This suggests that key events frequently occur in the midfield area.
Timing of Key Events:
The line plot shows the timing of key events throughout the matches, with the x-axis representing time in minutes and each line representing a different match (Match ID on the y-axis).
Events are evenly distributed throughout the match duration, with a slight increase in frequency towards the end of each half (around the 45th and 90th minutes), which may indicate critical moments where the likelihood of key events increases.
Influence on Match Outcomes:
The location data suggests that controlling the midfield could be crucial, as many interceptions occur there.
The timing data indicates that teams may need to be particularly vigilant during the closing stages of each half.
4. Player Demographics:
What are the age, height, and weight distributions of the Romanian national team players?
Age Distribution Analysis:
The histogram provided shows the age distribution of the Romanian national team players.
The age range appears to be from early 20s to late 30s, with a higher frequency in the mid to late 20s.
Key Age Statistics: The mean age is 27.03 years, with a standard deviation of 3.52 years. The youngest player is 22 years old, and the oldest is 37 years old.
Height Distribution Analysis:
The histogram for height distribution was not provided, but the statistical data indicates the following:
Key Height Statistics: The mean height is 183.42 cm, with a standard deviation of 5.65 cm. The shortest player is 170 cm tall, and the tallest is 197 cm.
Weight Distribution Analysis:
The histogram provided shows the weight distribution of the Romanian national team players.
The weight range is from around 60 kg to just under 90 kg, with a higher frequency around the 70-80 kg range.
Key Weight Statistics: The mean weight is 75.89 kg, with a standard deviation of 5.79 kg. The lightest player weighs 63 kg, and the heaviest is 87 kg.
Visual Data Analysis:
The histograms for age and weight distributions visually represent the frequency of different age groups and weight ranges, respectively.
The age distribution histogram shows a relatively uniform distribution with a slight increase in frequency for the 29 and 30-year-old age groups.
The weight distribution histogram shows a relatively uniform distribution across the weight ranges provided.
Overall Observation:
The Romanian national team players have a diverse range of ages, heights, and weights, with a concentration of players in their mid to late 20s, average heights around 183 cm, and weights around 75-80 kg.
The data suggests a team with a mix of youth and experience, as well as a variety of physical attributes that can be advantageous in different positions on the field.
How do the market values of players in 2023 compare to their values in 2022?
Based on the provided dataset and the visualized bar chart, we can draw several conclusions about the changes in market value of Romanian players from 2022 to 2023:
Market Value Increase:
Some players have experienced an increase in their market value from 2022 to 2023. For example:
Ștefan Târnovanu: Increased from €2.00m in 2022 to €3.00m in 2023.
Horațiu Moldovan: Increased from €2.00m in 2022 to €2.50m in 2023.
Răzvan Sava: Had a significant increase from €100k in 2022 to €2.00m in 2023.
Market Value Decrease:
At least one player's market value has decreased over the same period:
Florin Niță: Decreased from €300k in 2022 to €225k in 2023.
Significant Market Value Change:
One player, in particular, has seen a substantial increase in market value:
Radu Drăgușin: His market value skyrocketed from €8.00m in 2022 to €25.00m in 2023.
Overall Trend:
The bar chart indicates that for most players, there has been a general increase in market value from 2022 to 2023, with only a few exceptions showing a decrease.
The success of any team is not accidental. By analyzing the data from pre-European Championship matches, we can better understand the Romanian team, as well as its unique style and resilience.
Try Now:
Try Powerdrill Discover now, explore more interesting data stories in an effective way!