Data Facts of Online Dating Matches
Yulu Jiang
Jun 25, 2024

About the dataset
Name:Predict Online Dating Matches Dataset
Source: Kaggle
AI Data Analysis powered by Powerdrill AI
Today I found an interesting dataset named predict Online Dating Matches Dataset. It includes 1000 pieces of anonymous data about online dating behavior, so I used powerdrill.ai to further analyze it.
Relevant Inquiries
Gender Differences in VIP Membership: Are there significant differences in the proportion of males and females who purchase VIP memberships?
Income and VIP Membership: Is there a correlation between income levels and the likelihood of purchasing a VIP membership?
Age and Matches: How does age affect the number of matches a user receives?
Attractiveness and Matches: Is there a relationship between a user's attractiveness rating and the number of matches they receive?
Children and Online Dating Behavior: How does having children impact the number of matches and the likelihood of purchasing a VIP membership?
Income Distribution: What is the income distribution among users, and how does it vary by gender?
Age Distribution: What is the age distribution of users, and how does it vary by gender?
Attractiveness Ratings: What is the distribution of attractiveness ratings among users, and how does it correlate with other variables like age and income?
VIP Membership and Matches: Do users with VIP memberships receive more matches compared to those without?
Demographic Profiles: What are the demographic profiles (age, income, children) of users who are most likely to purchase VIP memberships?
These inquiries can help in understanding user behavior and preferences in the context of online dating.Now let's see the conclusion.
1.Are there significant differences in the proportion of males and females who purchase VIP memberships?
Gender Differences in VIP Membership Purchases:
Female VIP Purchase Proportion:
47.65% of females have purchased VIP memberships.
Male VIP Purchase Proportion:
47.14% of males have purchased VIP memberships.
Statistical Significance:
The difference in VIP membership purchase between genders is not significant, as indicated by the close percentages (47.65% for females and 47.14% for males) and the low standard deviation (std=0.36) in the Yes_VIP_Percentage column.
Overall Insight:
Both genders show a similar inclination towards purchasing VIP memberships, with females being slightly more likely to purchase than males, but the difference is marginal.
2. Is there a correlation between income levels and the likelihood of purchasing a VIP membership?

Based on the provided context and visualized analytical data, the following conclusions can be drawn regarding the correlation between income levels and the likelihood of purchasing a VIP membership:
Correlation Analysis: The statistical data indicates a slight negative correlation between income levels and the likelihood of purchasing a VIP membership. Individuals with a 'No' response to PurchasedVIP have a slightly higher mean income ($51,175.20) compared to those with a 'Yes' response ($50,781.21).
Visual Representation: The box plot visualization supports the statistical data, showing that the median income for those who have not purchased a VIP membership is marginally higher than for those who have. The interquartile range (IQR) appears to be very small for both groups, suggesting low variability within each group.
Income Difference: The difference in mean income between the two groups is $393.99, which is relatively small given the overall income levels. This suggests that income may not be a strong predictor of VIP membership purchase.
Key Points Emphasized:
Slight negative correlation between income and VIP membership purchase.
Mean income is marginally higher for non-VIP members.
Low variability in income within both VIP and non-VIP groups.
Income difference between groups is minimal, indicating other factors may influence the decision to purchase a VIP membership.
3.How does age affect the number of matches a user receives?

Based on the provided data and the visualization of the relationship between age and the average number of matches, we can draw the following conclusions:
Variability in Matches: The average number of matches varies significantly across different age groups.
Peak Matches in Younger and Middle Age Groups: The age groups 18-24 and 30-34 have the highest average number of matches, with 81.52 and 82.78 respectively.
Decline in Matches for Late Thirties: There is a noticeable decline in the average number of matches for the age group 35-39, with the lowest average of 68.98.
Recovery in Matches for Early Forties: The average number of matches increases for the age group 40-44 to 78.29.
4.Is there a relationship between a user's attractiveness rating and the number of matches they receive?
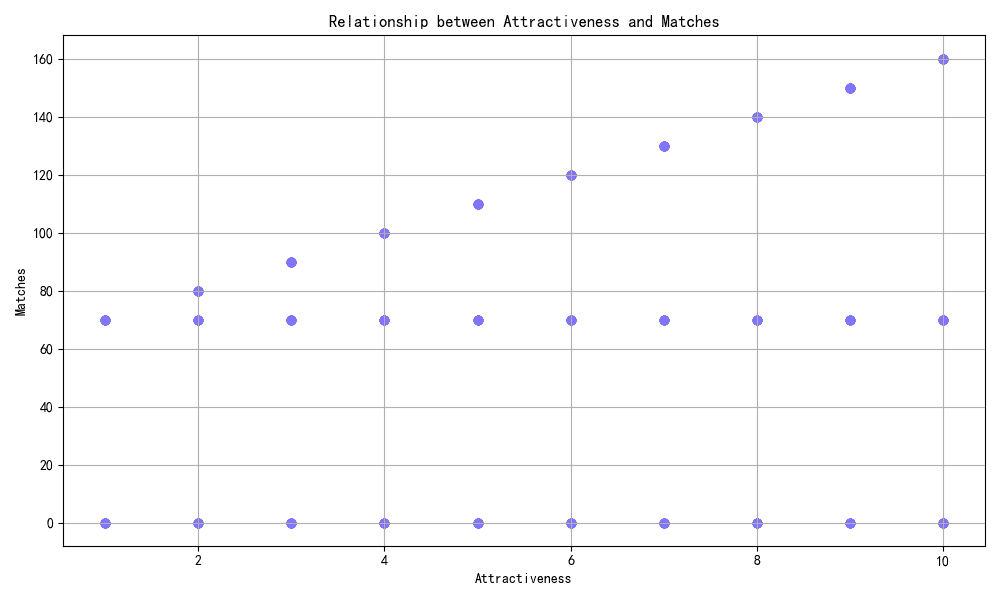
Based on the provided context and the scatter plot visualization, the following conclusions can be drawn about the relationship between 'Attractiveness' and 'Matches':
Correlation: The correlation coefficient between 'Attractiveness' and 'Matches' is 0.31, which indicates a positive but weak relationship. This suggests that as attractiveness ratings increase, the number of matches tends to increase as well, but other factors may also play a significant role in determining the number of matches.
Data Distribution: The mean attractiveness rating is 5.62 with a standard deviation of 2.82, and the mean number of matches is 76.05 with a standard deviation of 52.71. This indicates a wide range of values for both attractiveness and matches.
Scatter Plot Analysis: The scatter plot shows that there is some degree of positive trend, where higher attractiveness ratings are associated with a higher number of matches. However, there are also instances where individuals with high attractiveness ratings have few or no matches, and vice versa.
Outliers and Anomalies: The scatter plot may also reveal outliers or anomalies, such as individuals with high attractiveness ratings but unexpectedly low numbers of matches, or those with lower attractiveness ratings receiving a high number of matches. These cases could be of interest for further investigation to understand the dynamics beyond the scope of attractiveness alone.
Conclusion: While there is a positive correlation between attractiveness and matches, the relationship is not strong, and there are likely other factors influencing the number of matches a user receives. The data suggests that attractiveness is one of several factors that could impact the matching process on the platform.
5.How does having children impact the number of matches and the likelihood of purchasing a VIP membership?
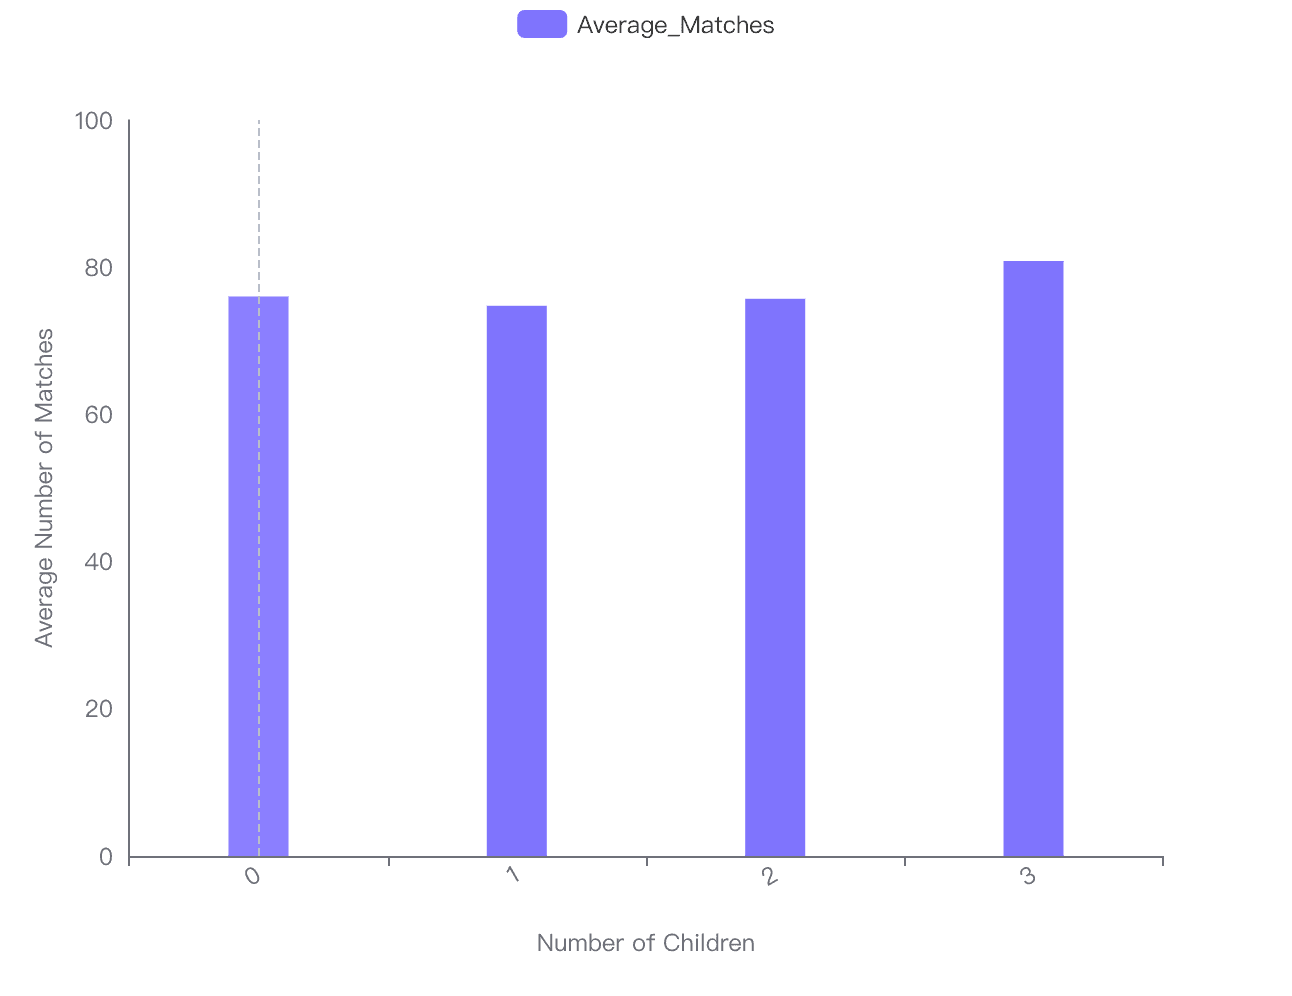
Impact of Having Children on the Number of Matches
Based on the provided data, the impact of having children on the average number of matches a user receives can be summarized as follows:
Users with no children have an average of 76.02 matches.
Users with one child have a slightly lower average of 74.76 matches.
Users with two children see a minor increase with an average of 75.71 matches.
Users with three children experience the highest average number of matches at 80.83.
The data suggests that users with three children receive the most matches, while those with one child receive the fewest. However, the differences in the average number of matches across the groups are relatively small, indicating that the number of children has a modest impact on the number of matches.
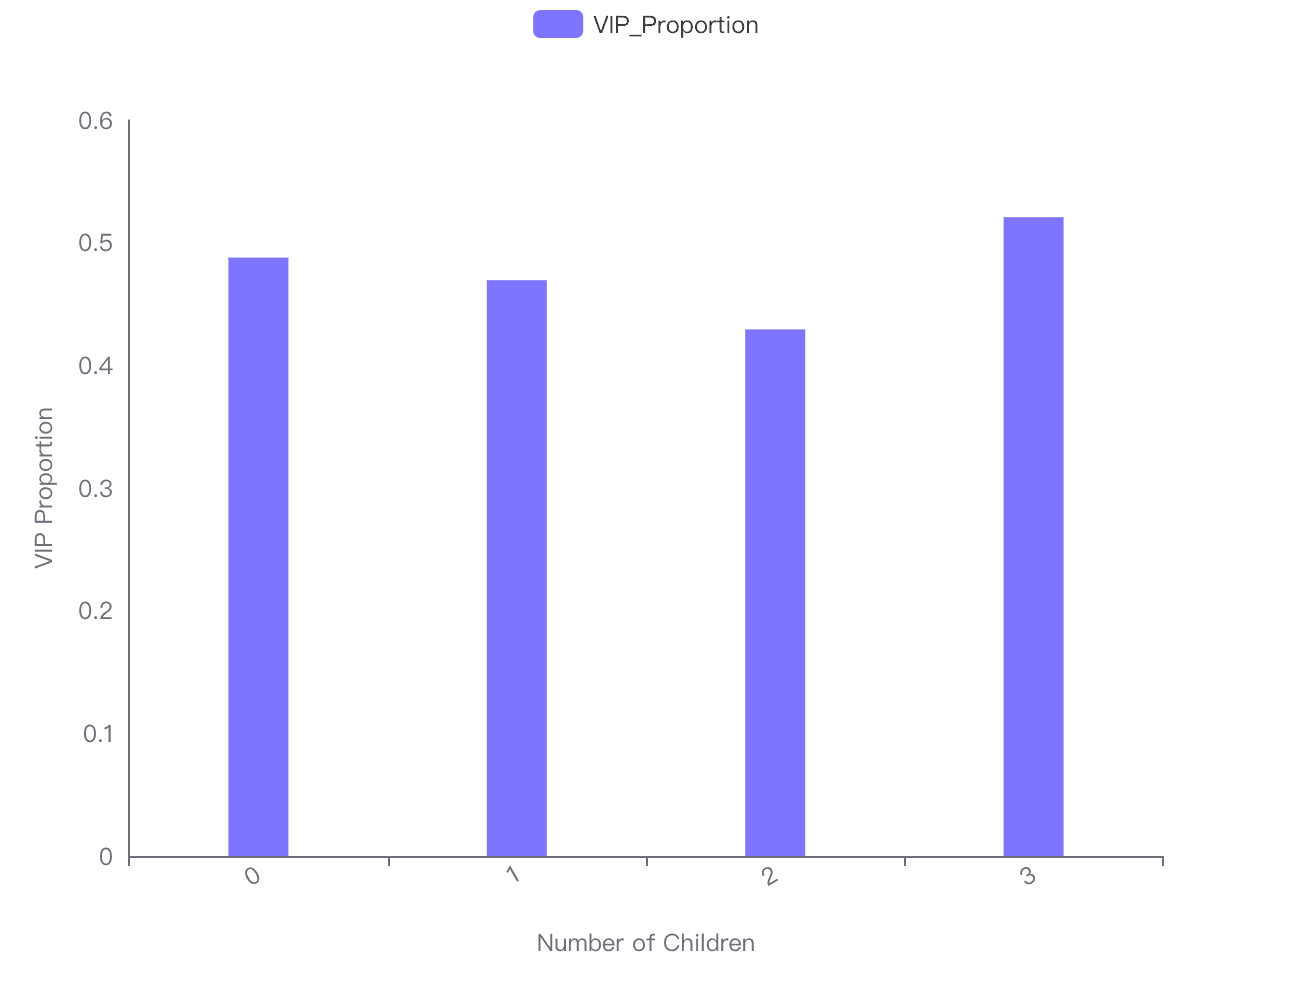
Impact of Having Children on the Likelihood of Purchasing a VIP Membership
The analysis of the likelihood of purchasing a VIP membership based on the number of children is as follows:
Users with no children have a VIP membership proportion of 0.487864 (48.79%).
Users with one child show a slightly lower proportion at 0.469388 (46.94%).
Users with two children have the lowest proportion at 0.429293 (42.93%).
Users with three children have the highest likelihood of purchasing a VIP membership with a proportion of 0.520833 (52.08%).
The trend indicates that users with three children are the most likely to purchase a VIP membership, while those with two children are the least likely. The variation in VIP membership proportions suggests that the number of children a user has can have a notable influence on their decision to purchase a VIP membership.
6.What is the income distribution among users, and how does it vary by gender?

Overall Income Distribution Among Users:
Total Users Analyzed: 1000
Mean Income: $50,988.45
Standard Deviation: $9,889.34
Minimum Income: $20,786.00
25th Percentile: $44,358.50
Median Income: $50,841.50
75th Percentile: $57,396.00
Maximum Income: $81,931.00
Income Distribution by Gender:
Female Users:
Count: 510
Mean Income: $51,329.89
Standard Deviation: $10,195.75
Minimum Income: $21,514.00
25th Percentile: $44,509.50
Median Income: $51,259.00
75th Percentile: $58,137.75
Maximum Income: $81,931.00
Male Users:
Count: 490
Mean Income: $50,633.07
Standard Deviation: $9,557.44
Minimum Income: $20,786.00
25th Percentile: $44,204.00
Median Income: $50,593.00
75th Percentile: $56,661.50
Maximum Income: $75,269.00
Key Observations:
The overall income distribution indicates a moderate spread around the mean with a standard deviation of $9,889.34.
The income distribution for female users shows a slightly higher mean income and a higher maximum income compared to male users.
The income distribution for male users shows a lower median income and a lower maximum income compared to female users.
The 75th percentile for female users is notably higher than that of male users, suggesting that the top quartile of female users tends to have higher incomes.
7.What is the age distribution of users, and how does it vary by gender?
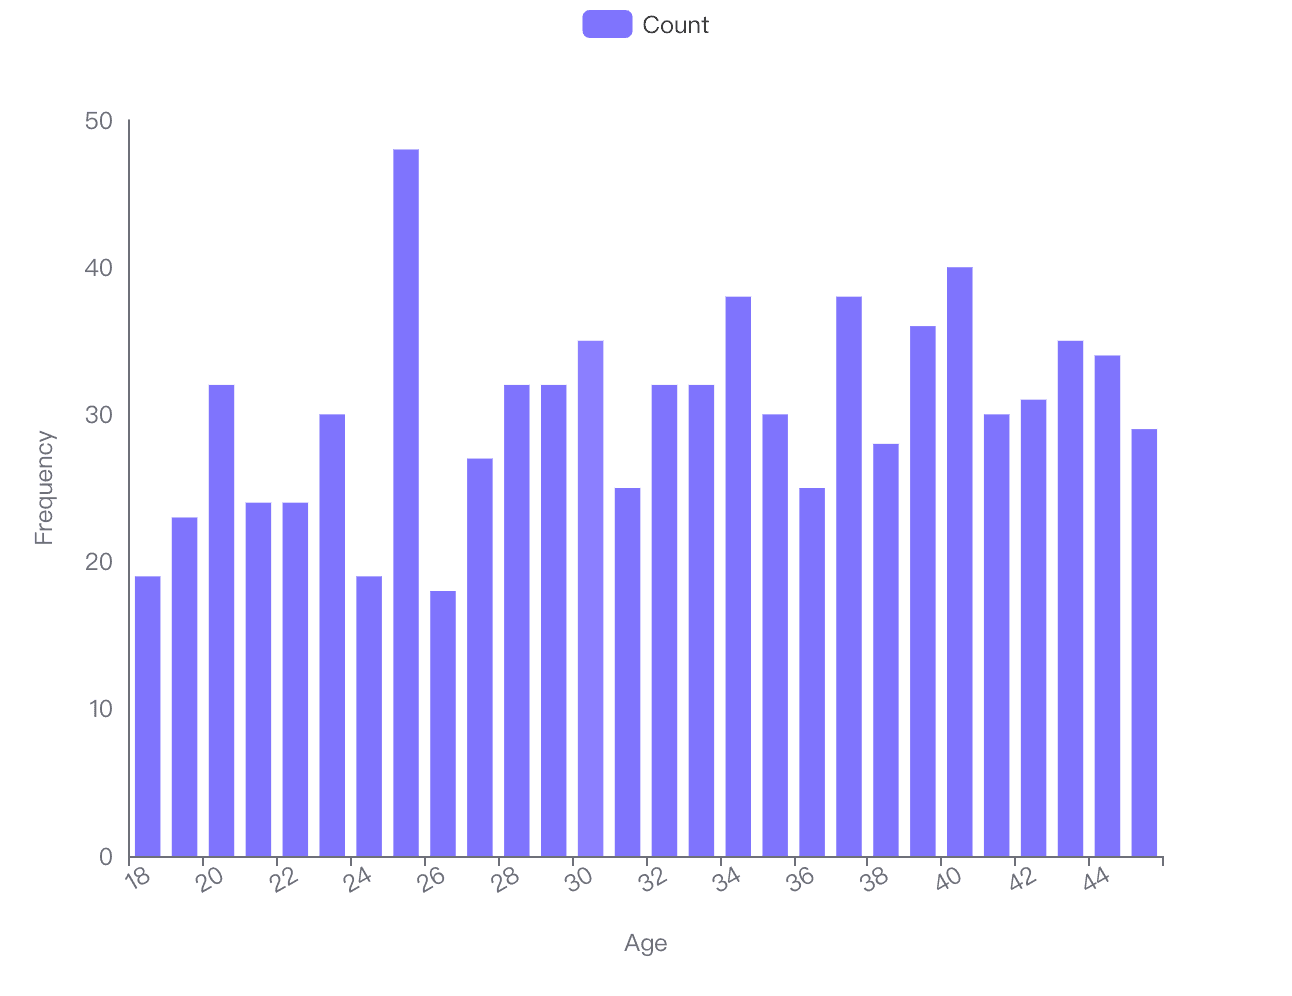
Age Distribution of Users
Overall Age Range: 18 to 49 years
Mean Age: 33.5 years
Standard Deviation: 9.38 years
Most Common Ages: Early 20s to late 30s
Age Distribution by Gender
Female Users:
Count: 510
Mean Age: 34.55 years
Standard Deviation: 9.18 years
Age Range: 18 to 49 years
Median Age: 35 years
Interquartile Range: 27 to 43 years
Male Users:
Count: 490
Mean Age: 34.69 years
Standard Deviation: 9.13 years
Age Range: 18 to 49 years
Median Age: 35 years
Interquartile Range: 27 to 42 years
Observations
The age distribution is fairly similar for both genders, with a slightly higher mean age for males.
The median age is 35 years for both genders, indicating a balanced distribution around the central value.
The interquartile range is slightly wider for females, suggesting a bit more variability in the ages of female users compared to male users.
8.What is the distribution of attractiveness ratings among users, and how does it correlate with other variables like age and income?
Attractiveness and Income Correlation:
The correlation between 'Attractiveness' and 'Income' is extremely low with a value of approximately 0.0055. This suggests that there is no significant linear relationship between these two variables.
Attractiveness Ratings Distribution:
The histogram provided shows the distribution of attractiveness ratings among users. The ratings appear to be fairly evenly distributed across the scale, with a slight tendency towards the middle ratings (4, 5, and 6).
Attractiveness and Age Correlation:
The correlation between 'Attractiveness' and 'Age' is negative with a value of approximately -0.0508. This indicates a very slight tendency for attractiveness ratings to decrease as age increases, but the relationship is weak.
Key Observations:
No strong correlation between attractiveness and income or age.
Attractiveness ratings are evenly spread among users, with no extreme biases towards high or low ratings.
The visual data supports the statistical findings, showing no clear pattern or trend in the scatter plots.
9.Do users with VIP memberships receive more matches compared to those without?
VIP Membership Impact: Users with VIP memberships receive significantly more matches compared to those without.
Average Matches for Non-VIPs: 59.14
Average Matches for VIPs: 94.81
Statistical Significance: The standard deviation is 25.22, which suggests a considerable difference between the two groups.
Data Overview: The analysis is based on two distinct groups - VIP and non-VIP users.
Recommendation: The data indicates that purchasing a VIP membership could be beneficial for users looking to increase their number of matches.
10.What are the demographic profiles (age, income, children) of users who are most likely to purchase VIP memberships?
Age Distribution of VIP Users:
The average age of VIP users is 34.51 years.
The age range is from 18 to 49 years, with the majority of users being in their mid-30s, as the median age is 35 years.
The age distribution is relatively standard with a standard deviation of 9.29 years, indicating moderate variability around the mean age.
Income Distribution of VIP Users:
The average income of VIP users is $50,781.21.
Income varies significantly among VIP users, with a standard deviation of $9,379.35.
The income range for VIP users is 25005 to81,931.
The median income is $50,656.50, suggesting that half of the VIP users earn less than this amount and the other half earn more.
Children Distribution of VIP Users:
The average number of children among VIP users is 1.50.
The standard deviation is 1.29, indicating a wide spread in the number of children.
The number of children ranges from 0 to 3, with the most common being 0 children (201 users), followed by 1 child (138 users), 2 children (85 users), and 3 children (50 users).