Data Facts of Best-Selling Music Artists

About the dataset
Name: Best-Selling Music Artists
Source: Kaggle
AI Data Analysis powered by Powerdrill AI
I am a music fan, when I saw the dataset about Best selling music artists, I was eager to gain a deeper understanding of it, so I used Powerdrill.ai for data analysis!
Relevant Inquiries
Top Artists by Claimed Sales: Which artists have the highest claimed sales?
Genre Popularity: What are the most common genres among the best-selling music artists?
Country Representation: Which countries have the most artists in the list of best-selling music artists?
Species differentiation:Are there any notable differences in claimed sales between solo artists and bands?
Release Year Trends: What trends can be observed in the release years of the first charted records?
Longevity and Success: Is there a relationship between the length of an artist's career and their claimed sales?
Regional Dominance: Are there specific regions that dominate certain genres?
New vs. Established Artists: How do newer artists (e.g., those who started after 2000) compare in sales to more established artists?
These inquiries can help in understanding various aspects of the music industry and the success factors of best-selling artists.
1.Which artists have the highest claimed sales?
Top Artists by Claimed Sales:
The Beatles stand out as the leading artist with the highest claimed sales at 600 million units.
Elvis Presley and Michael Jackson are tied for the second-highest claimed sales, each with 500 million units.
Elton John and Queen share the third position, both with claimed sales of 300 million units.
Statistical Overview of Claimed Sales:
The average (mean) claimed sales across all artists is 132.07 million units.
There is a significant standard deviation of 83.53 million, indicating a wide range in the claimed sales figures.
The minimum claimed sales recorded are 75 million units, while the maximum is 600 million units as seen with The Beatles.
2.What are the most common genres among the best-selling music artists?
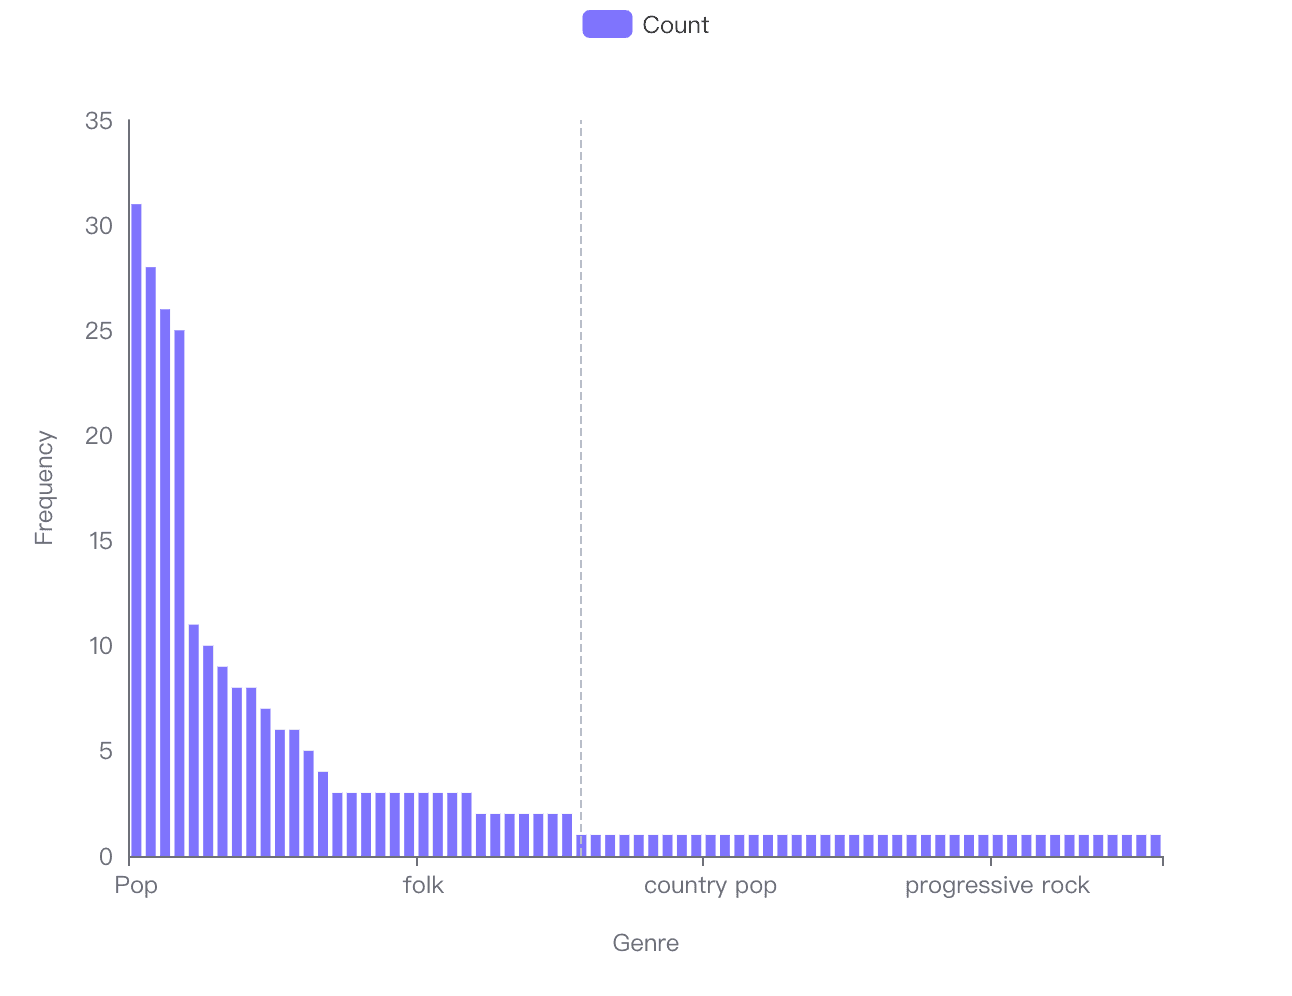
Based on the provided data visualization and statistical information, the most common genres among the best-selling music artists are as follows:
Pop: With a combined total of 59 instances when considering both 'Pop' and 'pop' as the same genre.
Rock: Similarly, combining 'Rock' and 'rock' gives a total of 37 instances.
R&B: Stands as the third most common genre with 25 instances.
Key Observations:
The genre labels appear to have inconsistencies in capitalization, which affects the count. Standardizing the genre names by case would provide a more accurate frequency distribution.
The bar chart visualizes the frequency of each genre, with 'Pop' and 'Rock' genres showing the highest bars, indicating their prevalence among best-selling music artists.
3.Which countries have the most artists in the list of best-selling music artists?
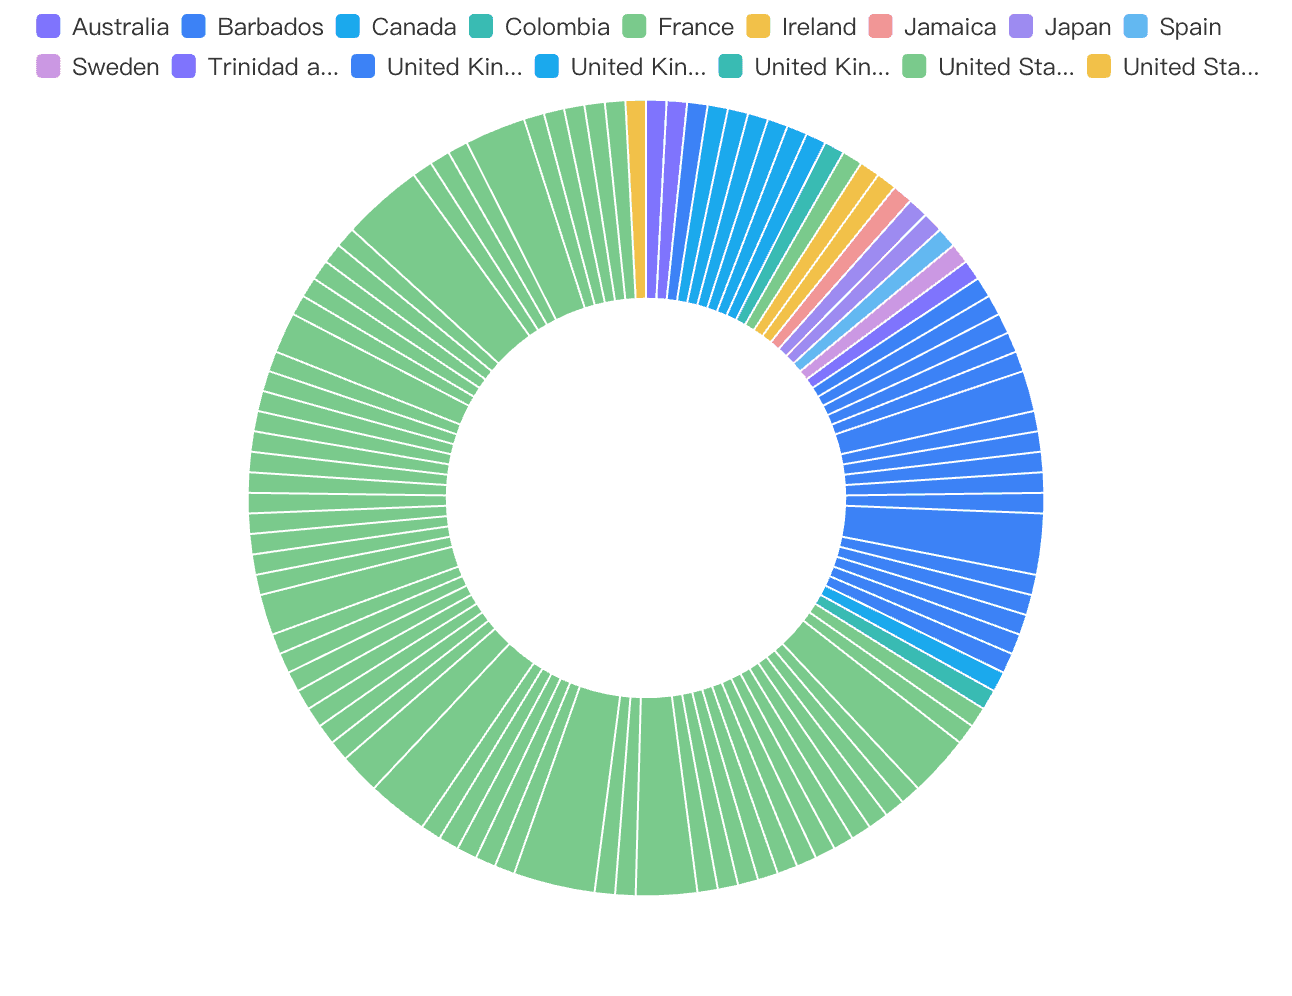
Most Artists Origin: The United States has the highest number of best-selling music artists.
Significant Presence: The United Kingdom follows with a notable count.
Other Contributors: Canada, Australia, and Ireland also contribute artists, albeit in smaller numbers.
Key Data Points:
United States: 79 artists
United Kingdom: 20 artists
Canada: 6 artists
Australia: 2 artists
Ireland: 2 artists
The data indicates a significant dominance of artists from the United States in the list of best-selling music artists.
4.Are there any notable differences in claimed sales between solo artists and bands?
Average Claimed Sales:
Solo Artists: The average claimed sales for solo artists is 130.67 million.
Bands: The average claimed sales for bands is 136.13 million.
Data Analysis Observations:
The standard deviation for the average claimed sales is 3.86, indicating a relatively small variance between the two groups.
The minimum and maximum average claimed sales values are 130.67 million for solo artists and 136.13 million for bands, respectively.
Classification of Artists:
The data includes a mix of solo artists and bands, with examples like Michael Jackson and The Beatles.
A new column 'Artist Type' has been created to classify artists into 'Solo' or 'Band'.
Conversion of Claimed Sales:
The 'Claimed sales' column has been converted from string to numeric values for analysis, with sales ranging from 75 million to 600 million.
Notable Differences:
Bands have a slightly higher average claimed sales than solo artists.
The difference in average claimed sales between solo artists and bands is 5.46 million.
Conclusion: Based on the provided data, bands tend to have a marginally higher average claimed sales compared to solo artists. However, the difference is not substantial, suggesting that both solo artists and bands have the potential to achieve high claimed sales figures.
5.What trends can be observed in the release years of the first charted records?
Analysis of Release Year Trends
Data Overview:
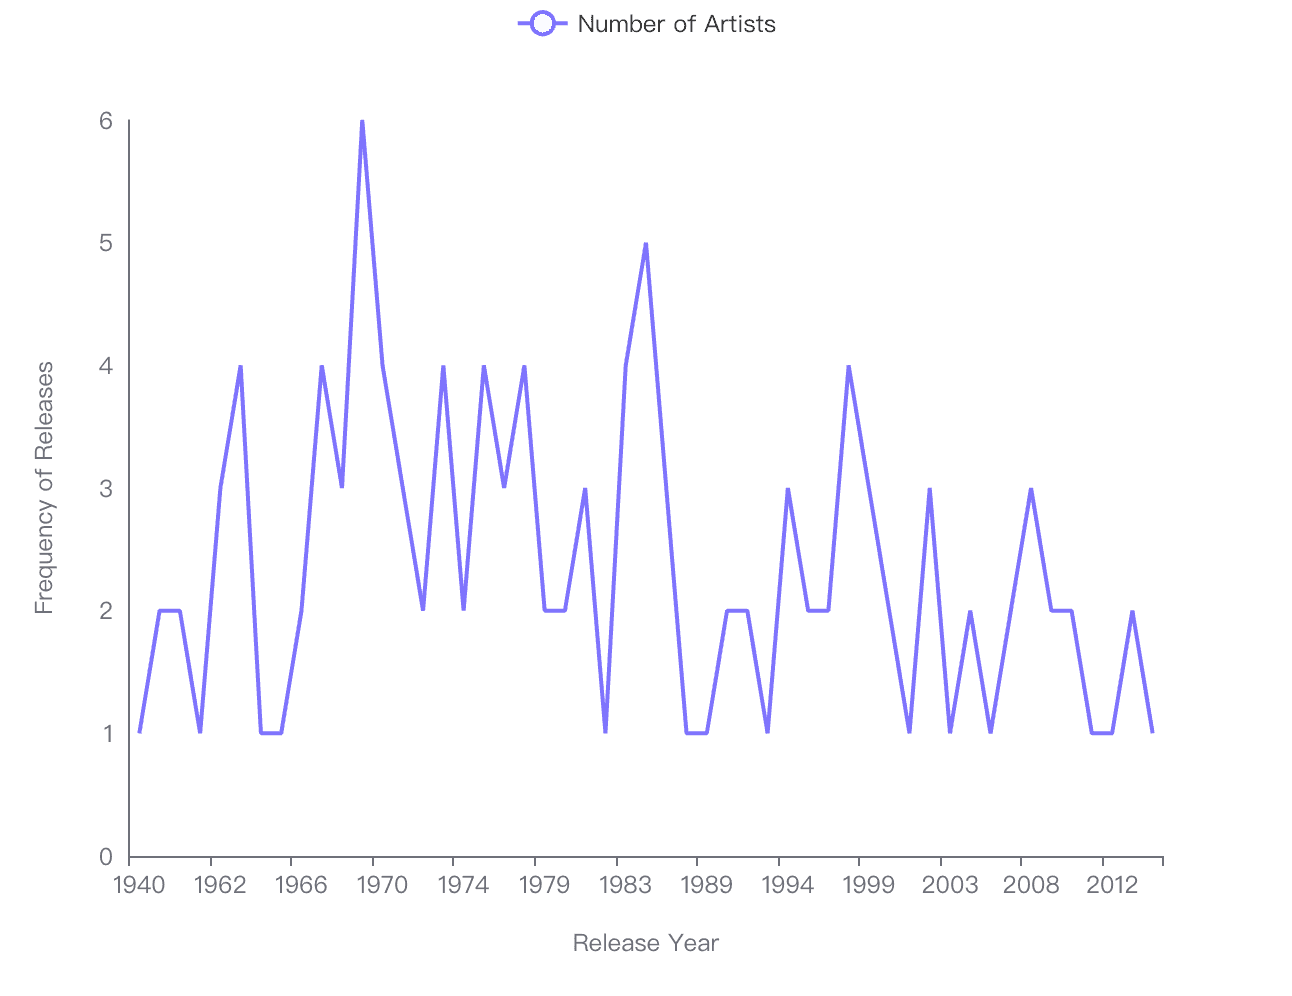
The dataset contains information on the release years of first charted records spanning from 1940 to 2015.
The 'Release Year' column has a mean year of 1985.14, with a standard deviation of 18.09 years.
The 'Number of Artists' column indicates how many artists had their first charted record in each year, with a mean of 2.37 artists per year and a standard deviation of 1.22 artists.
Trend Observations:
The earliest recorded year in the dataset is 1940, and the latest is 2015.
The frequency of first charted records varies significantly over the years, with a minimum of 1 artist and a maximum of 6 artists in any given year.
The provided line chart visualizes the frequency of releases over the years, showing peaks and troughs that indicate varying levels of musical debuts.
Key Points from the Line Chart:
There are several notable peaks in the chart, suggesting years where there was a higher number of artists releasing their first charted records.
The chart shows an irregular pattern, with no clear upward or downward trend over the years.
The variability in the number of artists each year is evident, with some years experiencing a surge in new artists charting.
Conclusion: The data and the accompanying line chart suggest that the release years of first charted records do not follow a consistent trend. Instead, there are fluctuations in the number of artists achieving chart success for the first time in any given year. The peaks in the chart may correspond to particular cultural or industry shifts that facilitated or coincided with more new artists charting. However, without additional context or data, it is difficult to pinpoint the reasons for these fluctuations.
6.Is there a relationship between the length of an artist's career and their claimed sales?
Correlation Analysis:
The relationship between the length of an artist's career and their claimed sales can be assessed through correlation analysis. However, the provided context does not include the actual correlation coefficient value which is essential to determine the strength and direction of the relationship.
Data Summary:
The dataset consists of 121 rows with information on artist names, career lengths, and claimed sales in millions.
Career Length has a mean of 37.69 years and a standard deviation of 17.07 years, with a range from 0 to 65 years.
Claimed Sales have a mean of 132.07 million with a standard deviation of 83.53 million, ranging from 75 to 600 million.
Insights from Data Points:
The top 5 artists listed show a wide range of career lengths, from 10 years (The Beatles) to 62 years (Elton John).
Claimed sales for these artists also vary significantly, with The Beatles at the top with 600 million despite a shorter career span of 10 years.
7.Are there specific regions that dominate certain genres?
Dominance in Music Genres by Region:
The United States shows a clear dominance in genres such as Hip-hop, Rock, and Hard rock / heavy metal, with the highest counts of 4 in both Hip-hop and Rock, and a count of 3 in Hard rock / heavy metal.
Rock genre also has a significant presence in the United Kingdom, with a count of 3, indicating a strong association between the Rock genre and these two countries.
Data Analysis Observations:
The average count for genre dominance across regions is relatively low at 1.20, suggesting that while there are instances of dominance, they are not overwhelmingly common.
The standard deviation is 0.62, which indicates that there is some variability in the dominance of music genres across different countries, but it is not highly dispersed.
The minimum and maximum counts recorded are 1 and 4 respectively, showing that no single country-genre combination has an extremely high count of dominance.
Key Information:
Top Genre-Country Dominance: United States with Hip-hop and Rock (Count of 4).
Significant Presence: United Kingdom with Rock (Count of 3).
Variability in Dominance: Standard deviation of 0.62 in count across different genres and countries.
8.How do newer artists (e.g., those who started after 2000) compare in sales to more established artists?
Comparison of Claimed Sales Between Newer and Established Artists
Average Sales:
The average claimed sales for newer artists (those who started after 2000) is 132,066,115.70.
The standard deviation in their sales figures is 83,359,316.78, indicating a wide variance in sales among newer artists.
The minimum and maximum claimed sales for newer artists are 75,000,000 and 600,000,000 respectively.
Top Performers:
Among the established artists (those who started before 2000), the top performers like The Beatles and Michael Jackson have claimed sales reaching up to 600 million and 500 million respectively.
Data Insights:
The provided data shows a significant presence of high claimed sales figures among established artists, which could be attributed to their longer career span and the accumulation of sales over time.
Newer artists, despite the shorter time frame, show promising sales figures, with the average sales surpassing 100 million.
Key Observations:
Established artists have set high benchmarks in claimed sales, with multiple artists reaching the 300 million mark.
Newer artists, while having less time to accumulate sales, still show strong performance in the market.
The wide standard deviation for newer artists suggests that there are both extremely high and more modest sellers in the group.
This data fact story is totally powered by Powerdrill AI. The entire data analysis process is simple and amazing, try it now!