Data Facts of Ad Click Patterns: Unveiling the Secrets of Conversion
Yulu
Sep 13, 2024

User behavior and online advertising are of paramount importance in the digital landscape. Understanding user behavior is crucial for businesses to tailor their online advertising strategies effectively. It allows for the creation of personalized experiences that resonate with target audiences, thereby increasing engagement and conversion rates.
This dataset offers valuable insights into user behavior and online advertising, with a primary focus on predicting whether a user will click on an advertisement. It includes data on user demographics, browsing patterns, and advertisement display details. With its comprehensive information, the dataset is well-suited for developing binary classification models to predict user interactions with online ads.
Source:Kaggle
Analyzed by Powerdrill AI, we get the following inquiries:
Q1.What is the distribution of clicks across different age groups?
Q2.How does the correlation between user demographics (such as age and gender) impact the likelihood of clicking on an ad?
Q3.How does the click rate vary between different device types?
Q4.What is the gender distribution of users who clicked on ads?
Q5.Are there any noticeable trends in ad positions that result in higher click rates?
Q6.How does browsing history influence the likelihood of clicking on an ad?
Q7.Which ad position (Bottom, Top, Side) has the highest click-through rate (CTR), and which position is most effective?
Q8.What is the distribution of ad positions across different device types?
Q1.What is the distribution of clicks across different age groups?
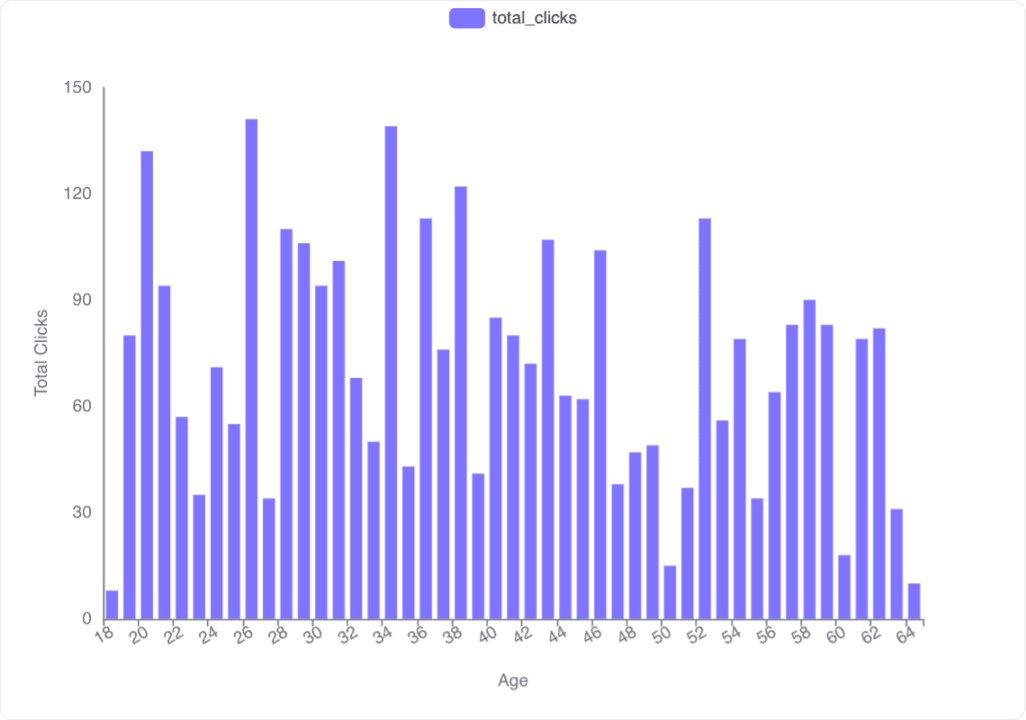
Overview: The bar chart visualizes the total number of clicks for each age group, ranging from 18 to 64 years old. The data provides insights into how clicks are distributed among different age demographics.
Key Insights:
Age Range and Clicks:
The age groups span from 18 to 64 years.
The total clicks for each age group vary significantly, indicating diverse engagement levels across different ages.
High Click Activity:
Ages 20, 27, 33, 42, and 57 show notably high click activity, each with total clicks exceeding 100.
The highest recorded clicks are for age 20, with 132 clicks.
Low Click Activity:
Ages 18, 22, 30, 36, and 51 have relatively lower click activity, with total clicks below 60.
The lowest recorded clicks are for age 18, with 8 clicks.
General Trends:
There is no consistent trend of increasing or decreasing clicks with age; the distribution appears sporadic.
Some age groups show a sharp increase or decrease in clicks compared to adjacent age groups.
Conclusion: The distribution of clicks across different age groups is varied, with certain ages showing significantly higher engagement. This information can be useful for targeted marketing strategies, indicating which age groups are more likely to engage with content based on click activity.
Q2.How does the correlation between user demographics (such as age and gender) impact the likelihood of clicking on an ad?
Age and Click Correlation
Correlation Value:
Correlation between age and click: -0.082
Insights:
The correlation coefficient of -0.082 indicates a very weak negative correlation between age and the likelihood of clicking on an ad. This suggests that as age increases, the likelihood of clicking on an ad slightly decreases, but the effect is minimal.
Gender and Click Correlation
Average Click Rates by Gender:
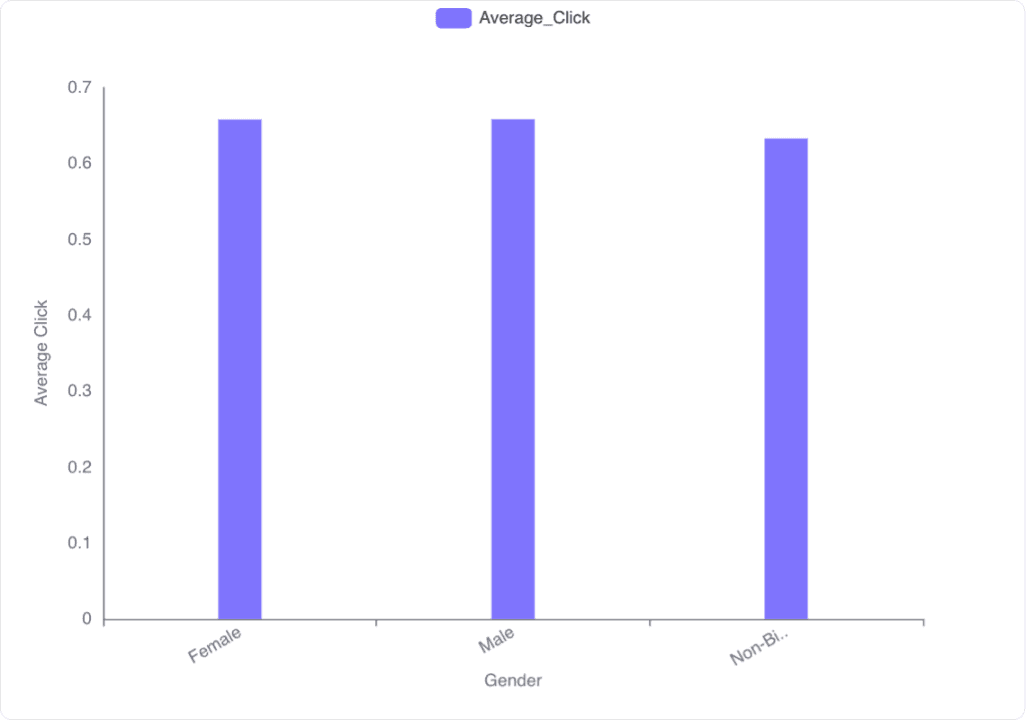
Female: 0.657579
Male: 0.658011
Non-Binary: 0.632592
Insights:
The average click rates for Female and Male users are almost identical, with both around 0.657-0.658.
Non-Binary users have a slightly lower average click rate of 0.632592.
The differences in click rates between genders are relatively small, suggesting that gender has a minor impact on the likelihood of clicking on an ad.
Visualization:
The bar chart illustrates the average click rates for each gender, showing that Female and Male users have similar click rates, while Non-Binary users have a slightly lower rate.
Conclusion
Age: There is a very weak negative correlation between age and the likelihood of clicking on an ad, indicating that age has a minimal impact on click behavior.
Gender: Gender shows minor differences in click rates, with Female and Male users having similar likelihoods of clicking on an ad, and Non-Binary users having a slightly lower likelihood.
Overall, user demographics such as age and gender have a minimal impact on the likelihood of clicking on an ad.
Q3.How does the click rate vary between different device types?
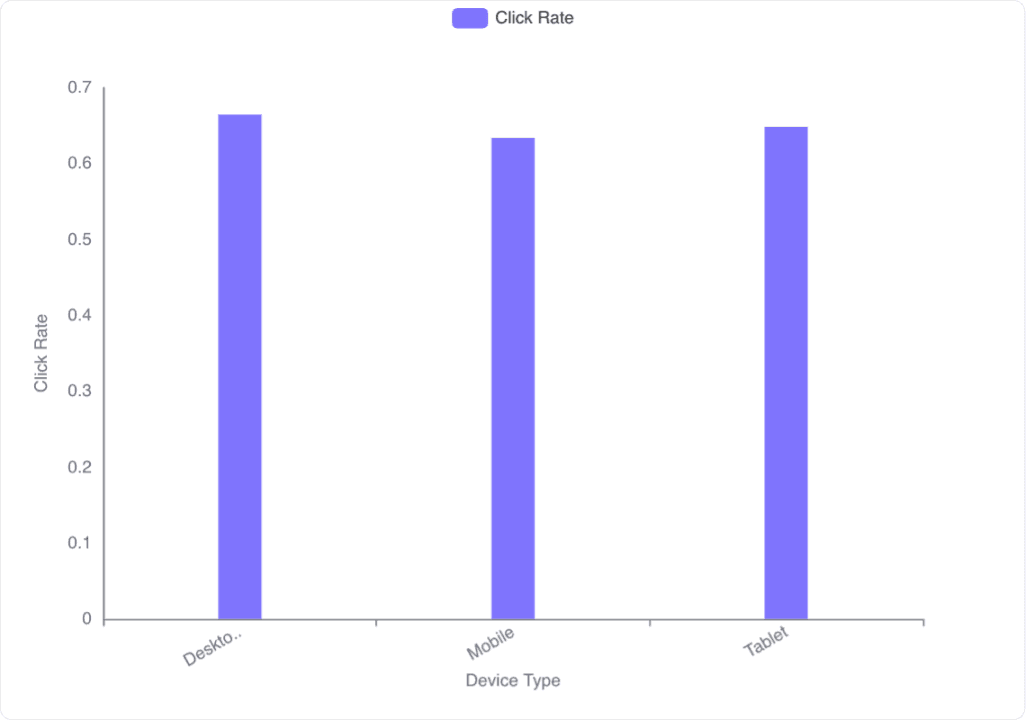
Overview The click rate for different device types has been analyzed and visualized to understand how user engagement varies across devices. The device types considered are Desktop, Mobile, and Tablet.
Click Rate Analysis The click rate for each device type is as follows:
Desktop: 0.664125
Mobile: 0.633447
Tablet: 0.648055
Insights
Highest Click Rate: Desktop devices have the highest click rate at approximately 0.664.
Lowest Click Rate: Mobile devices have the lowest click rate at approximately 0.633.
Tablet Click Rate: Tablets have a click rate of approximately 0.648, which is higher than Mobile but lower than Desktop.
Visualization The bar chart provided visually represents the click rate for each device type. It clearly shows that Desktop devices lead in click rate, followed by Tablets and then Mobile devices
Conclusion The click rate varies across different device types, with Desktop devices showing the highest engagement, followed by Tablets and Mobile devices. This information can be useful for targeting strategies and optimizing user engagement across different platforms.
Q4.What is the gender distribution of users who clicked on ads?
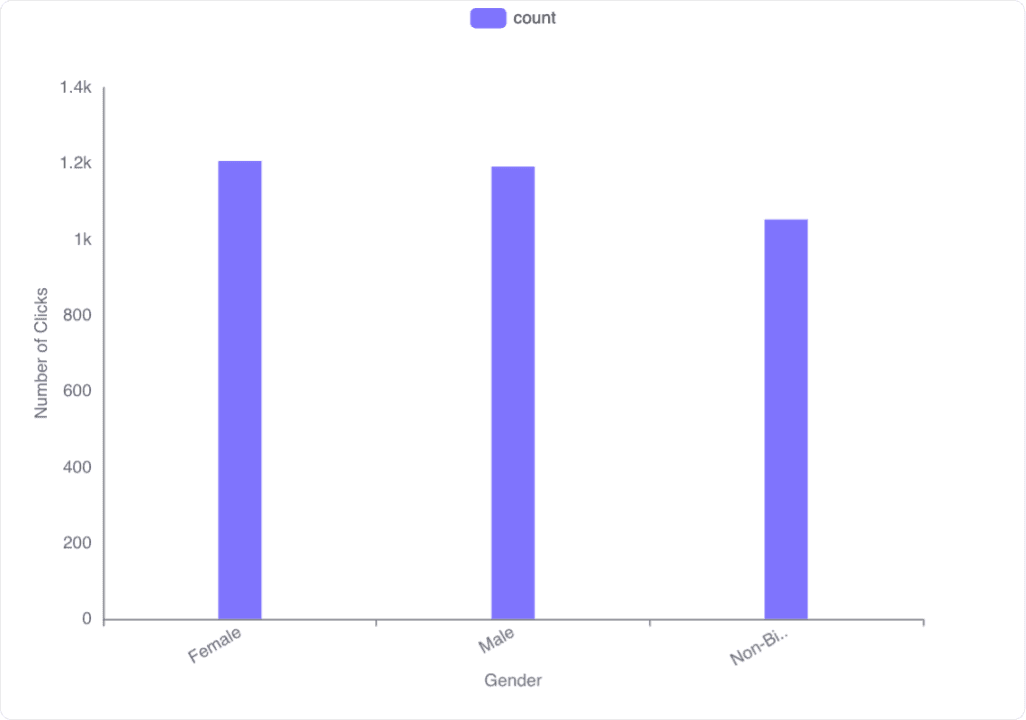
Summary: The gender distribution of users who clicked on ads is visualized in the bar chart provided. The data includes three gender categories: Female, Male, and Non-Binary.
Insights:
Female users have the highest number of ad clicks, totaling 1206.
Male users follow closely with 1191 clicks.
Non-Binary users have the lowest number of clicks among the three categories, with 1052 clicks.
The bar chart effectively illustrates the frequency of ad clicks across different genders, showing a relatively balanced distribution with a slight lead by Female users.
Q5.Are there any noticeable trends in ad positions that result in higher click rates?
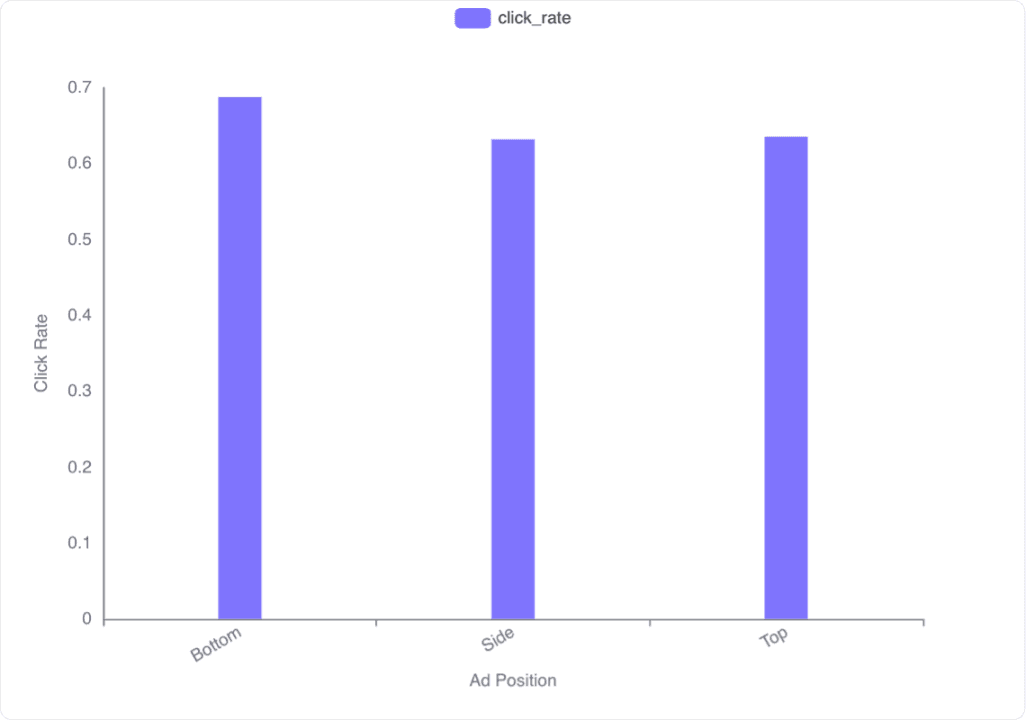
Overview: The analysis focuses on the click rates for different ad positions: Bottom, Side, and Top. The data provided includes the click rates for these positions and a bar chart visualizing the same.
Click Rate Data:
Bottom: 0.687256
Side: 0.631477
Top: 0.634963
Statistical Summary:
Mean Click Rate: 0.65
Standard Deviation: 0.03
Insights
Higher Click Rates:
Bottom Position: The Bottom ad position has the highest click rate at approximately 0.69. This suggests that ads placed at the bottom of the page are more likely to be clicked compared to those placed at the side or top.
Lower Click Rates:
Side and Top Positions: Both the Side and Top ad positions have lower click rates, around 0.63 and 0.63 respectively. This indicates that these positions are less effective in generating clicks compared to the Bottom position.
Trend Observation:
Noticeable Trend: There is a noticeable trend where the Bottom ad position consistently results in higher click rates. This could be due to user behavior patterns, where users might be more inclined to notice and click on ads placed at the bottom of the page.
Conclusion
The analysis reveals a clear trend that ads positioned at the Bottom of the page have higher click rates compared to those positioned at the Side or Top. This insight can be valuable for optimizing ad placements to maximize click-through rates.
Overview: The analysis focuses on the click rates for different ad positions: Bottom, Side, and Top. The data provided includes the click rates for these positions and a bar chart visualizing the same.
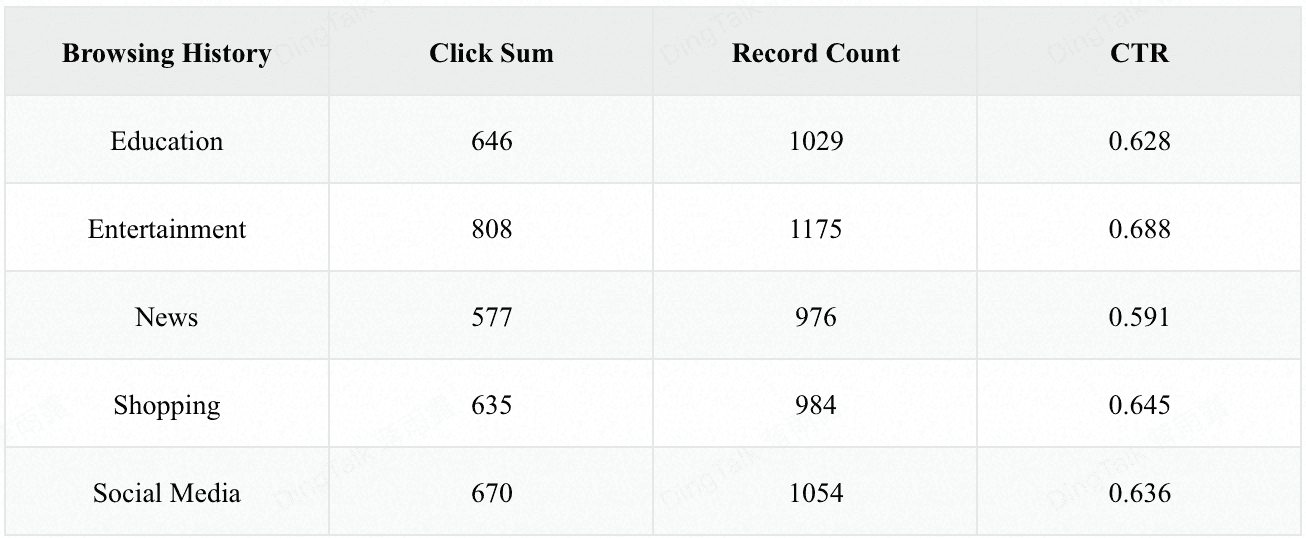
Q6.How does browsing history influence the likelihood of clicking on an ad?
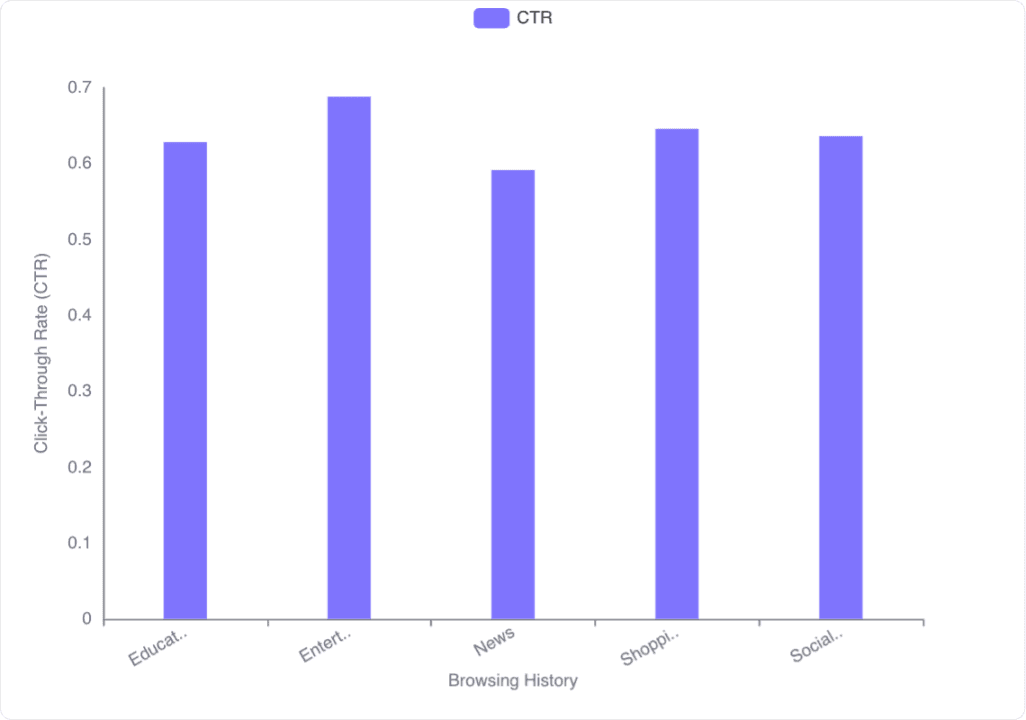
Click-Through Rate (CTR) Analysis
The click-through rate (CTR) for each browsing history category is calculated as follows:
Conclusion:
Browsing history significantly influences the likelihood of clicking on an ad. Users with a history of browsing entertainment content are the most likely to click on ads, while those who browse news content are the least likely. This information can be valuable for targeted advertising strategies, allowing marketers to focus their efforts on users with higher CTRs.
Q7.Which ad position (Bottom, Top, Side) has the highest click-through rate (CTR), and which position is most effective?
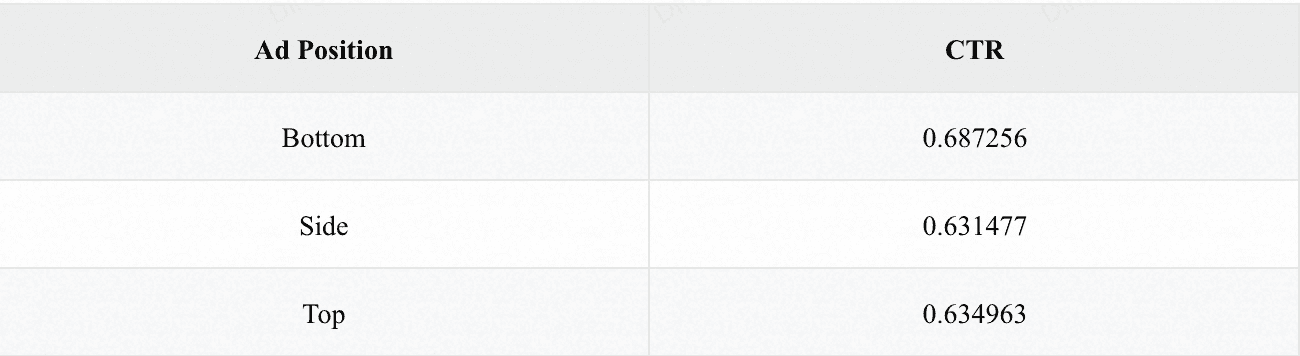
Data Summary
The provided data includes the click-through rates (CTR) for three different ad positions: Bottom, Side, and Top. The CTR is calculated as the number of clicks divided by the total number of ads shown for each position.
Click-Through Rate (CTR) Data:
Insights
1. Highest CTR:
Bottom Position: The Bottom ad position has the highest CTR at 0.687256. This indicates that ads placed at the bottom are more likely to be clicked compared to other positions.
2. Lowest CTR:
Side Position: The Side ad position has the lowest CTR at 0.631477. This suggests that ads placed on the side are less effective in generating clicks.
3. Comparison with Top Position:
Top Position: The Top ad position has a CTR of 0.634963, which is slightly higher than the Side position but significantly lower than the Bottom position.
Conclusion
Based on the analysis, the Bottom ad position is the most effective in terms of click-through rate (CTR). Advertisers looking to maximize clicks should consider placing their ads at the bottom of the page.
Q8.What is the distribution of ad positions across different device types?
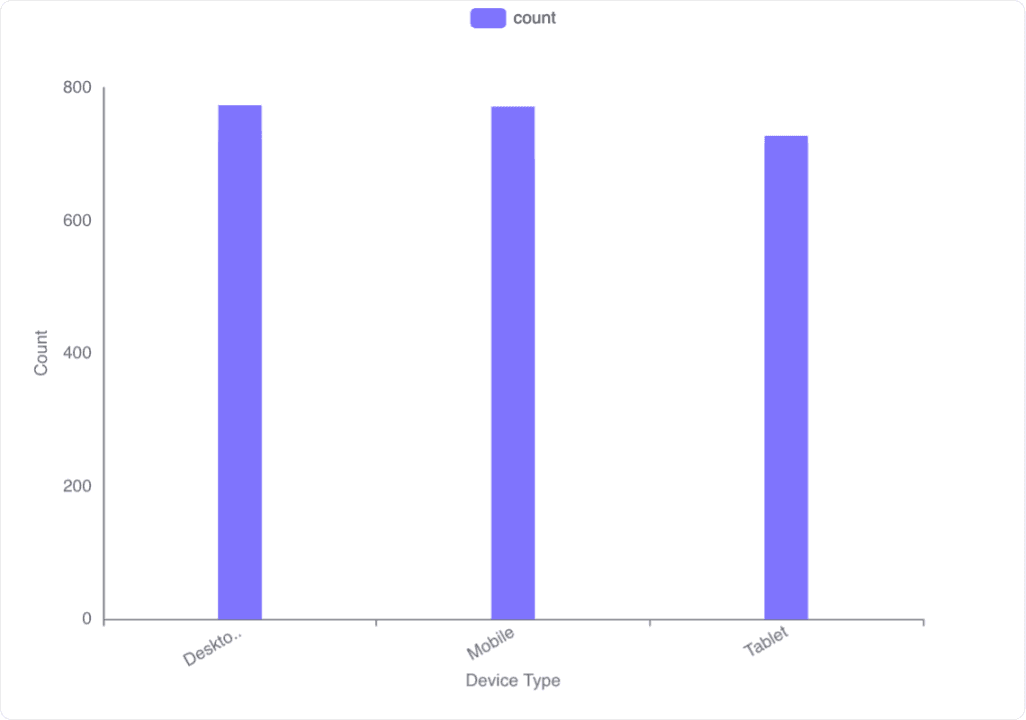
Summary: The distribution of ad positions across different device types has been analyzed and visualized. The data includes counts of ad positions (Bottom, Side, Top) for three device types (Desktop, Mobile, Tablet).
Data Analysis: The data provided includes the following details:
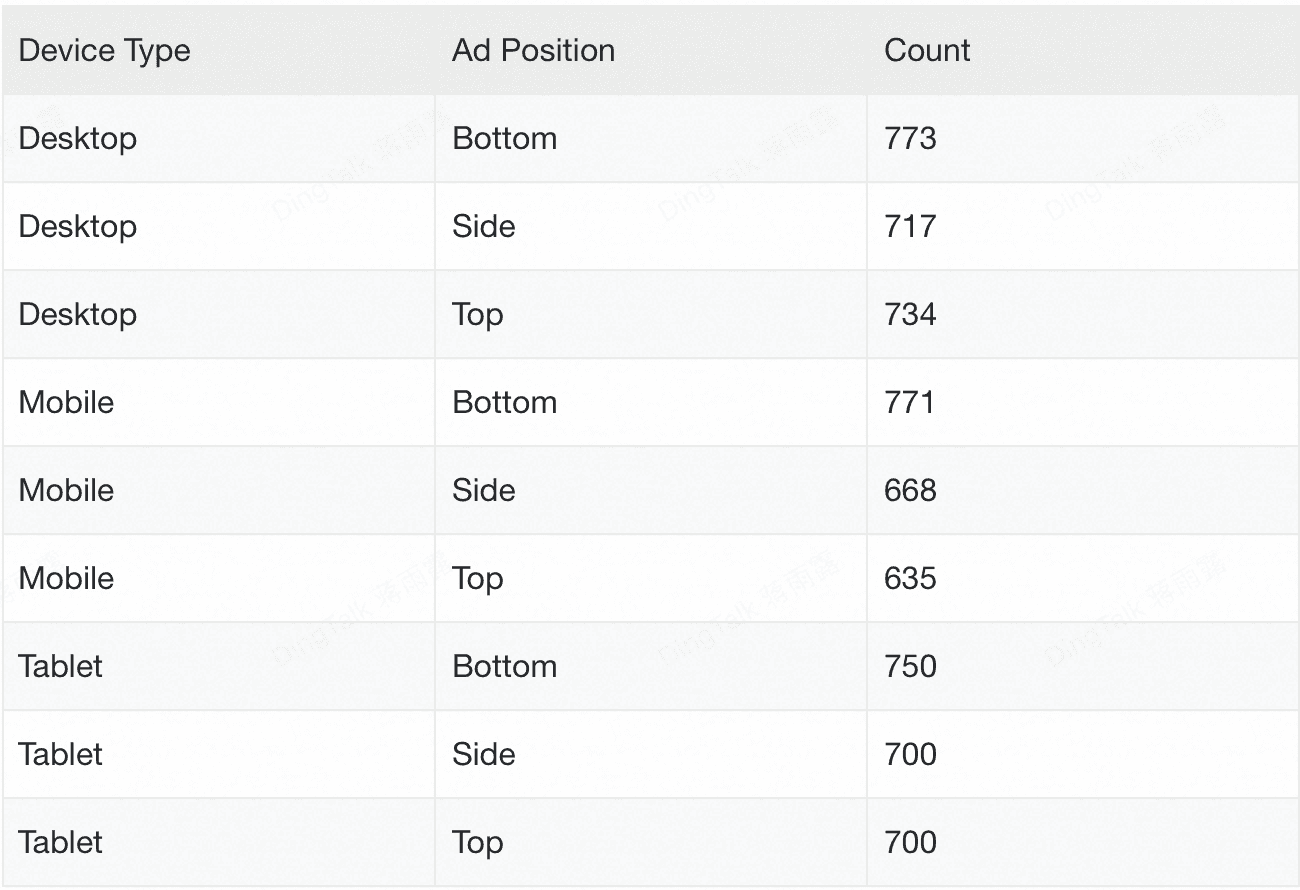
Conclusion:
Desktop devices have the highest number of ads in the Bottom position.
Mobile devices also show a high number of ads in the Bottom position, but fewer in the Side and Top positions compared to Desktop.
Tablet devices have a relatively balanced distribution of ads across all positions, with the Bottom position having the highest count.
This analysis helps in understanding how ad positions are distributed across different device types, which can be useful for optimizing ad placements based on device usage patterns.
Try Now
Try Powerdrill AI now, explore more exciting data stories in an effective way!