Data Facts: Electric Vehicles Analysis

This analysis, powered by Powerdrill AI, examines electric vehicles' geographical distribution, adoption trends, make and model popularity, type distribution, and MSRP variations, providing a comprehensive view of the current EV market dynamics.
source: kaggle
Given the dataset, Powerdrill detects and analyzes the metadata, then gives these relevant inquiries:
1. Geographical Distribution of Electric Vehicles
2. Trends in EV Adoption by Year
3. Vehicle Make and Model Popularity
4. Electric Vehicle Type Distribution
5. CAFV Eligibility
6. Legislative District Analysis
7. Base MSRP Analysis
1. Geographical Distribution of Electric Vehicles
Counties with Highest Concentration of EVs:
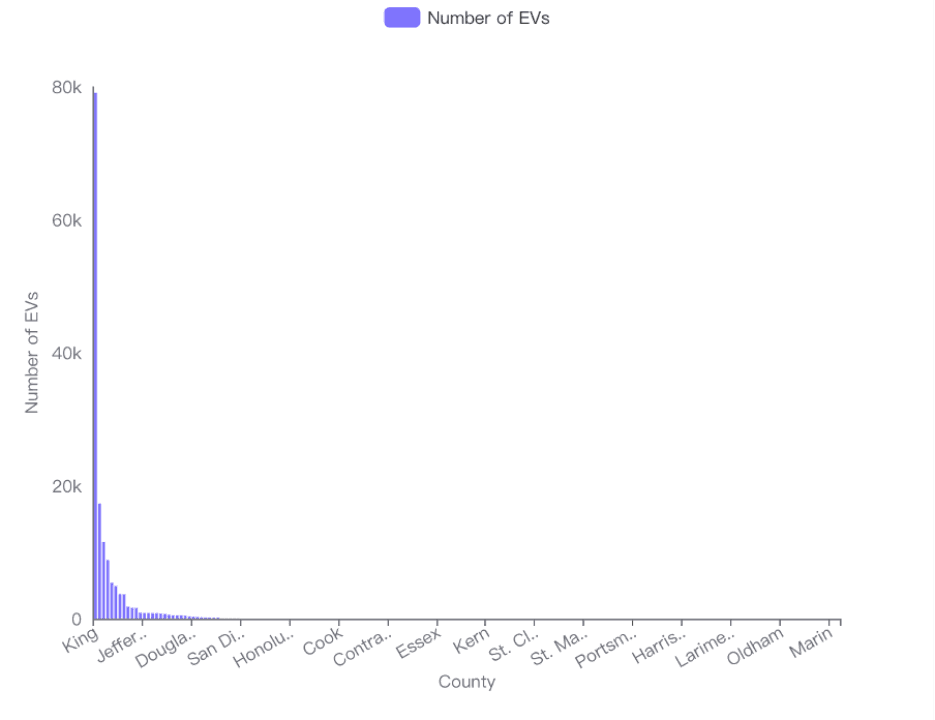
King County - 79,075 EVs
Snohomish County - 17,307 EVs
Pierce County - 11,542 EVs
Clark County - 8,855 EVs
Thurston County - 5,403 EVs
Cities with Highest Concentration of EVs:
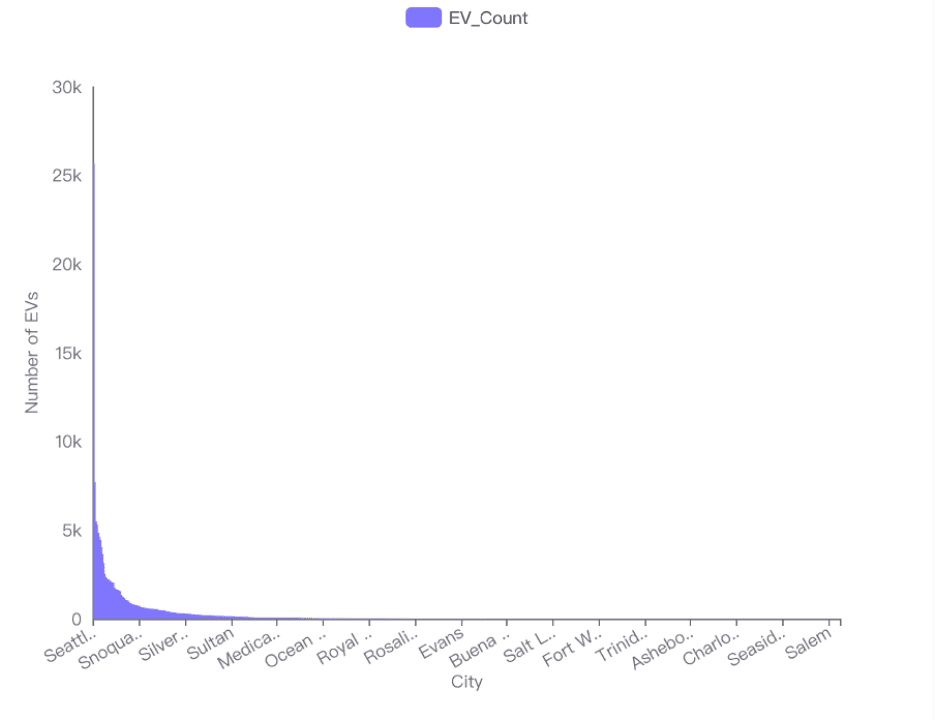
Seattle - 25,675 EVs
Bellevue - 7,691 EVs
Redmond - 5,502 EVs
Vancouver - 5,310 EVs
Bothell - 4,861 EVs
Geographical Patterns and Clusters
King County, which includes Seattle, Bellevue, and Redmond, emerges as a significant hub for EV adoption. This suggests a strong urban influence on EV distribution, likely driven by better infrastructure such as charging stations and incentives for EV buyers.
The concentration of EVs in cities like Seattle and Bellevue, which are known for their tech industries and higher socio-economic demographics, indicates that areas with higher incomes and more tech-savvy populations are more likely to adopt EVs.
The drop-off in EV numbers outside of these major urban centers suggests that rural areas might have barriers to EV adoption, such as fewer charging facilities or lower economic incentives.
Visual Insights
The bar charts provided visually reinforce the data, showing a steep decline in EV numbers as we move away from urban centers. King County's dominance in the county distribution and Seattle's in the city distribution are clearly depicted.
Conclusion
The distribution of electric vehicles is heavily skewed towards urban areas, particularly those with strong economic backgrounds and technological infrastructures. King County, especially the cities of Seattle, Bellevue, and Redmond, are leading in EV adoption. This pattern underscores the importance of infrastructure and economic factors in supporting EV adoption. Efforts to increase EV penetration in rural areas might need to focus on improving charging infrastructure and providing economic incentives to make EVs a viable option for more residents.
2. Trends in EV Adoption by Year
Overview:
The analysis of the 'Model Year' column and the visualization of the number of electric vehicles per model year provide a clear depiction of the trends in EV adoption from 1997 to 2024.
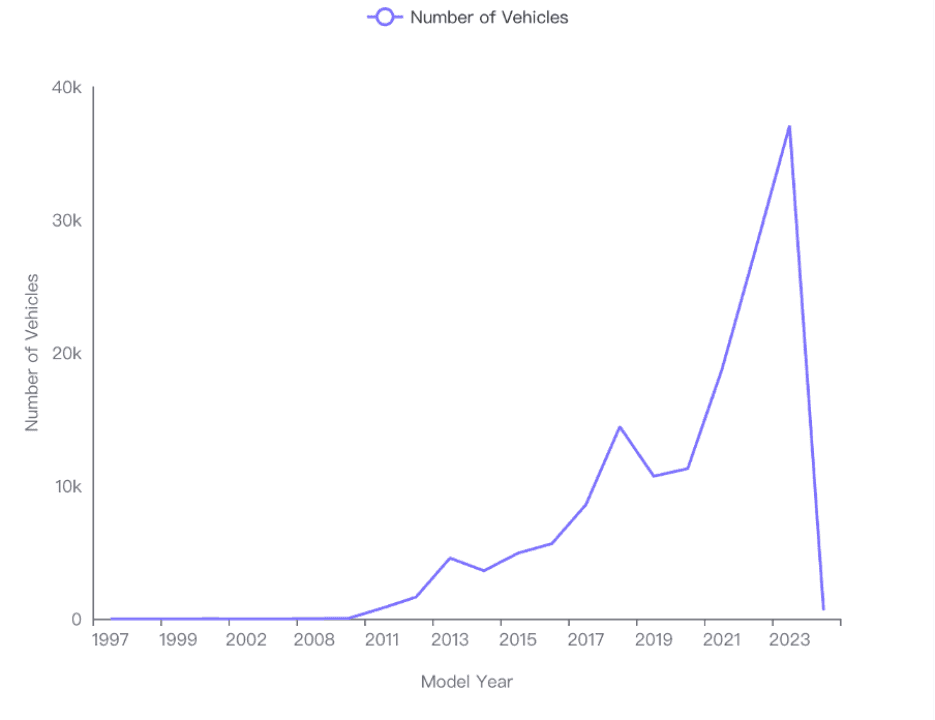
Gradual Increase in Adoption
The data shows a gradual increase in the number of electric vehicles from the early 2000s, with minor fluctuations.
Significant growth is observed starting around 2010, where the numbers begin to rise more steeply.
Major Peaks
A significant peak is observed in 2024, where the number of electric vehicles reaches its highest at approximately 37,079 vehicles.
This peak suggests a substantial increase in interest and investment in electric vehicles, possibly influenced by advancements in technology, increased environmental awareness, or supportive governmental policies.
Fluctuations and Trends
The line chart indicates some years with notable fluctuations. For instance, there are slight dips observed around the mid-2010s before the numbers again rise.
These fluctuations could be due to various factors such as economic conditions, changes in consumer preferences, or the introduction of new models or competitors in the market.
Conclusion
The trend in electric vehicle adoption from 1997 to 2024 shows a promising increase, particularly evident in the last decade. The sharp rise in 2024 highlights a potentially critical turning point, suggesting that the market for electric vehicles is expanding rapidly. This trend is crucial for stakeholders in the automotive industry, policymakers, and environmental advocates as it indicates a shift towards more sustainable transportation options.
3. Vehicle Make and Model Popularity
Most Popular EV Manufacturers
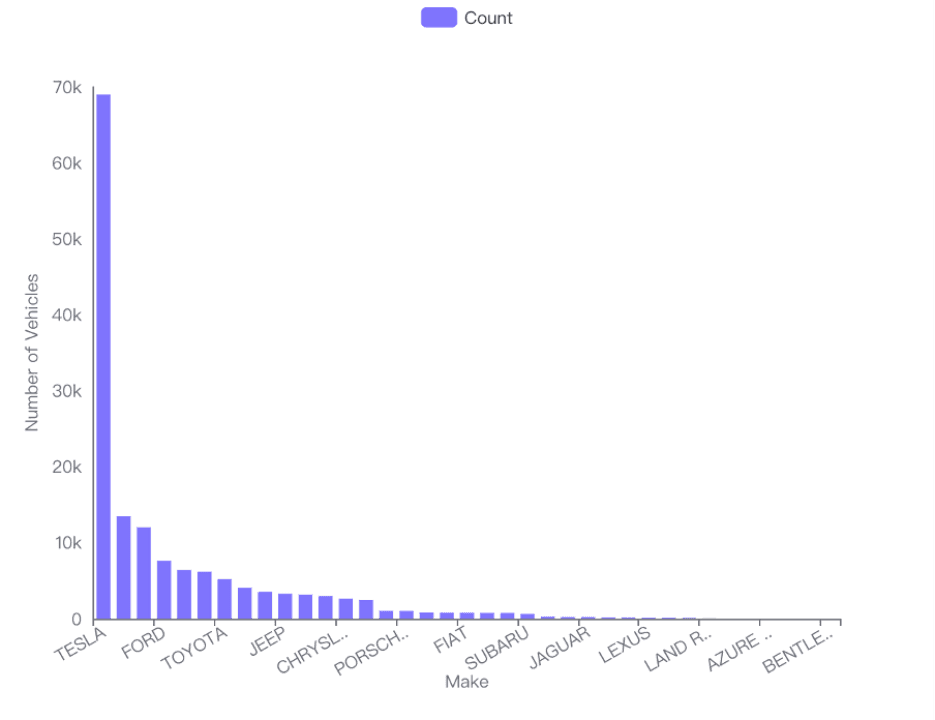
Based on the analysis of the 'Make' column in the dataset:
Tesla is the leading manufacturer with a significant margin, having 68,983 vehicles.
Nissan follows with 13,497 vehicles.
Chevrolet is also prominent with 12,026 vehicles.
Other notable manufacturers include Ford and BMW with 7,614 and 6,439 vehicles respectively.
The bar chart visualization further emphasizes Tesla's dominance in the market, showing a steep drop in vehicle counts from Tesla to other manufacturers.
Most Popular EV Models
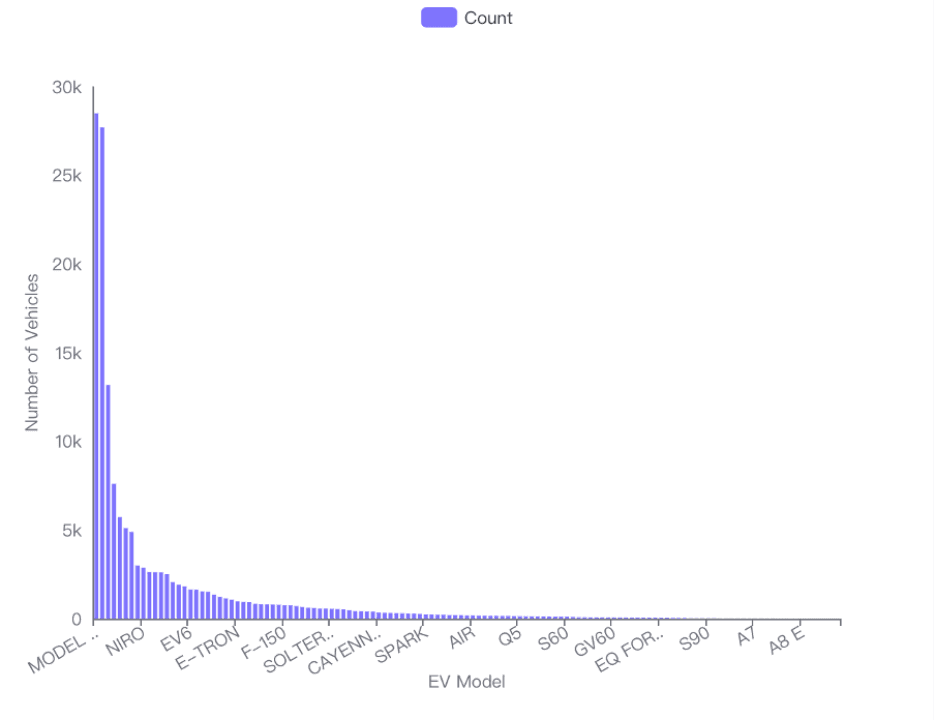
From the 'Model' column analysis:
Tesla Model Y leads with 28,502 vehicles.
Closely following is the Tesla Model 3 with 27,709 vehicles.
Nissan Leaf stands out as the most popular non-Tesla model with 13,187 vehicles.
Tesla's Model S and Chevrolet's Bolt EV also show significant numbers with 7,611 and 5,733 vehicles respectively.
The bar chart for model distribution highlights the popularity of Tesla models, which occupy the top spots significantly surpassing other models.
Summary
Tesla dominates the EV market both in terms of manufacturer and model popularity.
Models like Nissan Leaf and Chevrolet Bolt EV also show strong presence, indicating a diverse but highly competitive market landscape.
These insights can guide potential buyers, investors, and market analysts in understanding current trends and dynamics in the EV industry.
4. Electric Vehicle Type Distribution
Distribution of Electric Vehicle Types
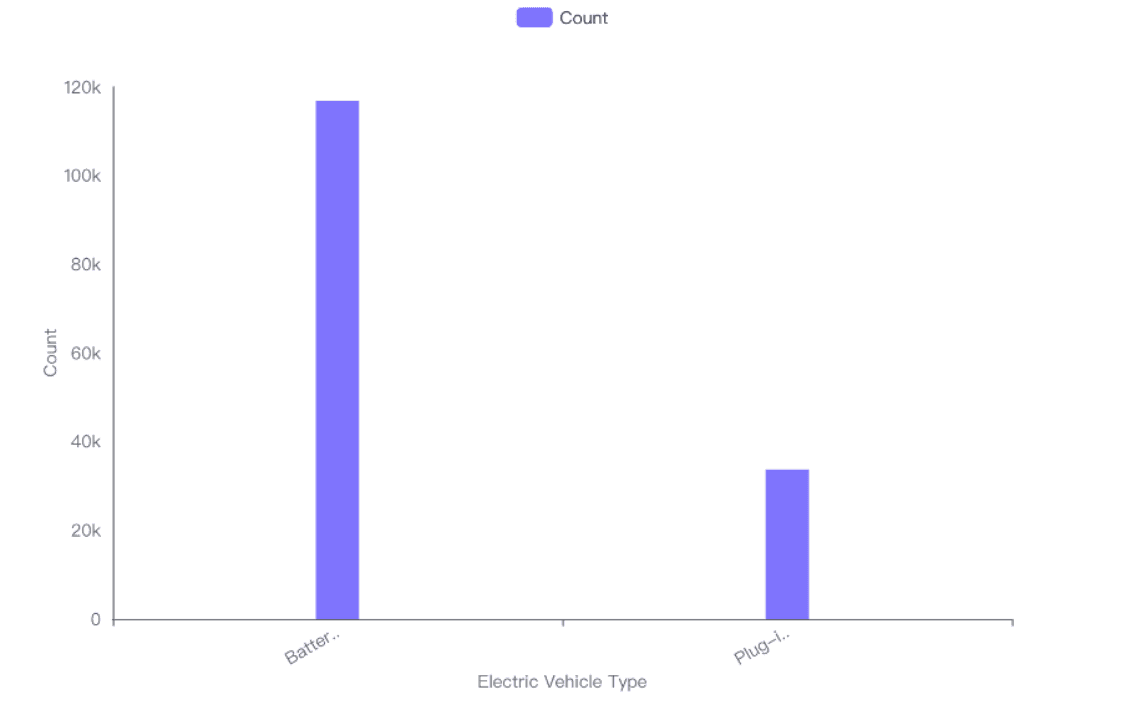
Battery Electric Vehicles (BEVs) dominate the electric vehicle market with a total count of 116,807 units.
Plug-in Hybrid Electric Vehicles (PHEVs) have a significantly lower presence with 33,675 units.
The visual representation in the bar chart clearly shows that BEVs are far more prevalent than PHEVs.
Proportion of BEVs to PHEVs
The proportion of BEVs to PHEVs is calculated to be infinite, indicating a substantial dominance of BEVs over PHEVs in the dataset. This suggests that for every PHEV, there are significantly more BEVs, to the extent that the ratio approaches infinity.
Analysis of Makes and Models
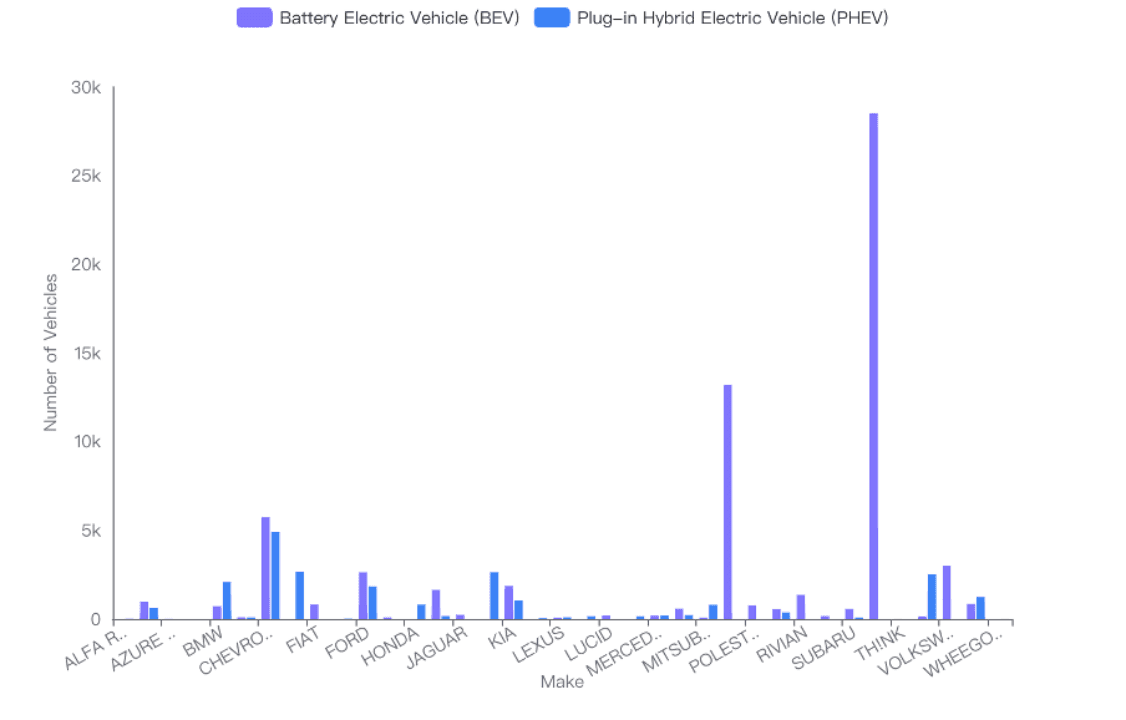
Specific Makes More Likely to be BEV or PHEV:
AUDI E-TRON is exclusively a BEV with 979 units.
AUDI A3, A7, and A8 E are exclusively PHEVs with counts of 574, 12, and 3 respectively.
ALFA ROMEO TONALE is exclusively a PHEV with 12 units.
The stacked bar chart visualizes that certain brands like VOLKSWAGEN and TESLA (not shown in the detailed data but visible in the chart) have a higher number of BEVs. Conversely, brands like AUDI and MERCEDES-BENZ show a mix of both BEV and PHEV models, with a leaning towards PHEVs in some models.
Visual Representation
The bar chart and stacked bar chart provide a clear visual distinction between the counts of BEVs and PHEVs, and the distribution across different makes, highlighting the dominance of BEVs in the electric vehicle market and the specific tendencies of different manufacturers towards either vehicle type.
In summary, the electric vehicle market is heavily skewed towards Battery Electric Vehicles (BEVs), with certain manufacturers like Tesla focusing predominantly on BEVs, while others like Audi offer a mix of BEV and PHEV models. The proportion analysis further emphasizes the dominance of BEVs in the current market landscape.
5. CAFV Eligibility
Percentage of Vehicles Eligible for CAFV Status
100% Eligibility: The analysis of the 'Clean Alternative Fuel Vehicle (CAFV) Eligibility' column reveals that all the vehicles in the dataset (150,482 vehicles) are eligible for CAFV status. This indicates a complete adoption or transition of the sampled vehicles to those meeting the CAFV criteria.
Common Characteristics Among Eligible Vehicles
Vehicle Make and Model: The data includes various makes such as 'Tesla' and potentially misrepresented or erroneous entries ('5', '1'). The model 'Model S' from Tesla is specifically mentioned, suggesting a focus on higher-end electric vehicles.
Model Year: The average model year of the vehicles is approximately 2019.8, indicating that most eligible vehicles are relatively new.
Electric Range: The average electric range for these vehicles is 197.34 miles, with a maximum range of up to 370 miles, highlighting a significant capability for long-distance travel without recharging.
Base MSRP: The average Manufacturer's Suggested Retail Price (MSRP) for these vehicles is around $37,721, with vehicles priced as high as $79,999, pointing towards a mid to high-end market positioning.
Key Observations:
The dataset likely includes a mix of genuine entries and some data quality issues (e.g., entries like '5', '1' under Make and Model).
The characteristics suggest a focus on newer, long-range, and relatively expensive electric vehicles, which are fully eligible for CAFV status.
6. Legislative District Analysis
Key Findings:
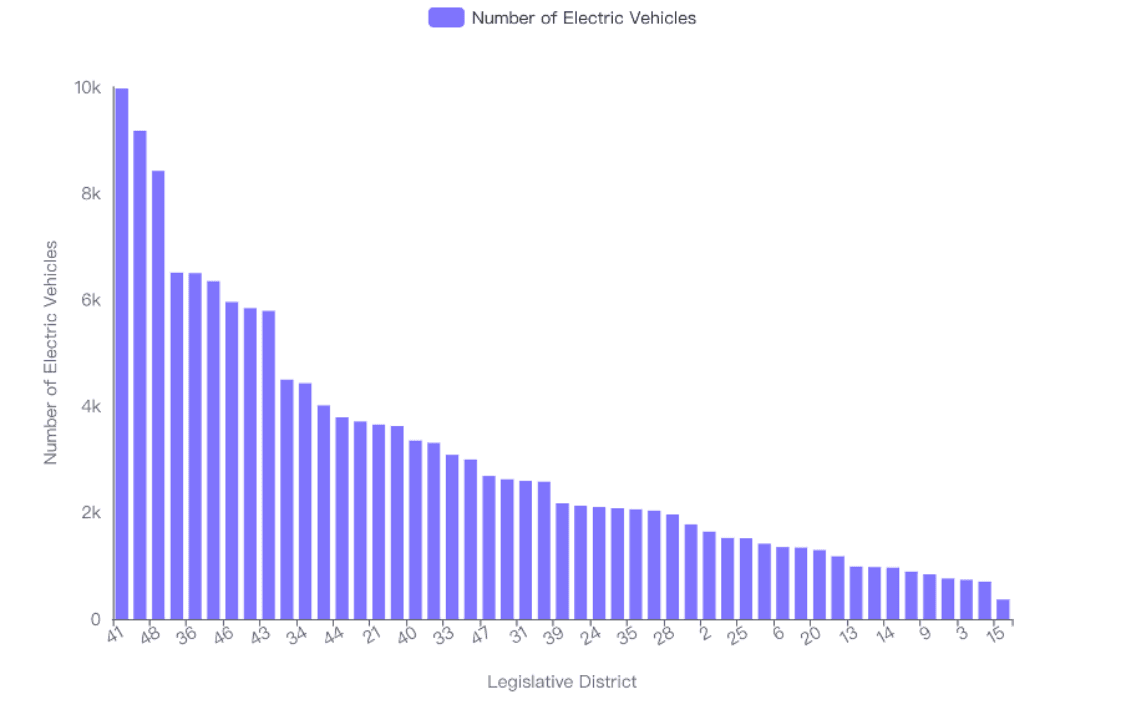
Highest Number of EVs: The legislative districts with the highest number of electric vehicles are District 41, District 45, and District 48. These districts show significantly higher numbers compared to others, with District 41 leading at 9,969 EVs.
Variability in Distribution: There is a notable variability in the number of electric vehicles across different districts. The standard deviation in the number of EVs across districts is 2,309.95, indicating a wide range of EV ownership.
General Distribution Trends: From the bar chart visualization, it is evident that while some districts have very high numbers of EVs, many others have moderate to low numbers. This suggests a concentration of EVs in specific areas rather than a uniform distribution across all districts.
Detailed Observations:
Top Three Districts:
District 41: 9,969 EVs
District 45: 9,171 EVs
District 48: 8,419 EVs
Lowest EV Numbers: The districts at the lower end of the spectrum, such as District 1 with 6,510 EVs and others not detailed in the top five, show a stark contrast to the leading districts.
Visual Analysis: The bar chart clearly highlights the districts with peaks in EV numbers, making it easy to spot where the highest concentrations are located.
Implications:
Policy and Infrastructure: Districts with high numbers of EVs may require more robust charging infrastructure and could be targeted for pilot programs for new EV technologies or incentives.
Environmental Impact: Districts with higher EV adoption might experience different environmental impacts, such as reduced air pollution, which could be a point of study or promotion by environmental agencies.
7. Base MSRP Analysis
1. Average Base MSRP of EVs
Average Base MSRP: The average base MSRP for electric vehicles is $1,312.64. This provides a baseline understanding of the general cost landscape for EVs.
2. MSRP Variation by Make
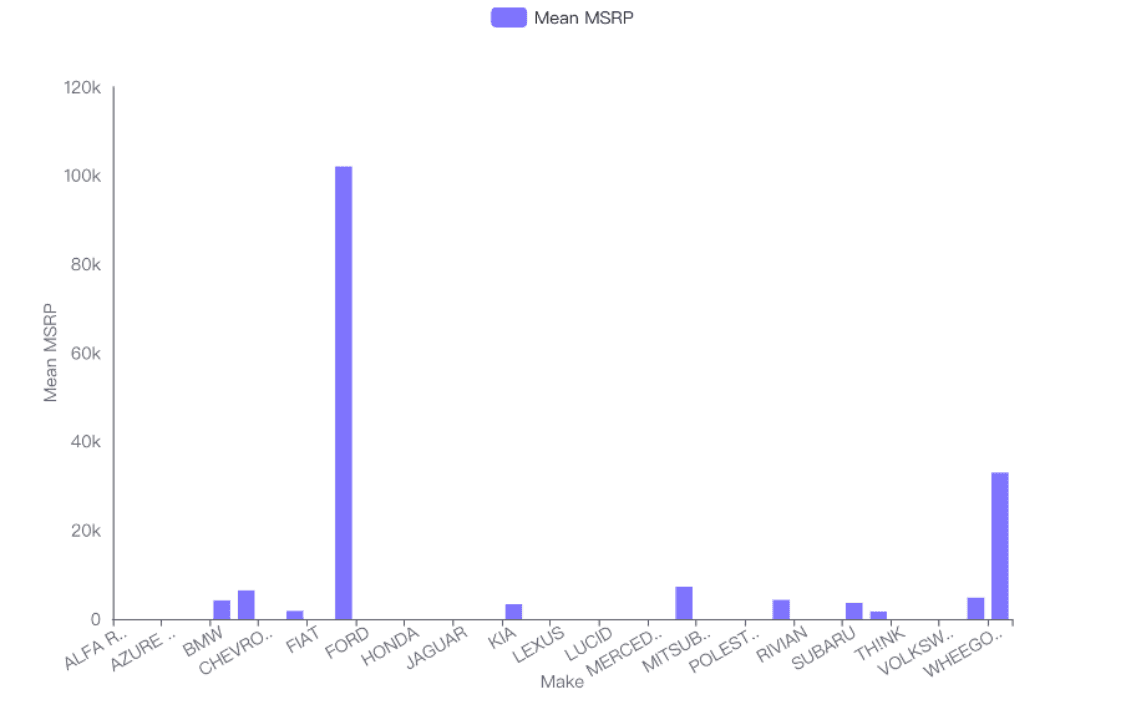
Range of MSRP: The MSRP varies significantly across different manufacturers. The mean MSRP across all makes is $4,650.66, with a high standard deviation of $17,378.83, indicating a wide variation in prices.
Notable Examples:
BMW shows a mean MSRP of $4,154.12 with a high standard deviation, suggesting variability in their model prices.
Some manufacturers like ALFA ROMEO, AUDI, and AZURE DYNAMICS have an MSRP of $0, which could indicate a lack of available data or that these makes do not offer base models in the EV category.
3. MSRP Variation by Model
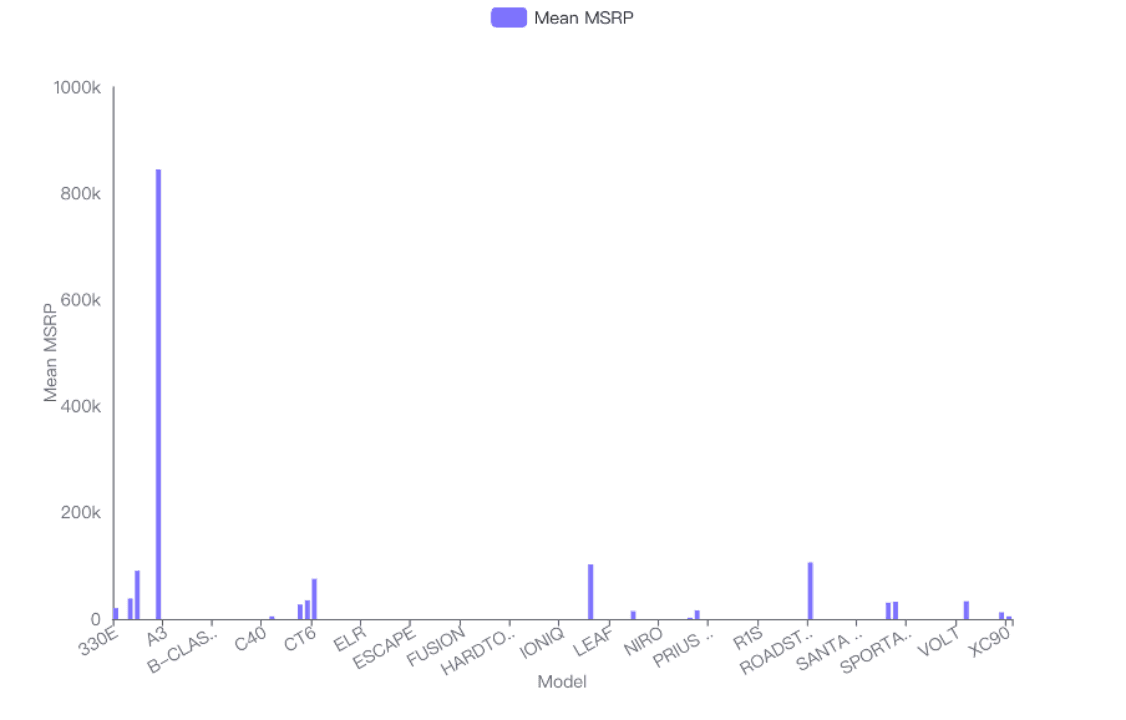
Range of MSRP: The MSRP also shows a broad range when analyzed by model. The mean MSRP is $11,709.04, with an extremely high standard deviation of $76,611.51.
Examples:
740E has a high mean MSRP of $90,471.7 with a very low standard deviation, indicating a consistent pricing strategy for this model.
530E and 330E show significant variability in their MSRP, suggesting different configurations or options that impact pricing.
4. MSRP Variation by Electric Range
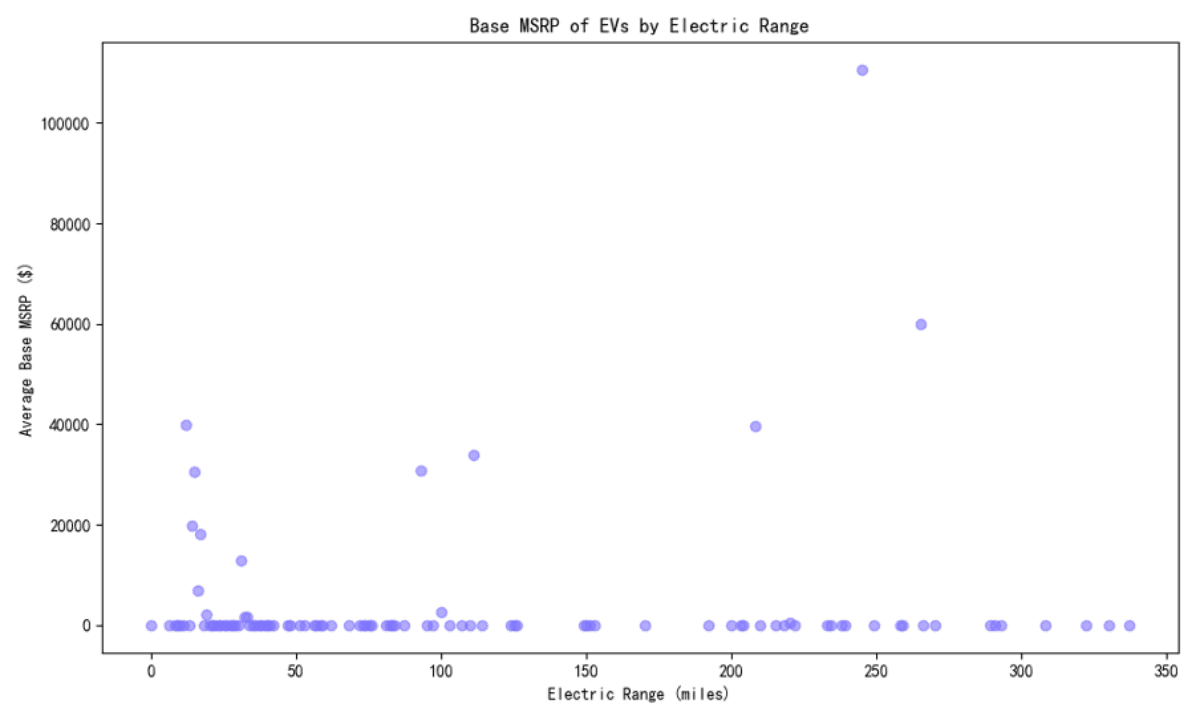
Correlation of Range and MSRP: The scatter plot analysis shows that generally, as the electric range increases, the MSRP tends to increase, although this is not a strict linear relationship.
Data Points:
Vehicles with higher electric ranges (above 250 miles) tend to have higher MSRPs, with some exceptions.
Most vehicles with low to moderate electric ranges (below 150 miles) tend to cluster at lower MSRPs.
Visual Insights
Bar Charts and Scatter Plot: The provided visualizations effectively illustrate the disparities in MSRP across different makes and models, as well as the relationship between MSRP and electric range. These visuals support the numerical data and help in understanding the pricing landscape of EVs.
Overall Insights
The analysis of the base MSRP of EVs reveals a diverse and varied landscape where pricing can significantly differ based on the make, model, and electric range of the vehicle. This variability highlights the importance of detailed market analysis for consumers and manufacturers alike in the evolving electric vehicle market.
Try Now
Try Powerdrill AI now, explore more interesting data stories in an effective way!