Data Facts: Comprehensive World Salary Analysis

This analysis examines world salary distribution across demographics, education, experience, job titles, and countries. Visualizations and advanced statistical techniques provide insights for career planning, hiring strategies, and workforce development.
source: kaggle
Given the dataset, Powerdrill detects and analyzes the metadata, then gives these relevant inquiries:
Demographic Analysis
Age Distribution and Salary Relationship
Gender-Based Salary Comparison and Job Distribution
Racial Salary Disparities and Demographic Distribution
Education and Experience Analysis
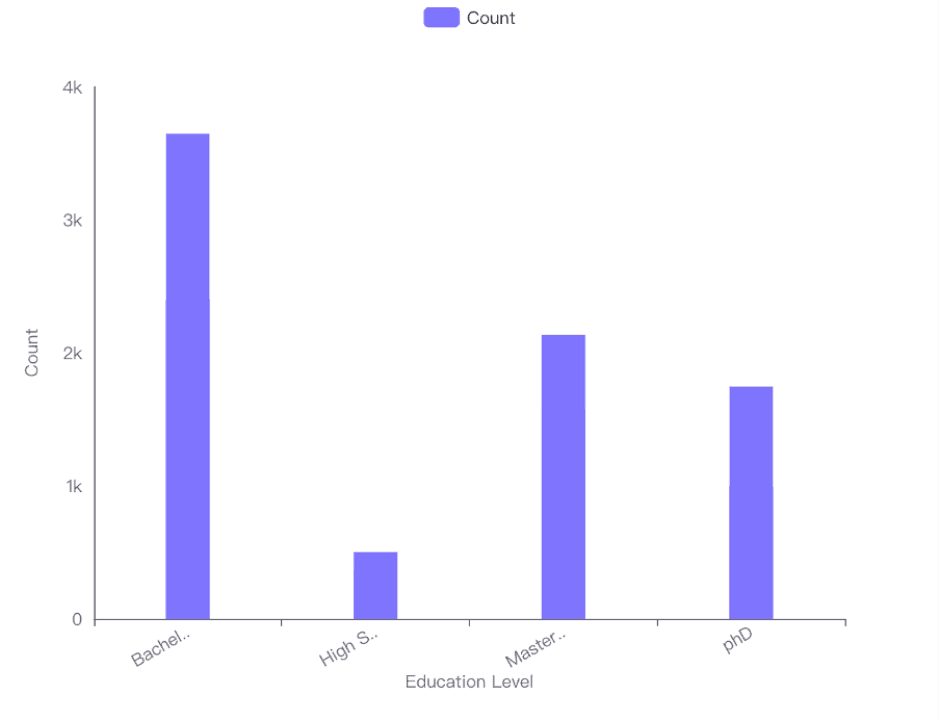
Impact of Education Level on Salary and Job Distribution
Years of Experience vs. Salary Analysis
Distribution of Years of Experience Across Countries
Job Analysis
Salary Distribution Across Job Titles
Average Years of Experience and Average Education Level
Additional Factors
Effect of Senior Roles on Salary and Distribution
Demographic Analysis
Age Distribution Analysis
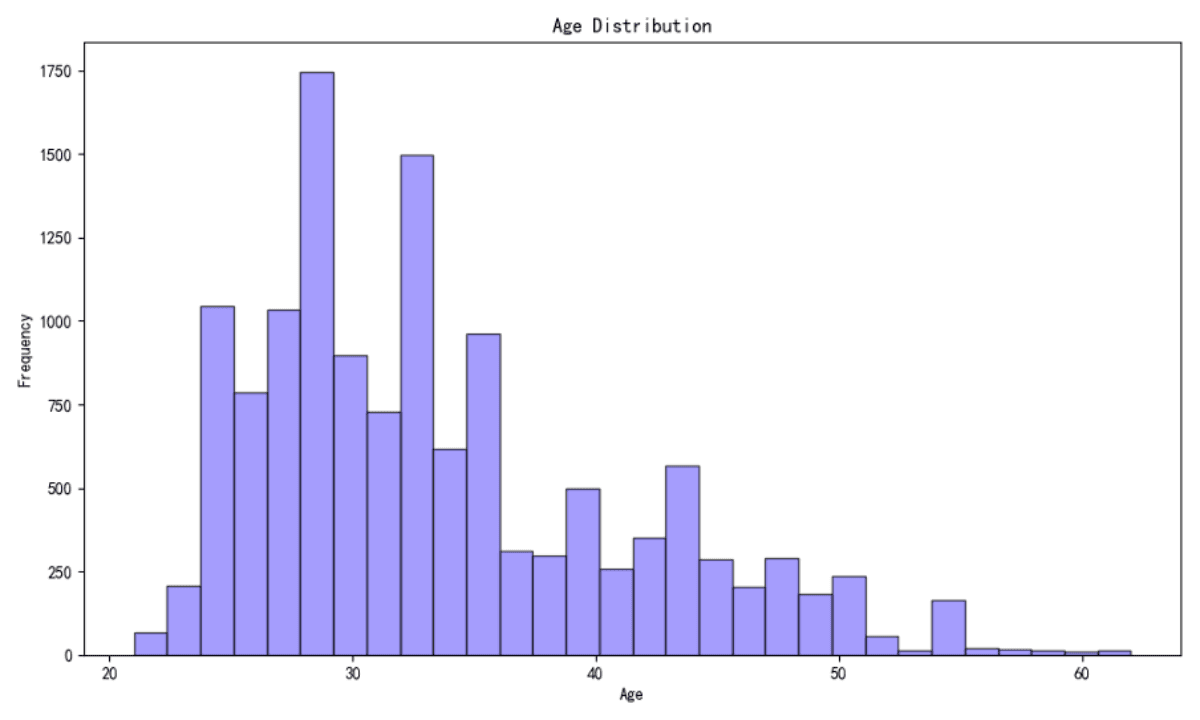
Age Distribution: The dataset shows a mean age of 33.62 years with a standard deviation of 7.61 years. The age range is from 21 to 62 years. The histogram visualization indicates a higher frequency of individuals in their late 20s to early 30s.
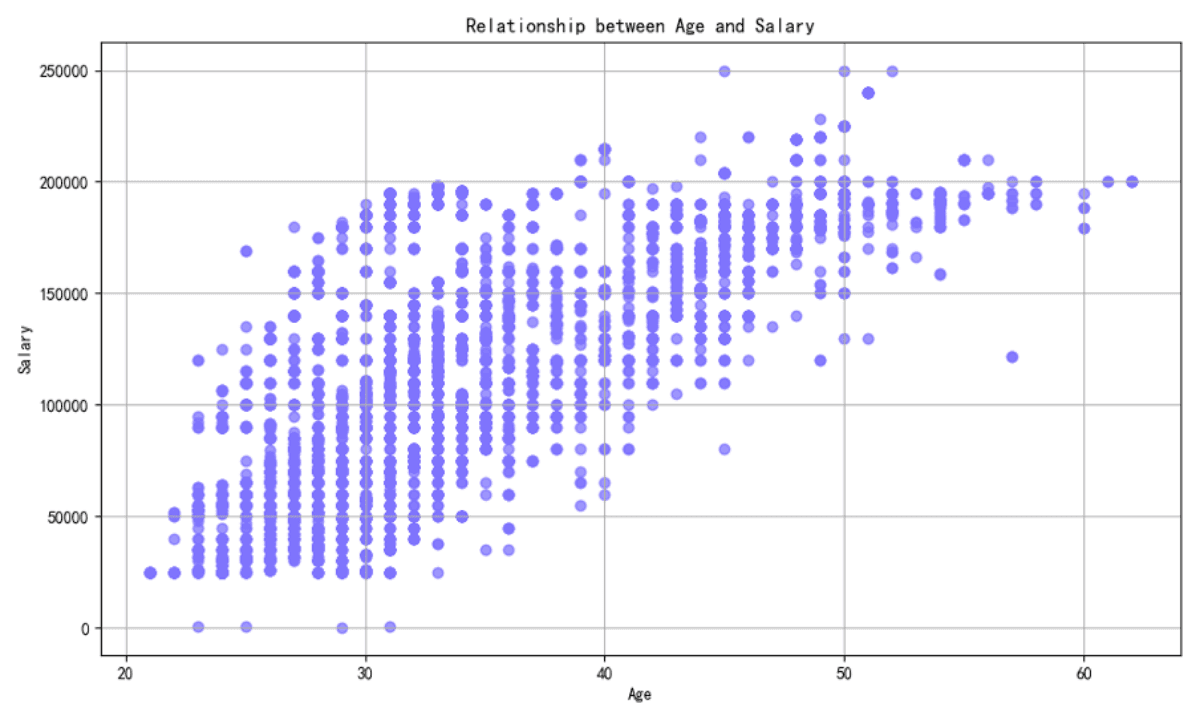
Age and Salary Relationship: The scatter plot reveals that while salary increases with age, the distribution is quite spread out, indicating that factors other than age might influence salary levels.
Gender Analysis
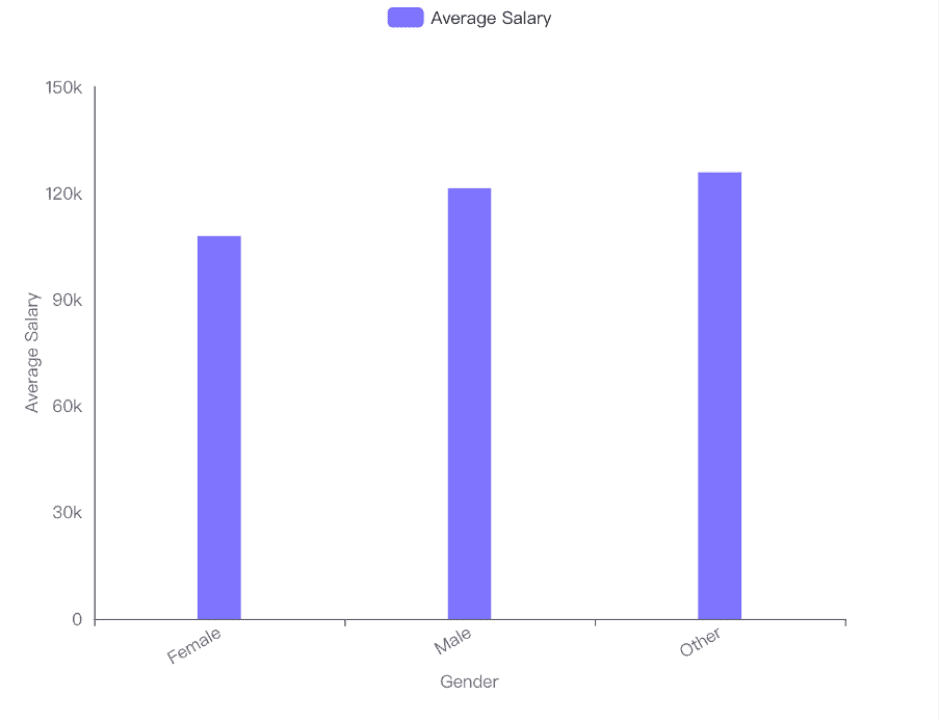
Average Salaries by Gender:
Female: $107,889
Male: $121,393
Other: $125,870 The bar chart visualization shows that individuals identifying as 'Other' have the highest average salary, followed by 'Male' and 'Female'.
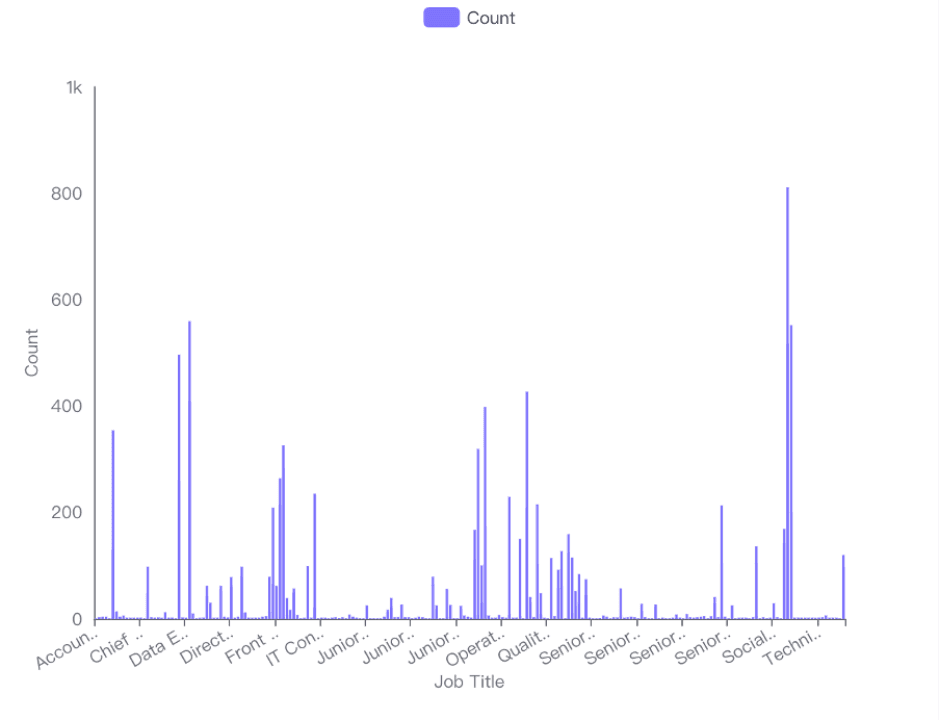
Gender Distribution Across Job Titles: The stacked bar chart indicates varied representation across different job titles, with some titles showing a significant imbalance.
Gender Distribution Across Education Levels: The visualization shows that males generally dominate in higher education levels except for the 'High School' category, where females are more prevalent.
Race Analysis
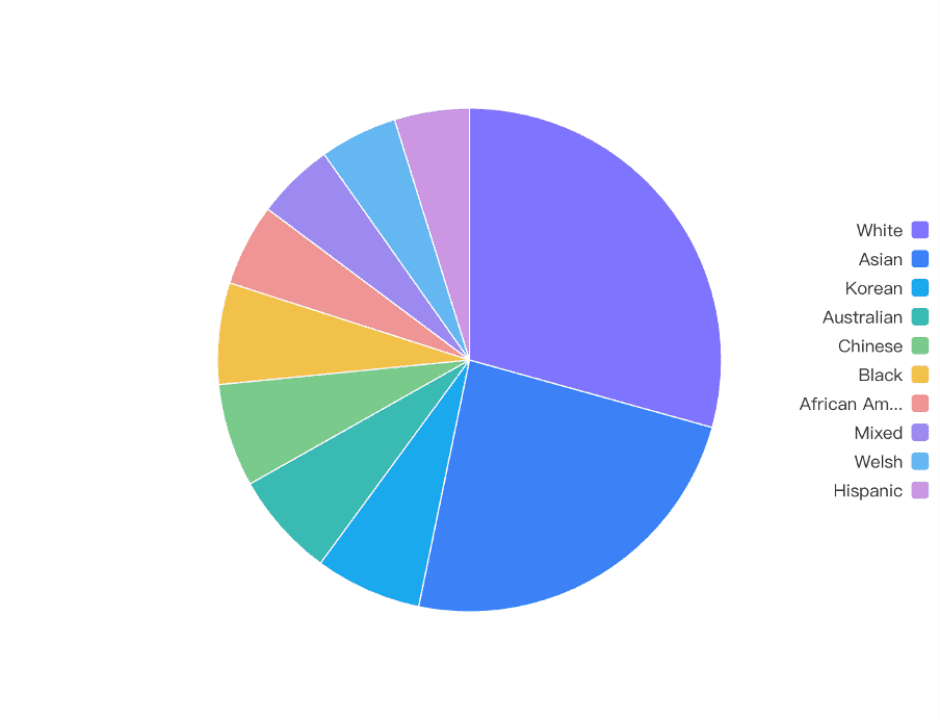
Race Distribution: The pie chart visualization shows that 'White' and 'Asian' are the most represented races in the dataset, making up a significant portion of the total.
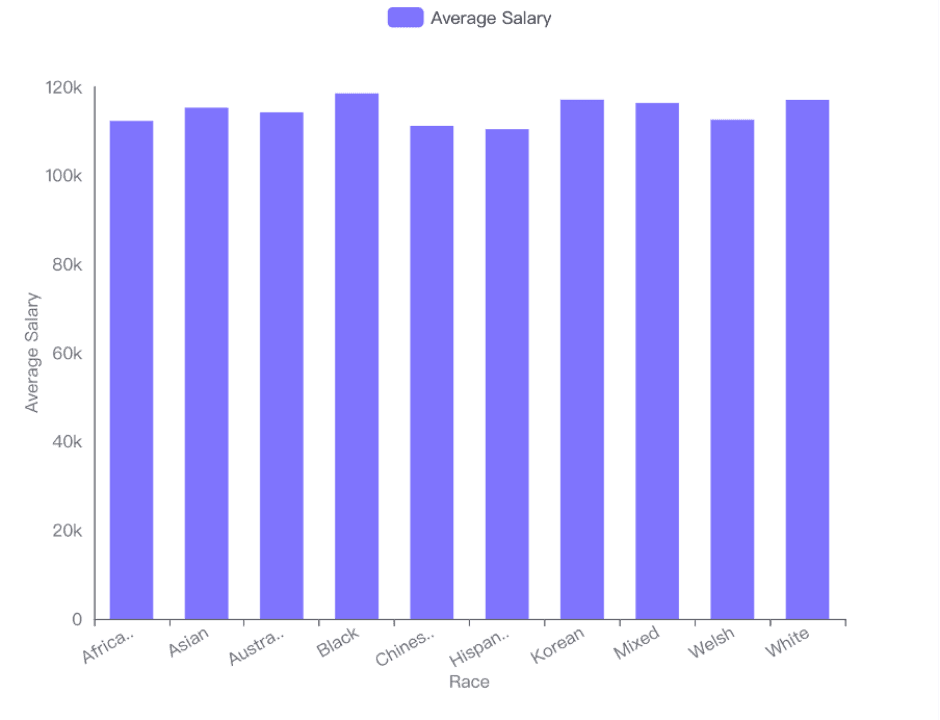
Average Salaries by Race: The bar chart indicates relatively uniform average salaries across different races, with 'Black' individuals earning slightly higher on average. The differences in salaries are not substantial, suggesting minimal salary disparity based on race within this dataset.
Overall, the analysis provides insights into how age, gender, and race relate to salary and distribution within the workforce. While there are noticeable trends in salary differences across gender and race, age shows a more complex relationship with salary, influenced by various other factors. Gender and race distributions in job titles and education levels highlight areas where diversity could be improved.
Education and Experience Analysis
Impact of Education Levels on Salary
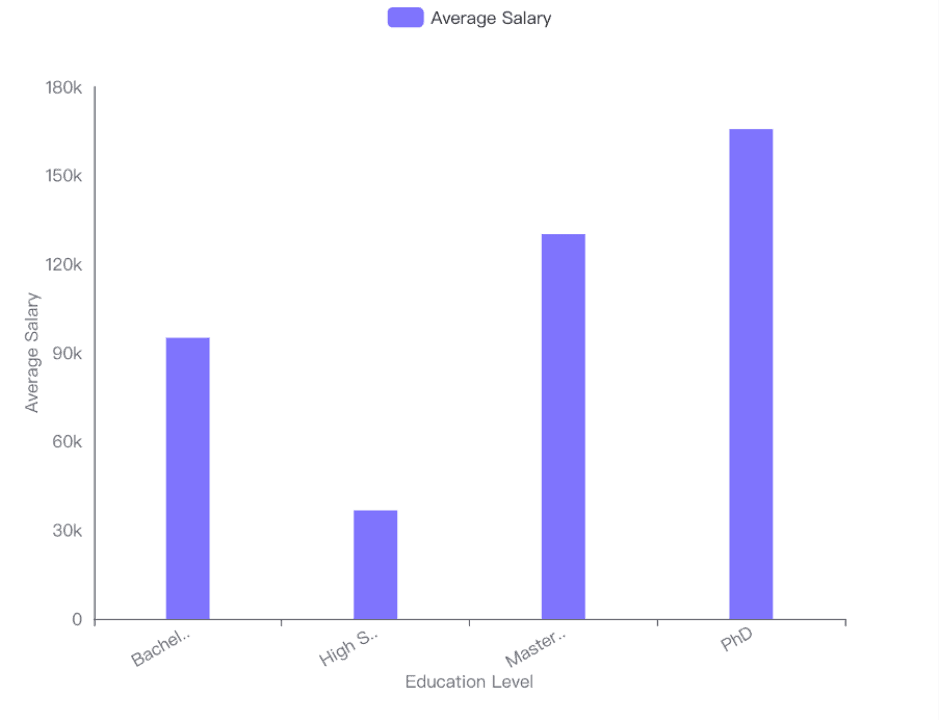
Higher education correlates with higher average salaries.
PhD holders earn the highest average salary at $165,651.
Master's degree holders follow with an average salary of $130,112.
Bachelor's degree holders earn $95,083 on average.
High school graduates have the lowest average salary at $36,707.
Distribution of Education Levels Across Job Titles
Variability in educational requirements across job titles is evident.
Technical and advanced roles such as 'Data Scientist' and 'Financial Manager' typically require higher education levels like Master's or PhD.
More generalized roles such as 'Sales Manager' or 'Product Manager' show a broader distribution of education levels including Bachelor's and High School diplomas.
Distribution of Education Levels Across Countries
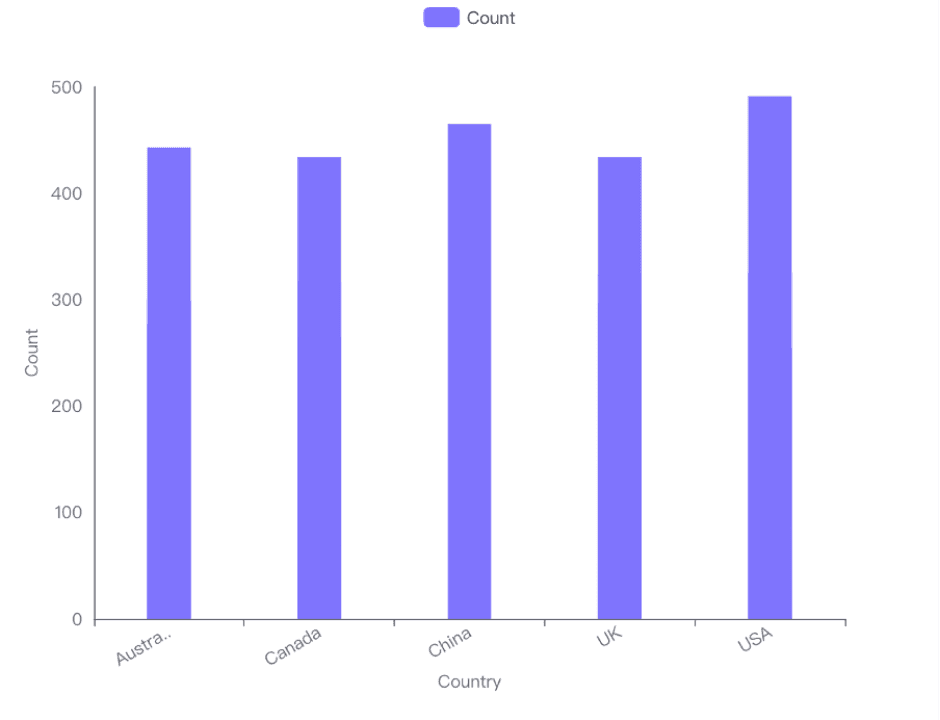
All countries show a significant presence of Bachelor's and Master's degrees.
The USA and Australia have a notably high count of individuals with Bachelor's and Master's degrees compared to other education levels.
PhD holders are less common across all countries but still present.
Distribution of Years of Experience Across Countries
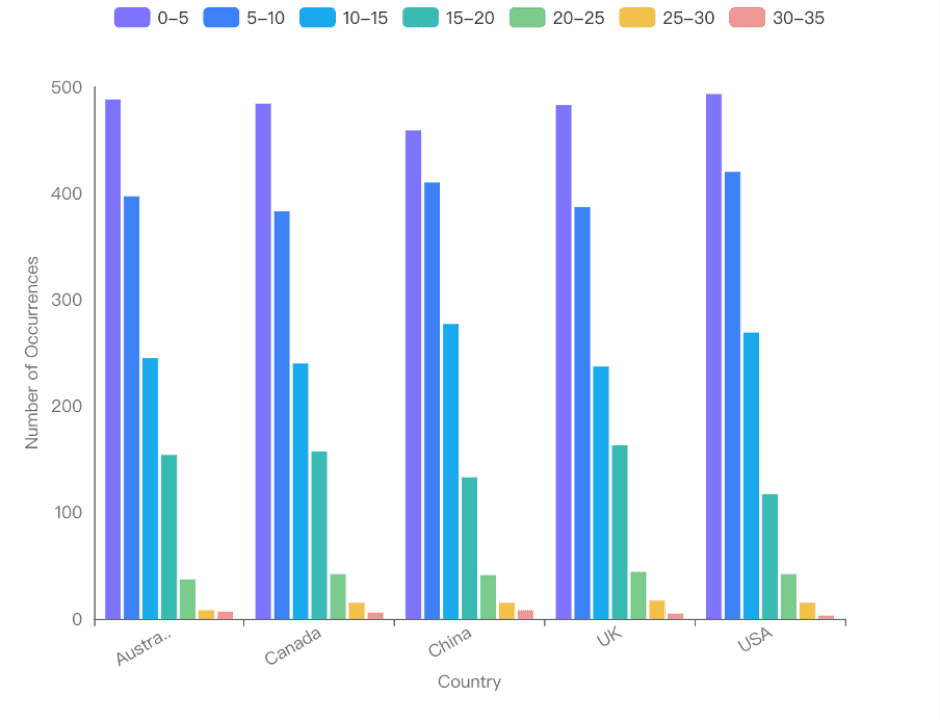
Younger workforce is more prevalent in all countries.
The majority of the workforce in countries like the USA, UK, and Australia has between 0-10 years of experience.
There is a gradual decrease in the workforce count as experience ranges increase, with very few individuals having 30-35 years of experience.
Overall, the data highlights the significant influence of education and experience on salary levels, as well as the variability in educational attainment and experience across different job titles and countries.
Job and Country Analysis
Salary Distribution
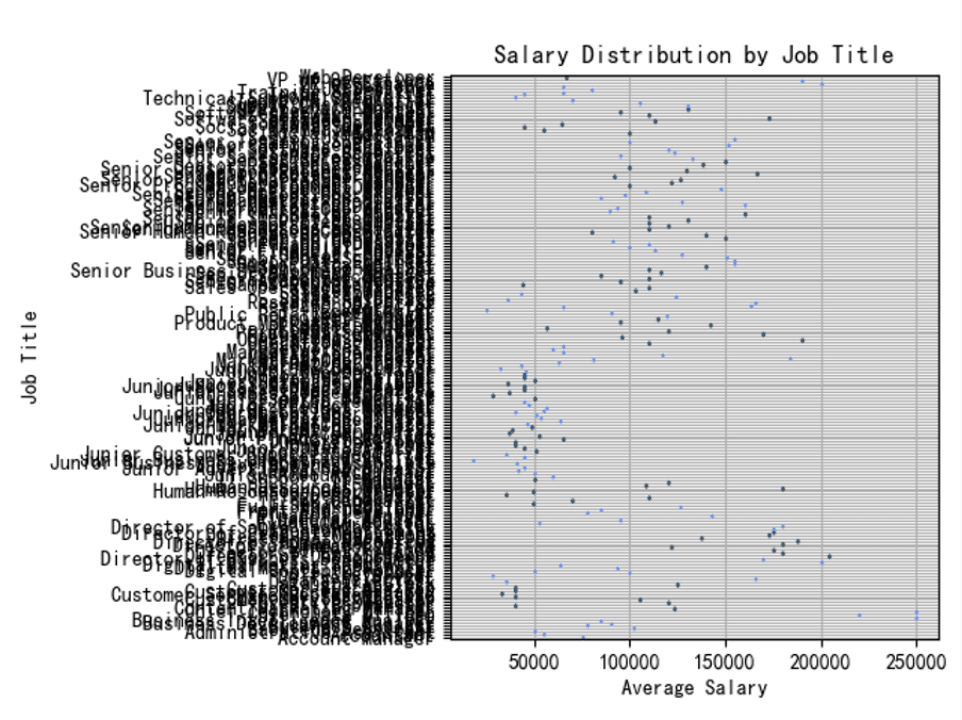
The salary distribution across different job titles has been visualized using a box plot. The plot indicates a wide range of salaries among various job titles, with some positions showing significant variability in compensation. For instance, roles like 'Software Engineer' and 'Strategy Consultant' exhibit a broad range of salaries, suggesting differences in seniority, company size, or geographic location. The highest salaries are observed in executive and senior managerial roles, such as 'VP' and 'Director', with some reaching up to $250,000.
Key Observations:
Highest Salary: Executive positions often have the highest salary caps.
Variability: Technical and specialized roles like 'Software Engineer' show high variability in salaries.
Median Salary: The overall median salary across all job titles is approximately $97,216.95.
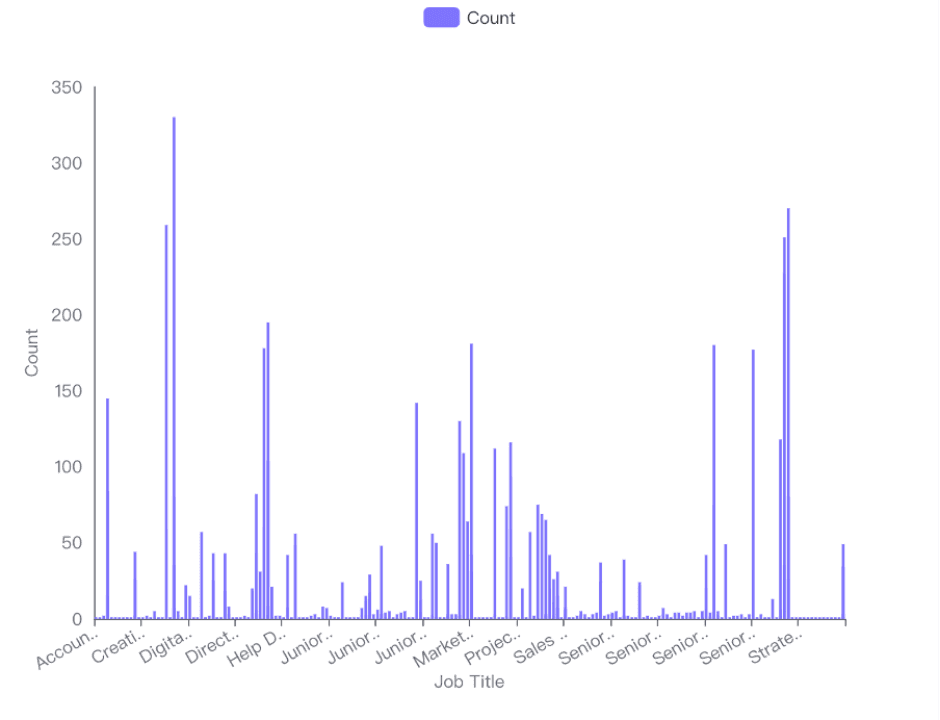
Average Years of Experience
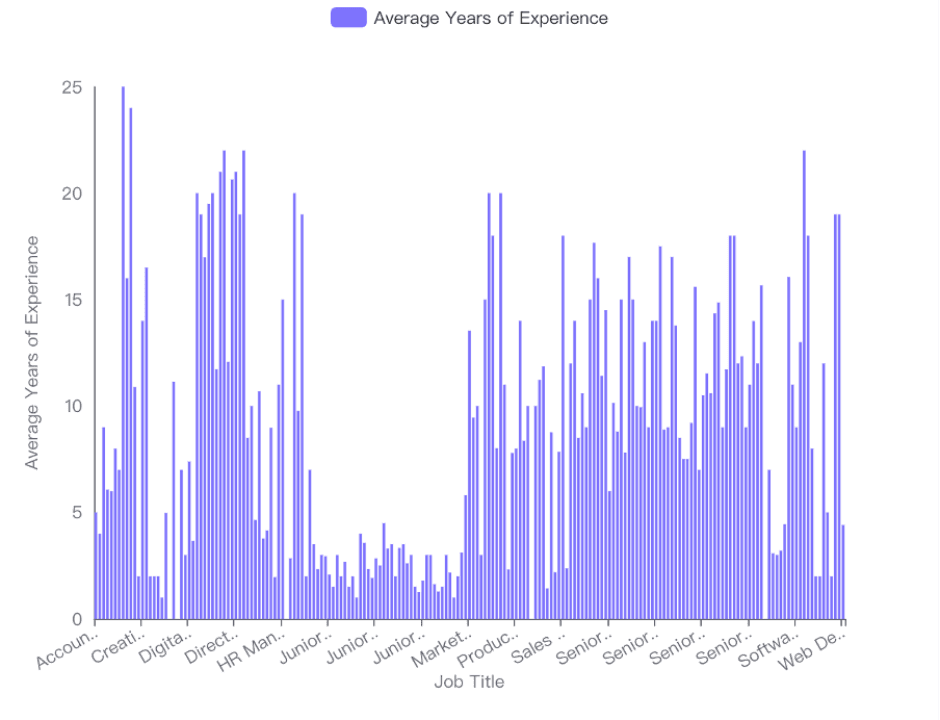
The average years of experience required for each job title are depicted in a bar chart. This visualization highlights that senior roles and specialized technical positions generally demand more years of experience. For example, 'Senior Business Analyst' and 'Technical Support Specialist' positions require more experience, which correlates with the complexity and responsibilities of these roles.
Key Observations:
Maximum Experience: Some senior roles require up to 25 years of experience.
Average Experience: The mean years of experience across all job titles is approximately 8.98 years.
Average Education Level
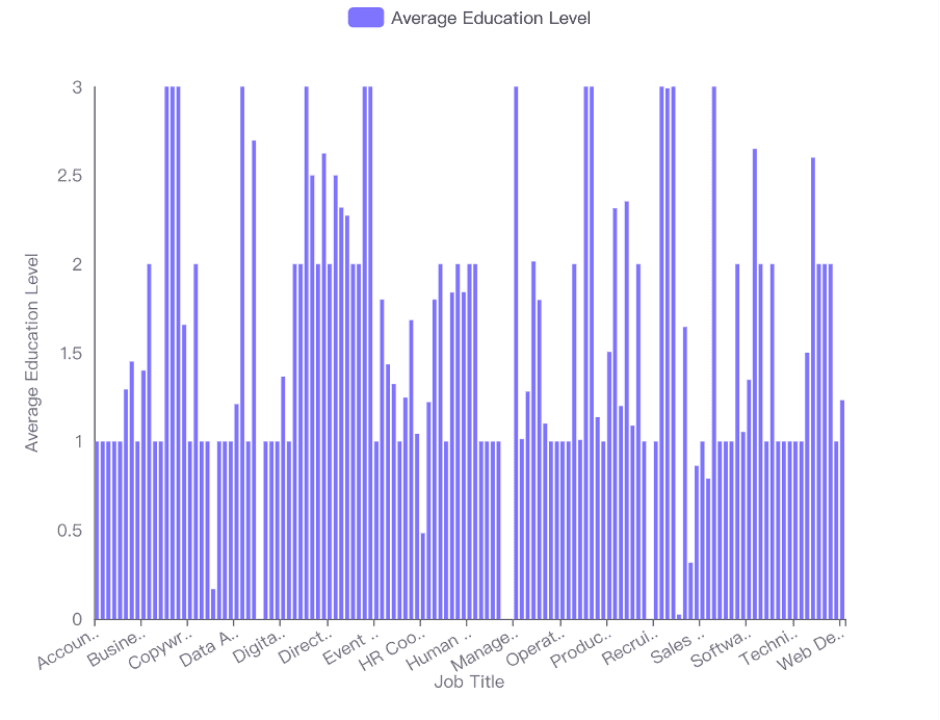
The average education level required for each job title is also presented in a bar chart. Most job titles require at least a basic level of formal education, with many positions showing an average education level of around 1 to 2, which could correspond to undergraduate and some postgraduate education. Positions in higher management or specialized fields sometimes show higher education levels, potentially indicating a preference or requirement for advanced degrees.
Key Observations:
Education Requirements: Most positions require at least an undergraduate degree.
Variation in Education Levels: Some roles, particularly in senior management and specialized technical fields, may require higher levels of education.
Conclusion
The analysis reveals significant insights into the correlation between job titles, salary, experience, and education levels. Higher salaries are often associated with senior roles that require more experience and higher education levels. However, there is considerable variability within certain technical and specialized roles, indicating that factors such as industry-specific skills, company size, and geographic location also play critical roles in determining salary and qualifications. This comprehensive understanding can aid stakeholders in making informed decisions regarding career planning, hiring strategies, and workforce development.
Additional Factors
Impact of Being in a Senior Role on Salary
Average Salary: The average salary for senior roles is $144,159.
Salary Range: Salaries range from $51,831 to $210,000.
Median Salary: The median salary is $150,000, indicating that half of the senior roles earn more than this amount.
Salary Distribution: The box plot visualization shows a relatively narrow salary range for senior roles, primarily clustered around the median.
Distribution of Senior Roles Across Different Demographics
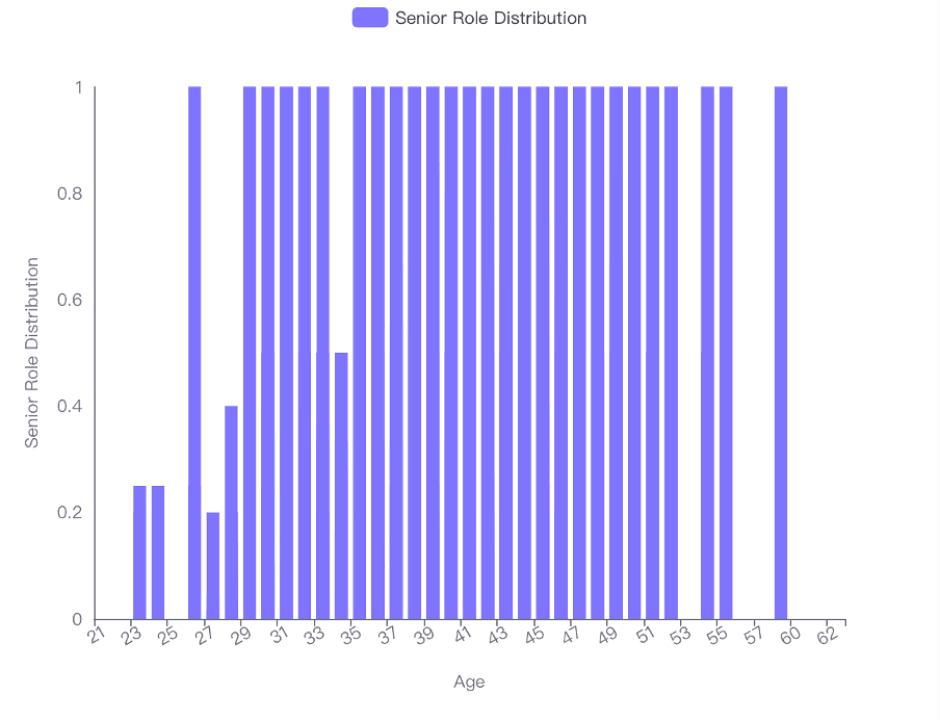
Age: Senior roles are distributed across a wide age range, with a noticeable increase in senior role distribution among individuals aged 50 and above.
Gender: The dataset includes both male and female genders, but specific distribution details per gender are not provided in the data summary.
Education Level: Senior roles are held by individuals across various education levels, with an average education level of 1.80 on a scale from 0 to 3.
Race: The dataset includes diverse racial backgrounds, including White, Asian, Australian, Korean, and Chinese, among others. Specific distribution details per race are not provided in the data summary.
Distribution of Senior Roles Across Different Job Titles
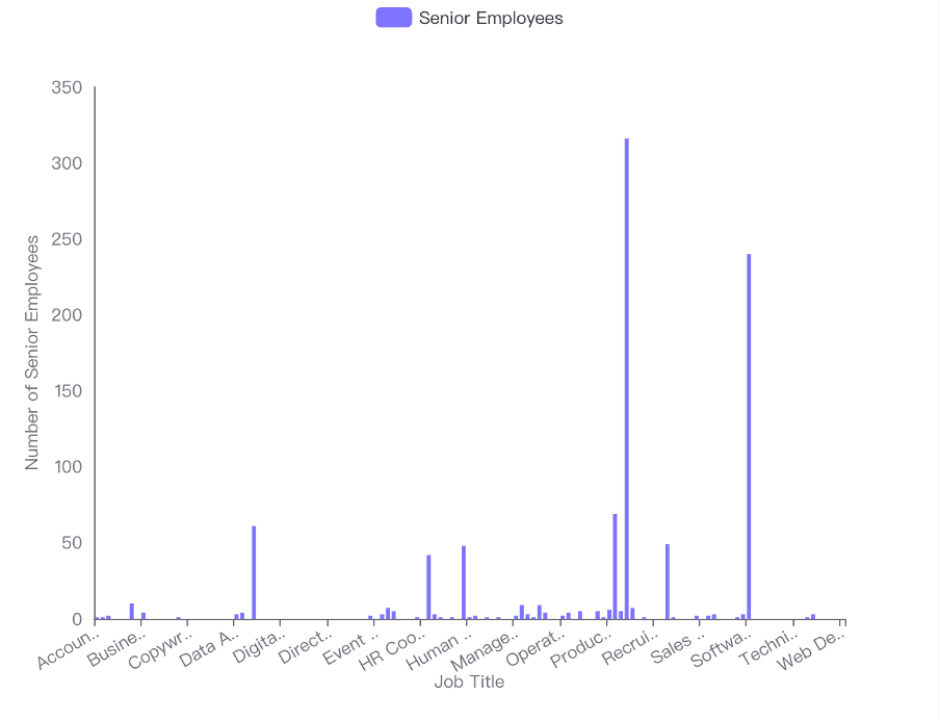
Job Title Variation: Senior roles are present in a variety of job titles from 'Web Developer' to 'CEO'.
Concentration of Senior Roles: Certain job titles, such as 'Strategy Consultant' and 'Technical Recruiter', have a higher concentration of senior roles, as indicated by the bar chart visualization.
Visualizations
Salary Distribution for Senior Roles: A box plot shows the salary distribution, highlighting the central tendency and spread.
Senior Role Distribution by Demographics: Bar charts for age, gender, education level, and race would provide insights into the demographic distribution of senior roles.
Senior Role Distribution by Job Title: A bar chart shows the number of senior employees across different job titles, indicating which titles are more likely to have senior roles.
Overall, being in a senior role significantly impacts salary, with a substantial average and a wide range of salaries. Senior roles are distributed variably across different demographics and job titles, with certain ages and job titles showing higher concentrations of senior positions.
Try Now
Try Powerdrill AI now, explore more interesting data stories in an effective way!