Data Facts: Comprehensive Analysis of Restaurant Performance Trends and Key Insights

This dataset captures the trends and dynamics of restaurant performance, including detailed information on revenue, customer ratings, marketing effectiveness, reservation patterns, and operational efficiency. With the analysis of this restaurant data, let's explore the key insights and trends impacting restaurant success across different variables and dimensions.
source: kaggle
Given the dataset, Powerdrill detects and analyzes the metadata, then gives these relevant inquiries:
1. Correlation Analysis
Examine correlations between Rating, Revenue, Marketing Budget, Social Media Followers, and other variables.
Analyze relationships between seating capacity, average meal price, and chef experience years.
2. Revenue Analysis
Compare revenue across different locations and cuisines.
Identify key factors driving higher revenue, such as marketing budget and social media followers.
3. Rating Analysis
Investigate how Ambience Score, Service Quality Score, Chef Experience Years, and Parking Availability affect ratings.
Determine the impact of average meal price on customer ratings.
4. Reservation Patterns Analysis
Analyze weekend and weekday reservation patterns and their effect on overall revenue.
Study reservation trends for different locations and cuisines.
5. Customer Feedback Analysis
Study the relationship between the number of reviews, average review length, and ratings.
Analyze key themes and patterns in customer feedback.
6. Marketing Effectiveness Analysis
Analyze the impact of marketing budget and social media followers on revenue and ratings.
Compare the marketing effectiveness for different locations and cuisines.
Correlation Analysis
The correlation analysis between various variables such as 'Rating', 'Revenue', 'Marketing Budget', 'Social Media Followers', and others has been conducted. The key findings from the correlation matrix are as follows:
Strong Positive Correlation:
Marketing Budget and Social Media Followers: A very high correlation (0.99) suggests that increases in marketing budget are almost always accompanied by increases in social media followers.
Revenue and Seating Capacity: A significant correlation (0.68) indicates that higher revenue is often associated with larger seating capacities.
Moderate Positive Correlation:
Rating and Marketing Budget: A correlation of 0.26 suggests a moderate relationship where higher marketing budgets might lead to better ratings.
Rating and Social Media Followers: Similarly, a correlation of 0.29 indicates that more social media followers can potentially improve ratings.
Other Notable Correlations:
Weekend and Weekday Reservations: Both show moderate correlations with Revenue (0.29 and 0.27 respectively), suggesting that reservations play a role in revenue generation.
Visualization Insights
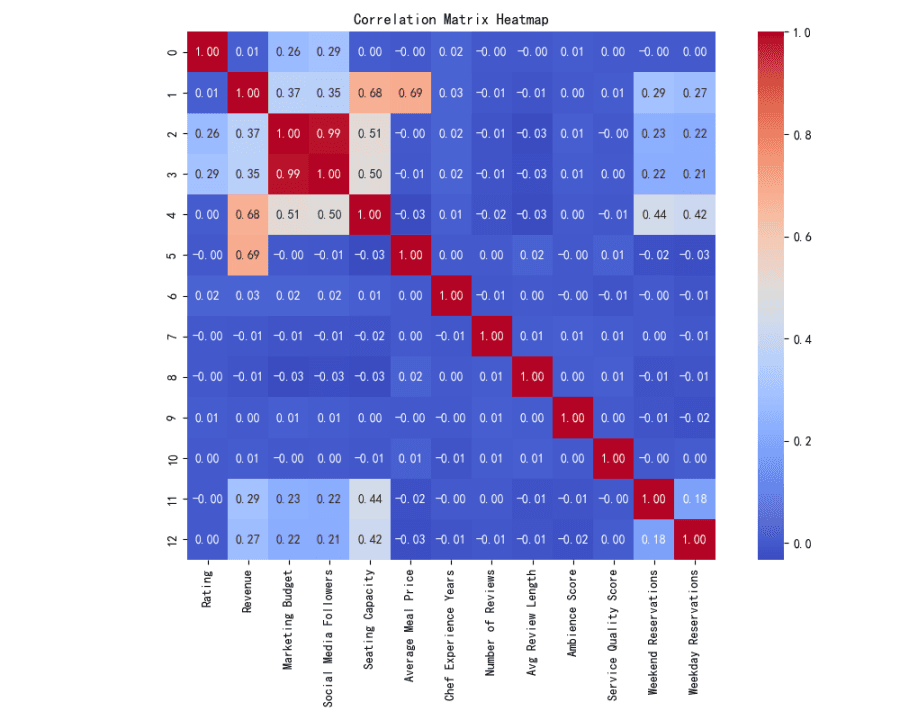
The heatmap visualization effectively illustrates the strength and direction of relationships between the variables. The color intensity directly corresponds to the strength of the correlation, with red indicating positive and blue indicating negative correlations.
Recommendations for Strategic Decisions
Increase Marketing Budget: Given its strong correlation with both revenue and social media followers, increasing the marketing budget could be beneficial.
Leverage Social Media: Enhancing social media presence could positively impact both ratings and revenue.
Optimize Seating Capacity: Considering its correlation with revenue, optimizing seating capacity based on demand forecasts could improve profitability.
Revenue Analysis
Revenue Analysis Across Different Locations
Highest Revenue Location: Downtown with an average revenue of $866,582.
Lowest Revenue Location: Rural areas with an average revenue of $450,158.
Suburban Revenue: Moderately high with an average of $647,050.
Revenue Analysis Across Different Cuisines
Highest Revenue Cuisine: Japanese cuisine generates the highest revenue with $937,969.
Lowest Revenue Cuisine: Indian cuisine has the lowest revenue among the listed options with $496,616.
Other Notable Cuisines: French and Italian cuisines also perform well, generating revenues of 820,204 and 692,742 respectively.
Key Factors Driving Higher Revenue
Marketing Budget: There is a moderate positive correlation between marketing budget and revenue, quantified at 0.365. This suggests that increased marketing budget can potentially lead to higher revenue.
Social Media Followers: Similar to marketing budget, there is a moderate correlation of 0.354 between social media followers and revenue. This indicates that social media presence also contributes positively to revenue.
Visualizations Provided
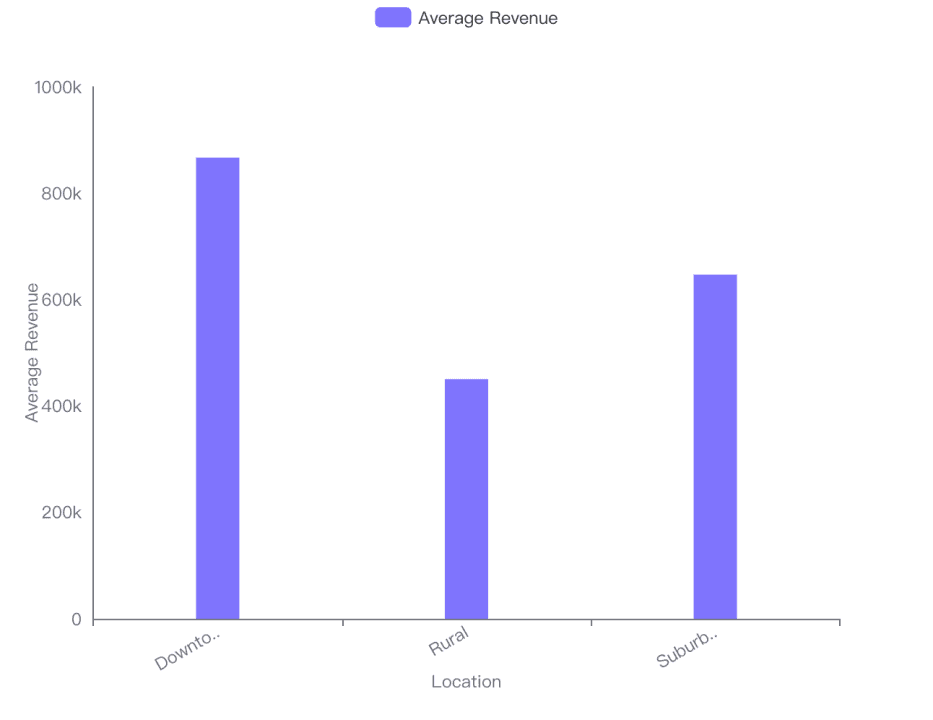
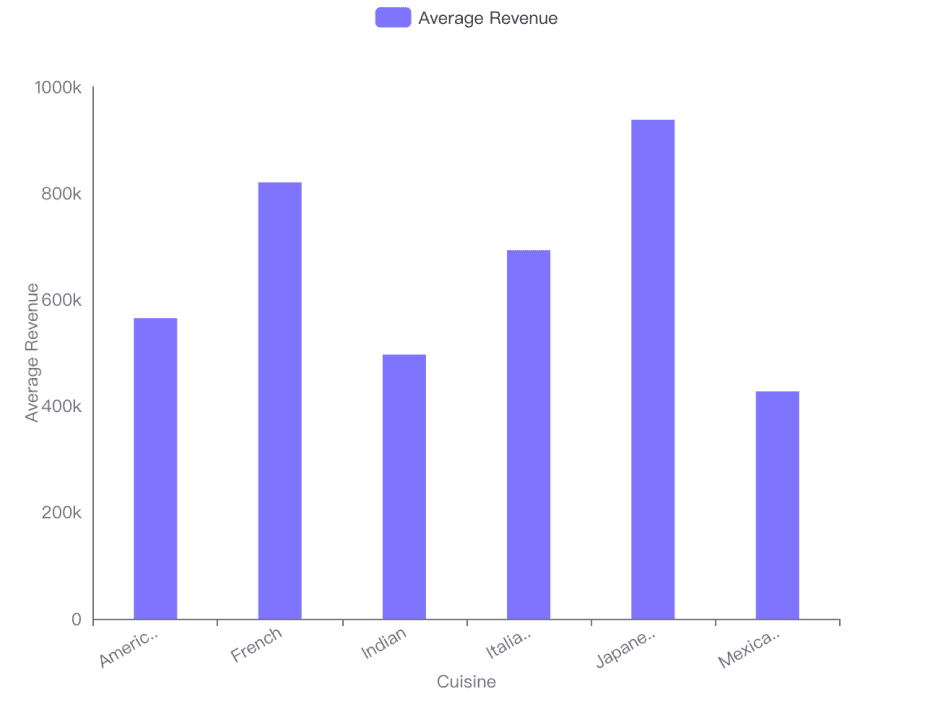
Bar Charts: Visualizations for revenue by location and cuisine clearly depict the variations across different categories, with downtown and Japanese cuisine leading in their respective categories.
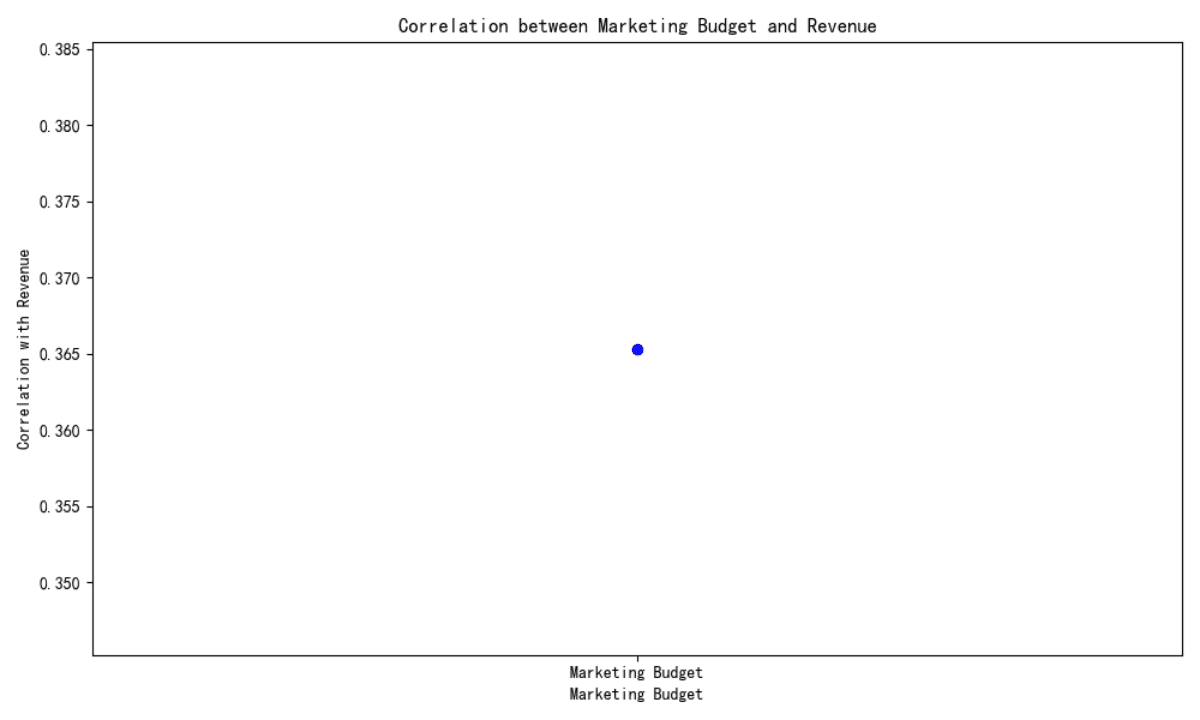
Scatter Plots: The plots for correlations between revenue and both marketing budget and social media followers show the positive relationship, although the data points are limited.
Overall, the analysis indicates that location and type of cuisine significantly impact revenue generation. Additionally, investing in marketing and enhancing social media presence are likely effective strategies for increasing revenue. These insights should guide strategic decisions in resource allocation and marketing strategies to optimize revenue.
Rating Analysis
1. Ambience Score
Correlation: The correlation between Ambience Score and Ratings is very low (approximately 0.0071), indicating a negligible direct impact of Ambience Score on Ratings.
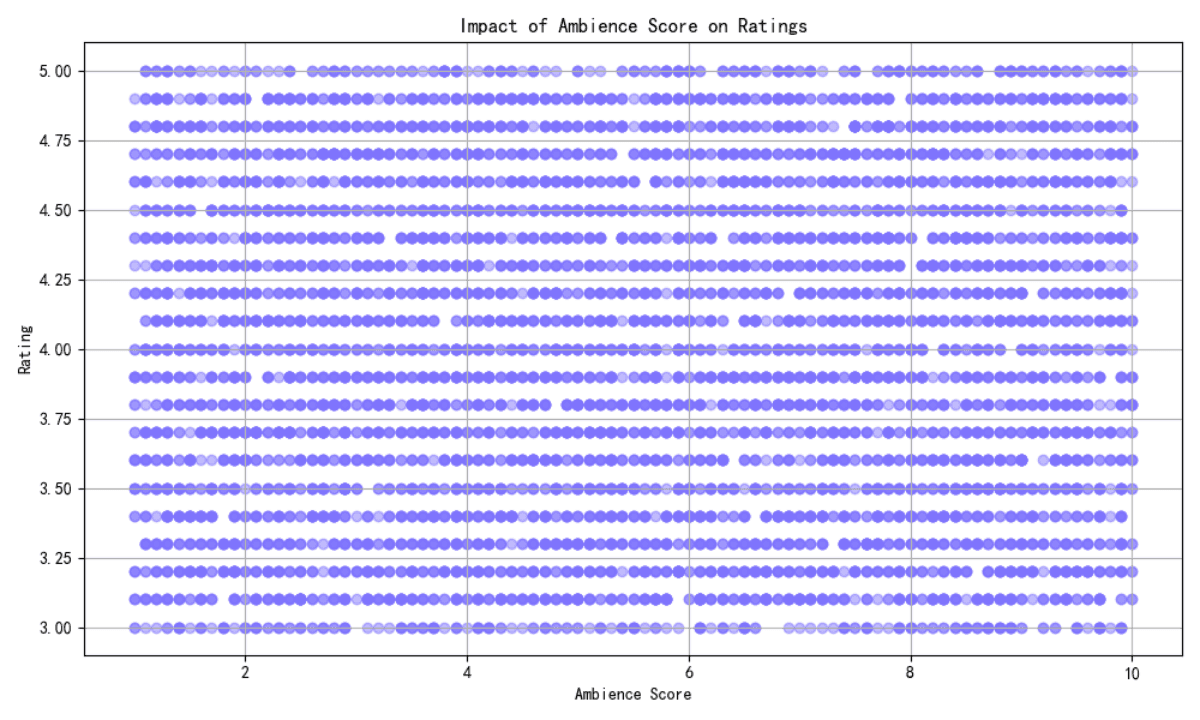
Visualization: The scatter plot shows a dense distribution of ratings across all levels of Ambience Score, with no clear trend indicating that higher Ambience Scores lead to higher Ratings.
2. Service Quality Score
Correlation: Similar to Ambience Score, the correlation between Service Quality Score and Ratings is extremely low (approximately 0.0009), suggesting minimal influence on Ratings.
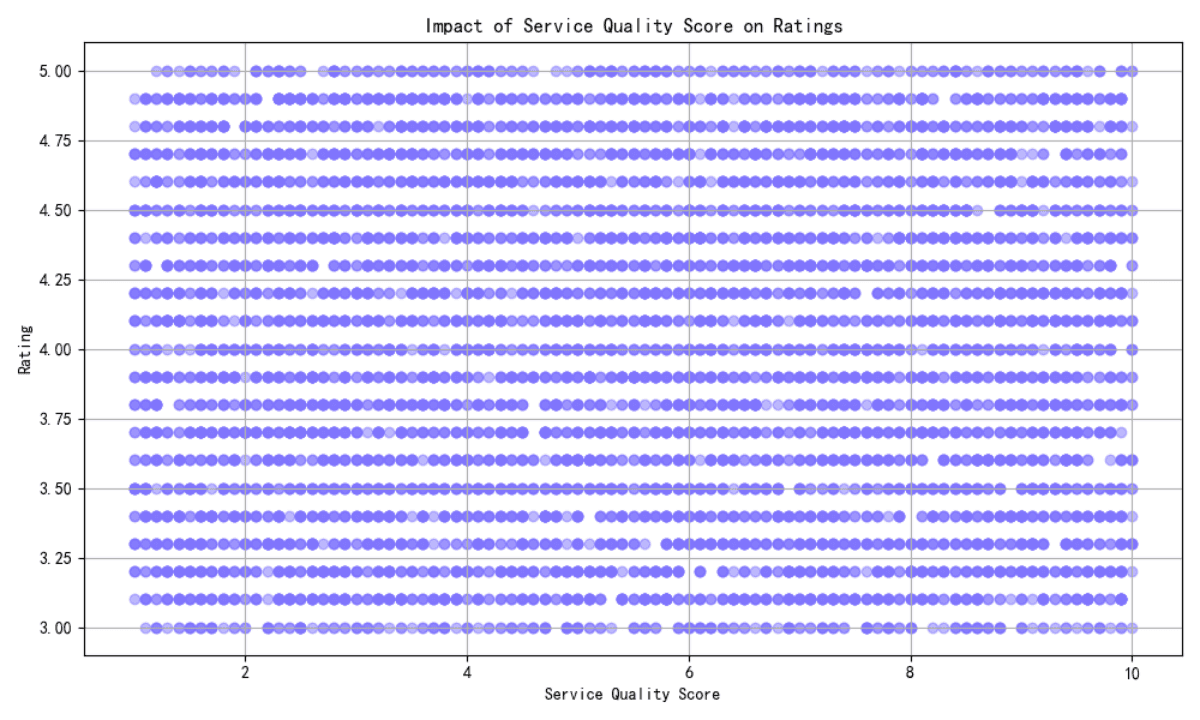
Visualization: The scatter plot for Service Quality Score also displays a uniform distribution of Ratings across various scores, lacking any significant pattern or trend.
3. Chef Experience Years
Correlation: The correlation coefficient is slightly higher at 0.0222 compared to Ambience and Service Quality Scores, but still represents a weak relationship.
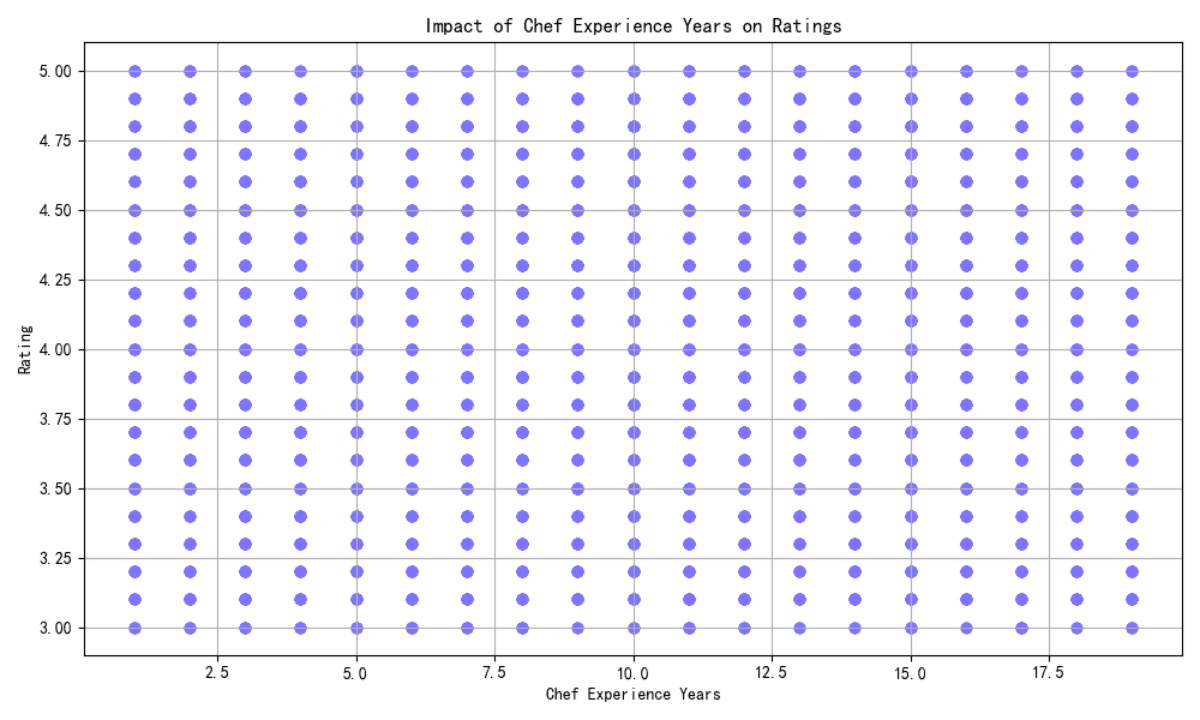
Visualization: The scatter plot shows a spread of Ratings across different levels of Chef Experience Years without a clear positive trend, indicating that more experience does not consistently correlate with higher Ratings.
4. Parking Availability
Correlation: The correlation is effectively zero (0.0020), showing no meaningful connection between Parking Availability and Ratings.
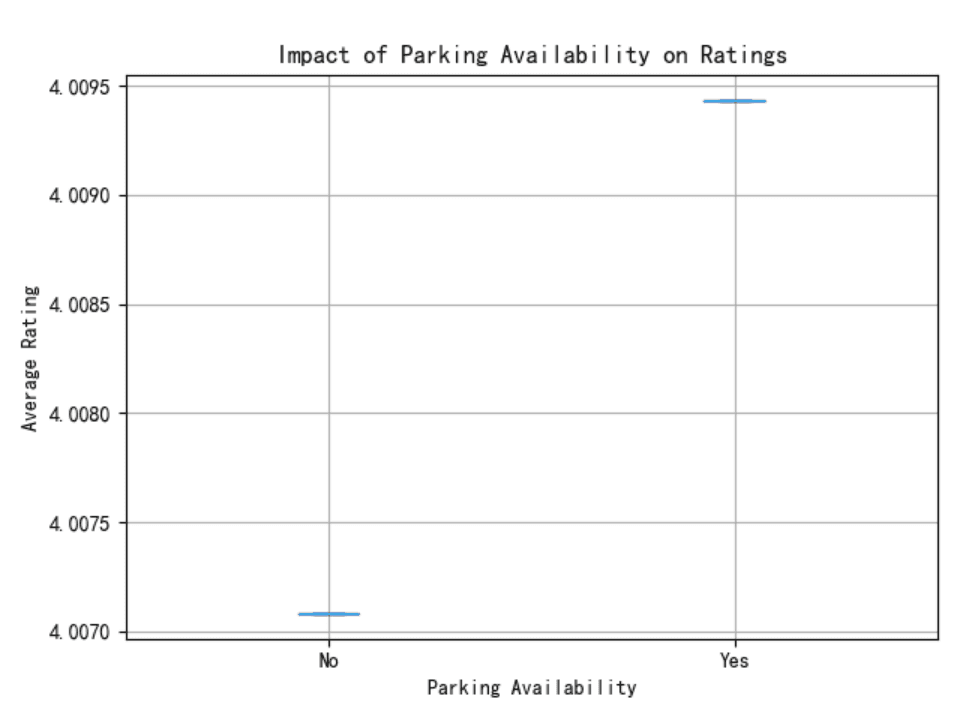
Visualization: The box plot reveals that the average Ratings for restaurants with and without parking availability are nearly identical, further supporting the statistical findings.
5. Average Meal Price
Correlation: There is a very slight negative correlation (-0.0023) between Average Meal Price and Ratings, suggesting that higher prices might not favor higher Ratings.
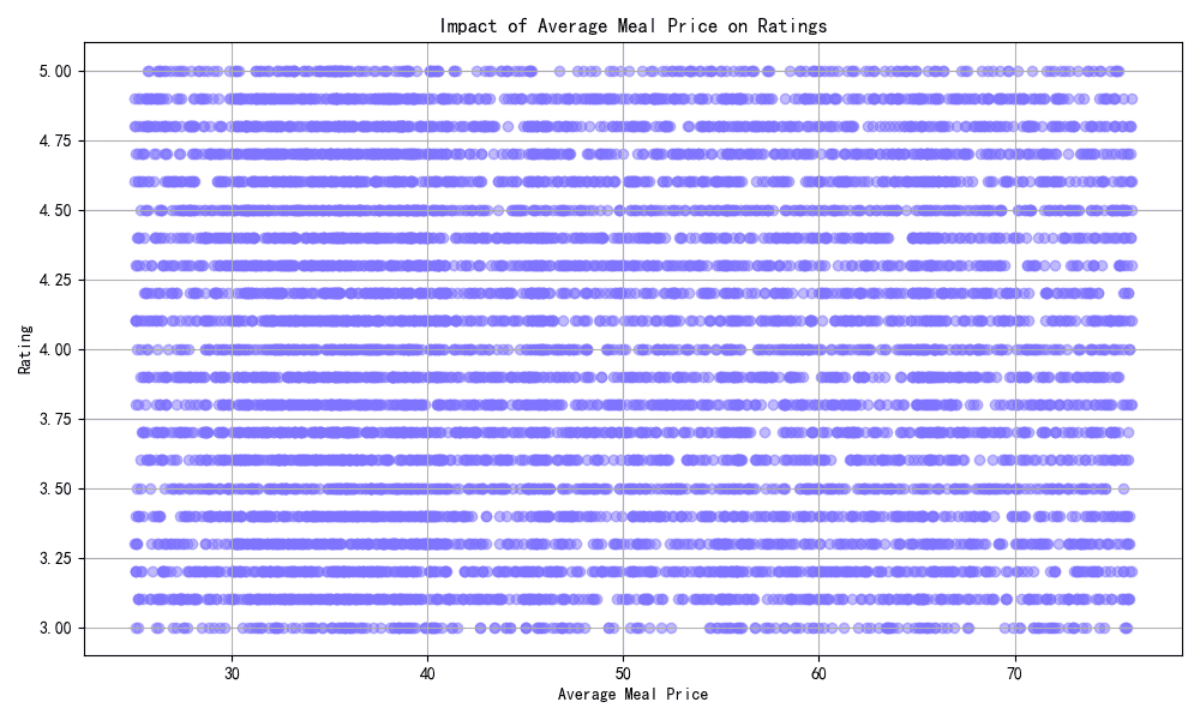
Visualization: The scatter plot displays a broad range of Ratings at different meal prices, with no evident trend that higher prices lead to better Ratings.
Reservation Patterns Analysis
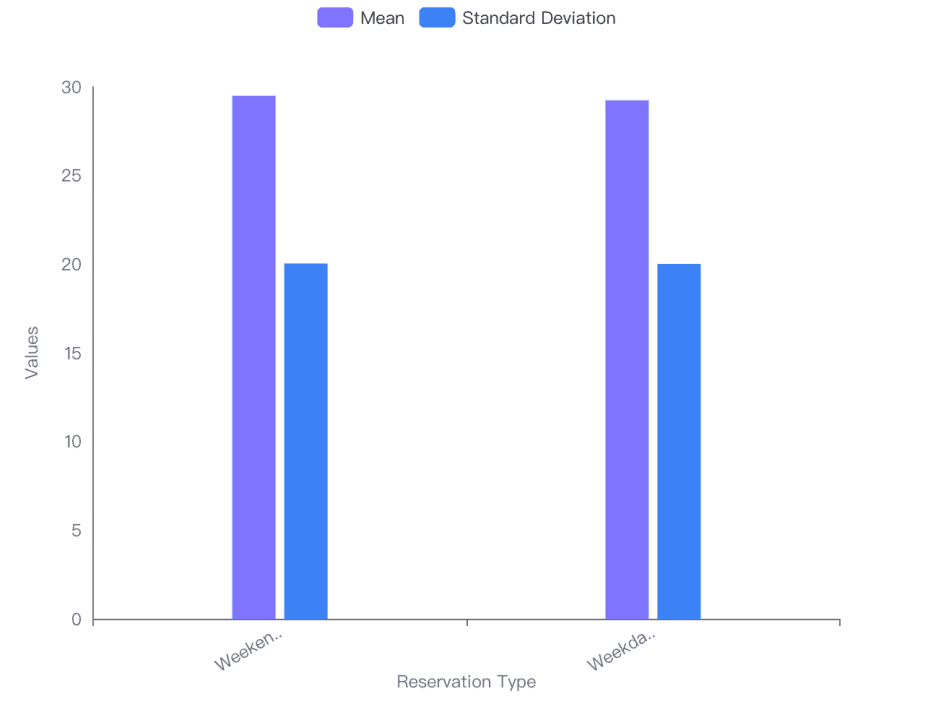
Weekend vs. Weekday Reservations: The mean number of reservations is slightly higher on weekends (29.49) compared to weekdays (29.24). The standard deviation is also marginally higher on weekends (20.03) than on weekdays (20.00), indicating a slightly greater variability in the number of reservations made during weekends.
1.Reservation Trends by Location and Cuisine
Downtown Location: Shows significantly higher average reservations both during weekends and weekdays across all cuisines compared to rural and suburban areas. This suggests a strong preference for dining in downtown areas, possibly due to higher population density or better restaurant options.
Cuisine Popularity: In downtown areas, Italian and Indian cuisines show the highest average reservations, indicating a preference for these cuisines among diners.
2.Impact of Reservations on Revenue
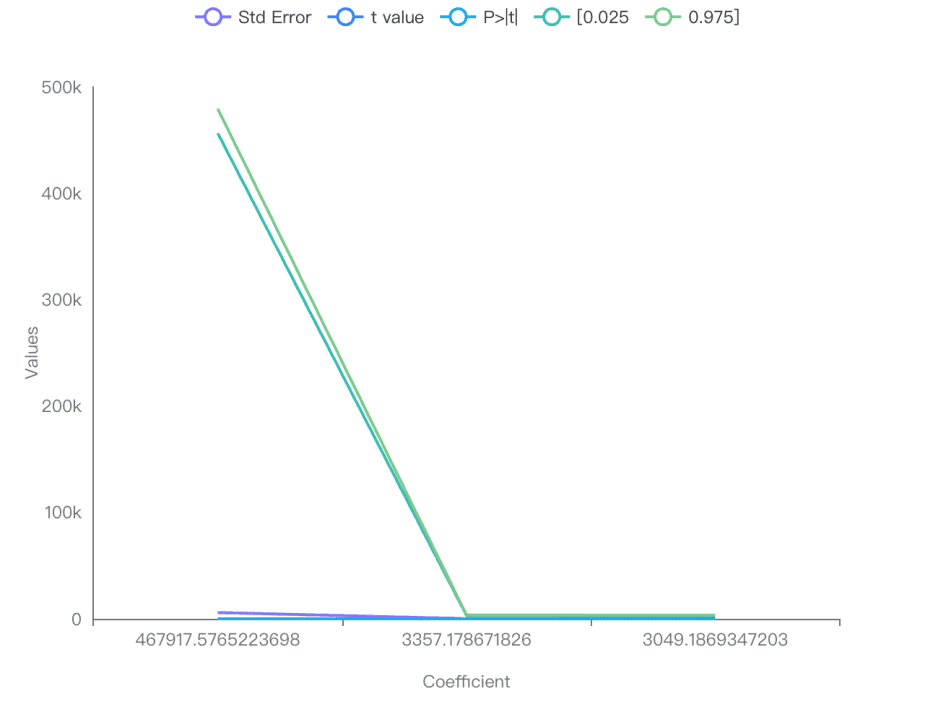
Statistical Significance: The coefficients from the regression analysis indicate a strong positive relationship between the number of reservations and revenue. The coefficient for weekend reservations is particularly high (467918), with a very low p-value, suggesting that an increase in weekend reservations significantly boosts revenue.
Confidence Intervals: The confidence intervals ([456430, 479405] for weekends) are tight around the coefficients, further affirming the reliability of these estimates.
3.Visual Insights
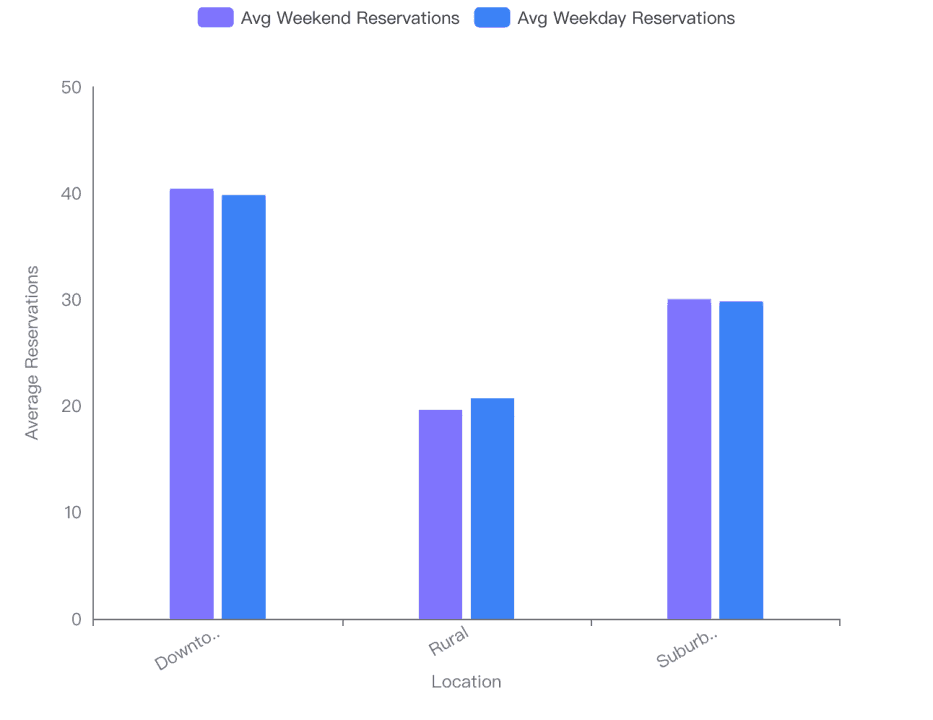
Bar Charts: Visualizations confirm the numerical analysis, showing higher mean reservations on weekends and significantly higher reservations in downtown locations.
Scatter Plot/Line Chart: Illustrates a clear positive trend between reservations and revenue, reinforcing the conclusion that more reservations lead to higher revenue, especially on weekends.
Overall, the data suggests that focusing marketing and operational efforts on increasing weekend reservations, particularly in downtown areas and for popular cuisines like Italian and Indian, could be an effective strategy for boosting revenue.
Customer Feedback Analysis
1.Correlation Analysis
Number of Reviews and Avg Review Length: The correlation coefficient is 0.0058, indicating a very weak positive correlation. This suggests that the number of reviews does not significantly influence the average length of the reviews.
Number of Reviews and Rating: The correlation coefficient is -0.0042, indicating a negligible negative correlation. This implies that the number of reviews has almost no impact on the ratings.
Review Length and Rating: The correlation coefficient is -0.0013, also showing a negligible negative correlation. This suggests that the length of reviews does not significantly affect the ratings.
2.Visualization of Correlations
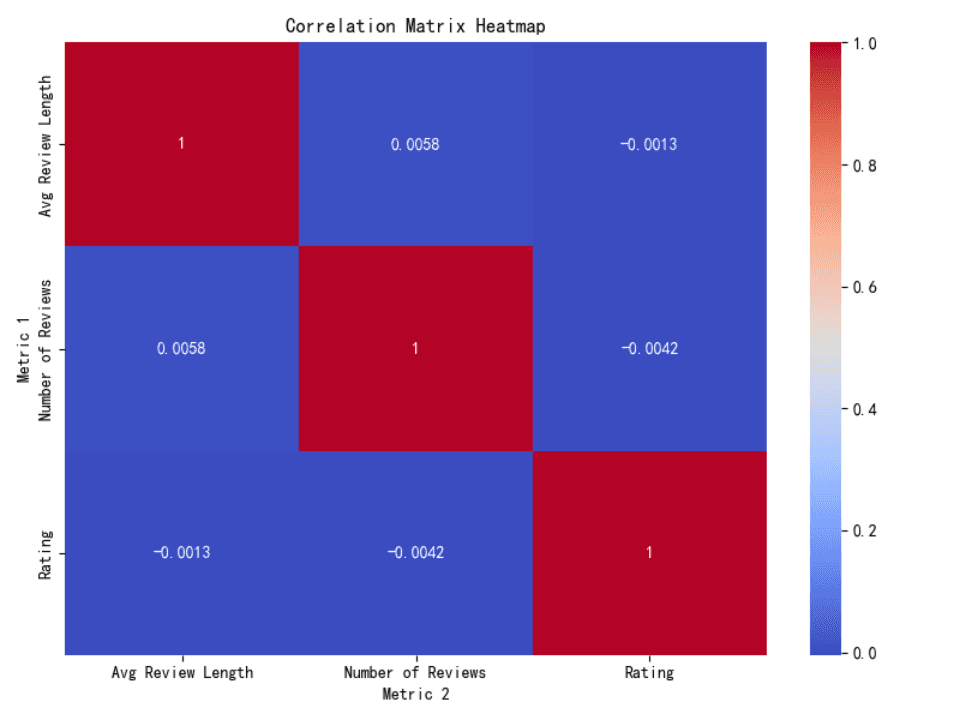
The heatmap visualizes these correlations, with values close to zero across different metrics, reinforcing the conclusion of very weak relationships between the number of reviews, average review length, and ratings.
3.Analysis of Key Themes and Patterns in Feedback
Average Review Length: The data shows a mean of 174.77 words with a standard deviation of 71.9981 words. The minimum and maximum lengths are 50.01 and 8368 words, respectively.
Number of Reviews: The mean number of reviews is 523.01, with a standard deviation of 277.215. The minimum and maximum numbers of reviews are 50 and 8368, respectively.
Outliers: There are no outliers identified in both the average review length and the number of reviews, suggesting a relatively uniform distribution without extreme values.
4. Visualization of Trends in Feedback
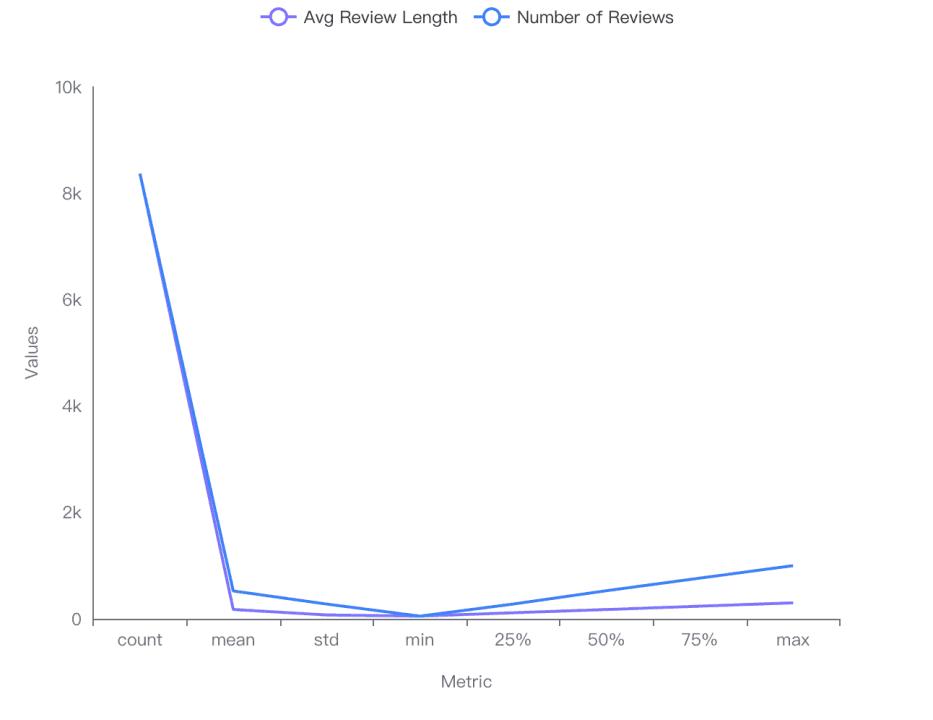
The line graph shows a steep decline from the maximum values to more common values in both average review length and number of reviews. This indicates that while there are instances of very long reviews or high numbers of reviews, they are not common.
Summary
The analysis reveals that there is a very weak correlation between the number of reviews, average review length, and ratings, suggesting that these metrics do not significantly influence each other. The examination of feedback patterns indicates a typical range for review lengths and counts, with no significant outliers, pointing to a consistent pattern in customer feedback across the dataset. This analysis helps in understanding the general behavior of customers in terms of review engagement and content but shows that these factors do not strongly impact the ratings.
Marketing Effectiveness Analysis
Impact Analysis:
Marketing Budget on Revenue:
Correlation Coefficient: 0.37
Observation: There is a moderate positive correlation between marketing budget and revenue, suggesting that increases in marketing budget tend to be associated with increases in revenue.
Social Media Followers on Revenue:
Correlation Coefficient: 0.35
Observation: Similar to marketing budget, there is a moderate positive correlation between the number of social media followers and revenue.
Marketing Budget on Ratings:
Correlation Coefficient: 0.26
Observation: A weaker positive correlation exists between marketing budget and ratings, indicating that while there is some relationship, it is less pronounced than with revenue.
Social Media Followers on Ratings:
Correlation Coefficient: 0.29
Observation: There is a slightly stronger correlation between social media followers and ratings compared to marketing budget and ratings, but it remains moderate.
Marketing Effectiveness Comparison:
By Location:
Downtown: Highest average revenue and slightly higher ratings.
Rural: Lowest average revenue and ratings close to other locations.
Suburban: Moderate revenue and slightly lower ratings compared to downtown.
By Cuisine:
Japanese: Highest average revenue and strong ratings.
French: High revenue and good ratings.
Italian: Good revenue and the highest ratings.
Indian: Moderate revenue and strong ratings.
American: Lower revenue and the lowest ratings.
Mexican: Lowest revenue among the cuisines analyzed.
Try Now
Try Powerdrill Discover now, explore more interesting data stories in an effective way!