Data Fact: USA Rainfall Prediction (2024-2025)

In predicting rainfall across the United States for 2024-2025, meteorologists and data scientists alike rely on various atmospheric variables to understand future weather patterns. Humidity, temperature, cloud cover, wind speed, and pressure changes all play crucial roles in determining the likelihood and volume of rainfall. This article delves into the intricate relationships between these factors, providing statistical insights and visual analysis to reveal how each one influences rainfall predictions.
Dataset: 🌧️ USA Rainfall Prediction Dataset (2024-2025)
Relevant inquiries powered by Powerdrill AI:
What's the rain distribution by locations?
What's the relationship between 'Humidity', 'Temperature', and 'Precipitation'?
What is the distribution of cloud cover percentages across various locations?
Investigate the impact of wind speed on precipitation levels and the likelihood of rain, and compare these findings with the influence of cloud cover.
How does the average temperature vary between the months of 2024 and 2025?
Are there any noticeable patterns in pressure changes that could indicate weather anomalies?
ROC Curve Analysis
1. What's the rain distribution by locations?
Proportion of Rainy Days
Definition: The larger the proportion (or number), the more rainy days there are relative to the total period.
Mean Proportion: The average proportion of rainy days across all locations is 0.22.
Variation: The proportions range from a minimum of 0.21 to a maximum of 0.24, indicating some variability in rain distribution among locations.
Detailed Proportions
Highest Proportion: San Diego has the highest proportion of rainy days at 0.236.
Lowest Proportion: New York has the lowest proportion at 0.208.
Other Notable Locations: Chicago (0.229), Philadelphia (0.225), and Seattle (0.223) also have relatively high proportions of rainy days.
Visualization Insights
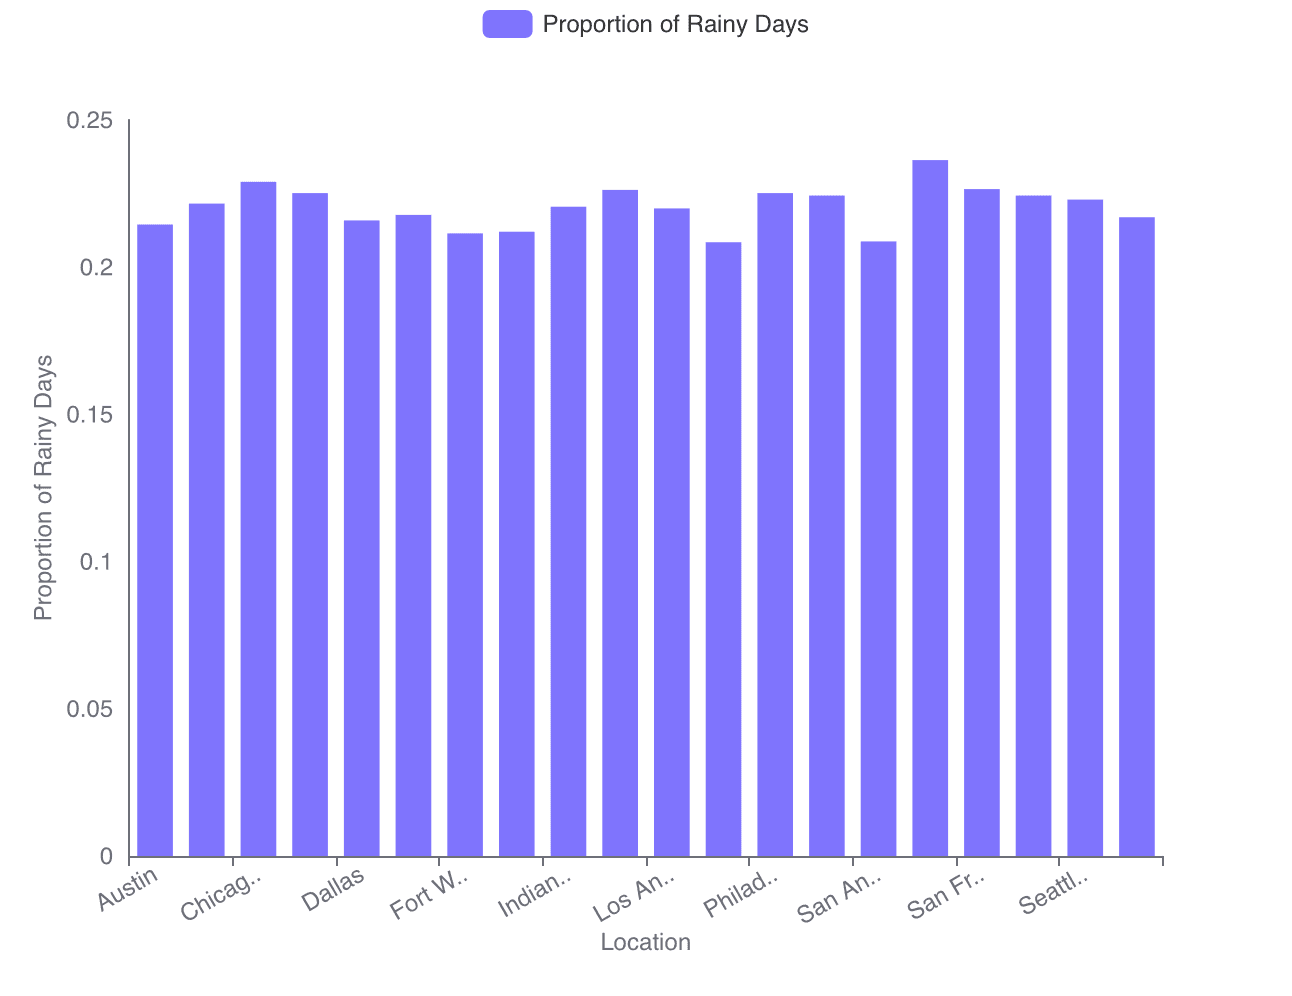
Bar Chart Patterns: The bar chart visually represents the proportion of rainy days for each location, showing a consistent distribution with slight variations. Locations like San Diego and Chicago stand out with higher bars, indicating more frequent rainy days compared to others like New York.
Conclusion and Insights
Consistent Distribution: While there is some variability, the distribution of rainy days is relatively consistent across locations.
Regional Differences: Certain locations, particularly on the West Coast, experience more rainy days, which could be due to regional climate patterns.
2. What's the relationship between 'Humidity', 'Temperature', and 'Precipitation'?
Statistics
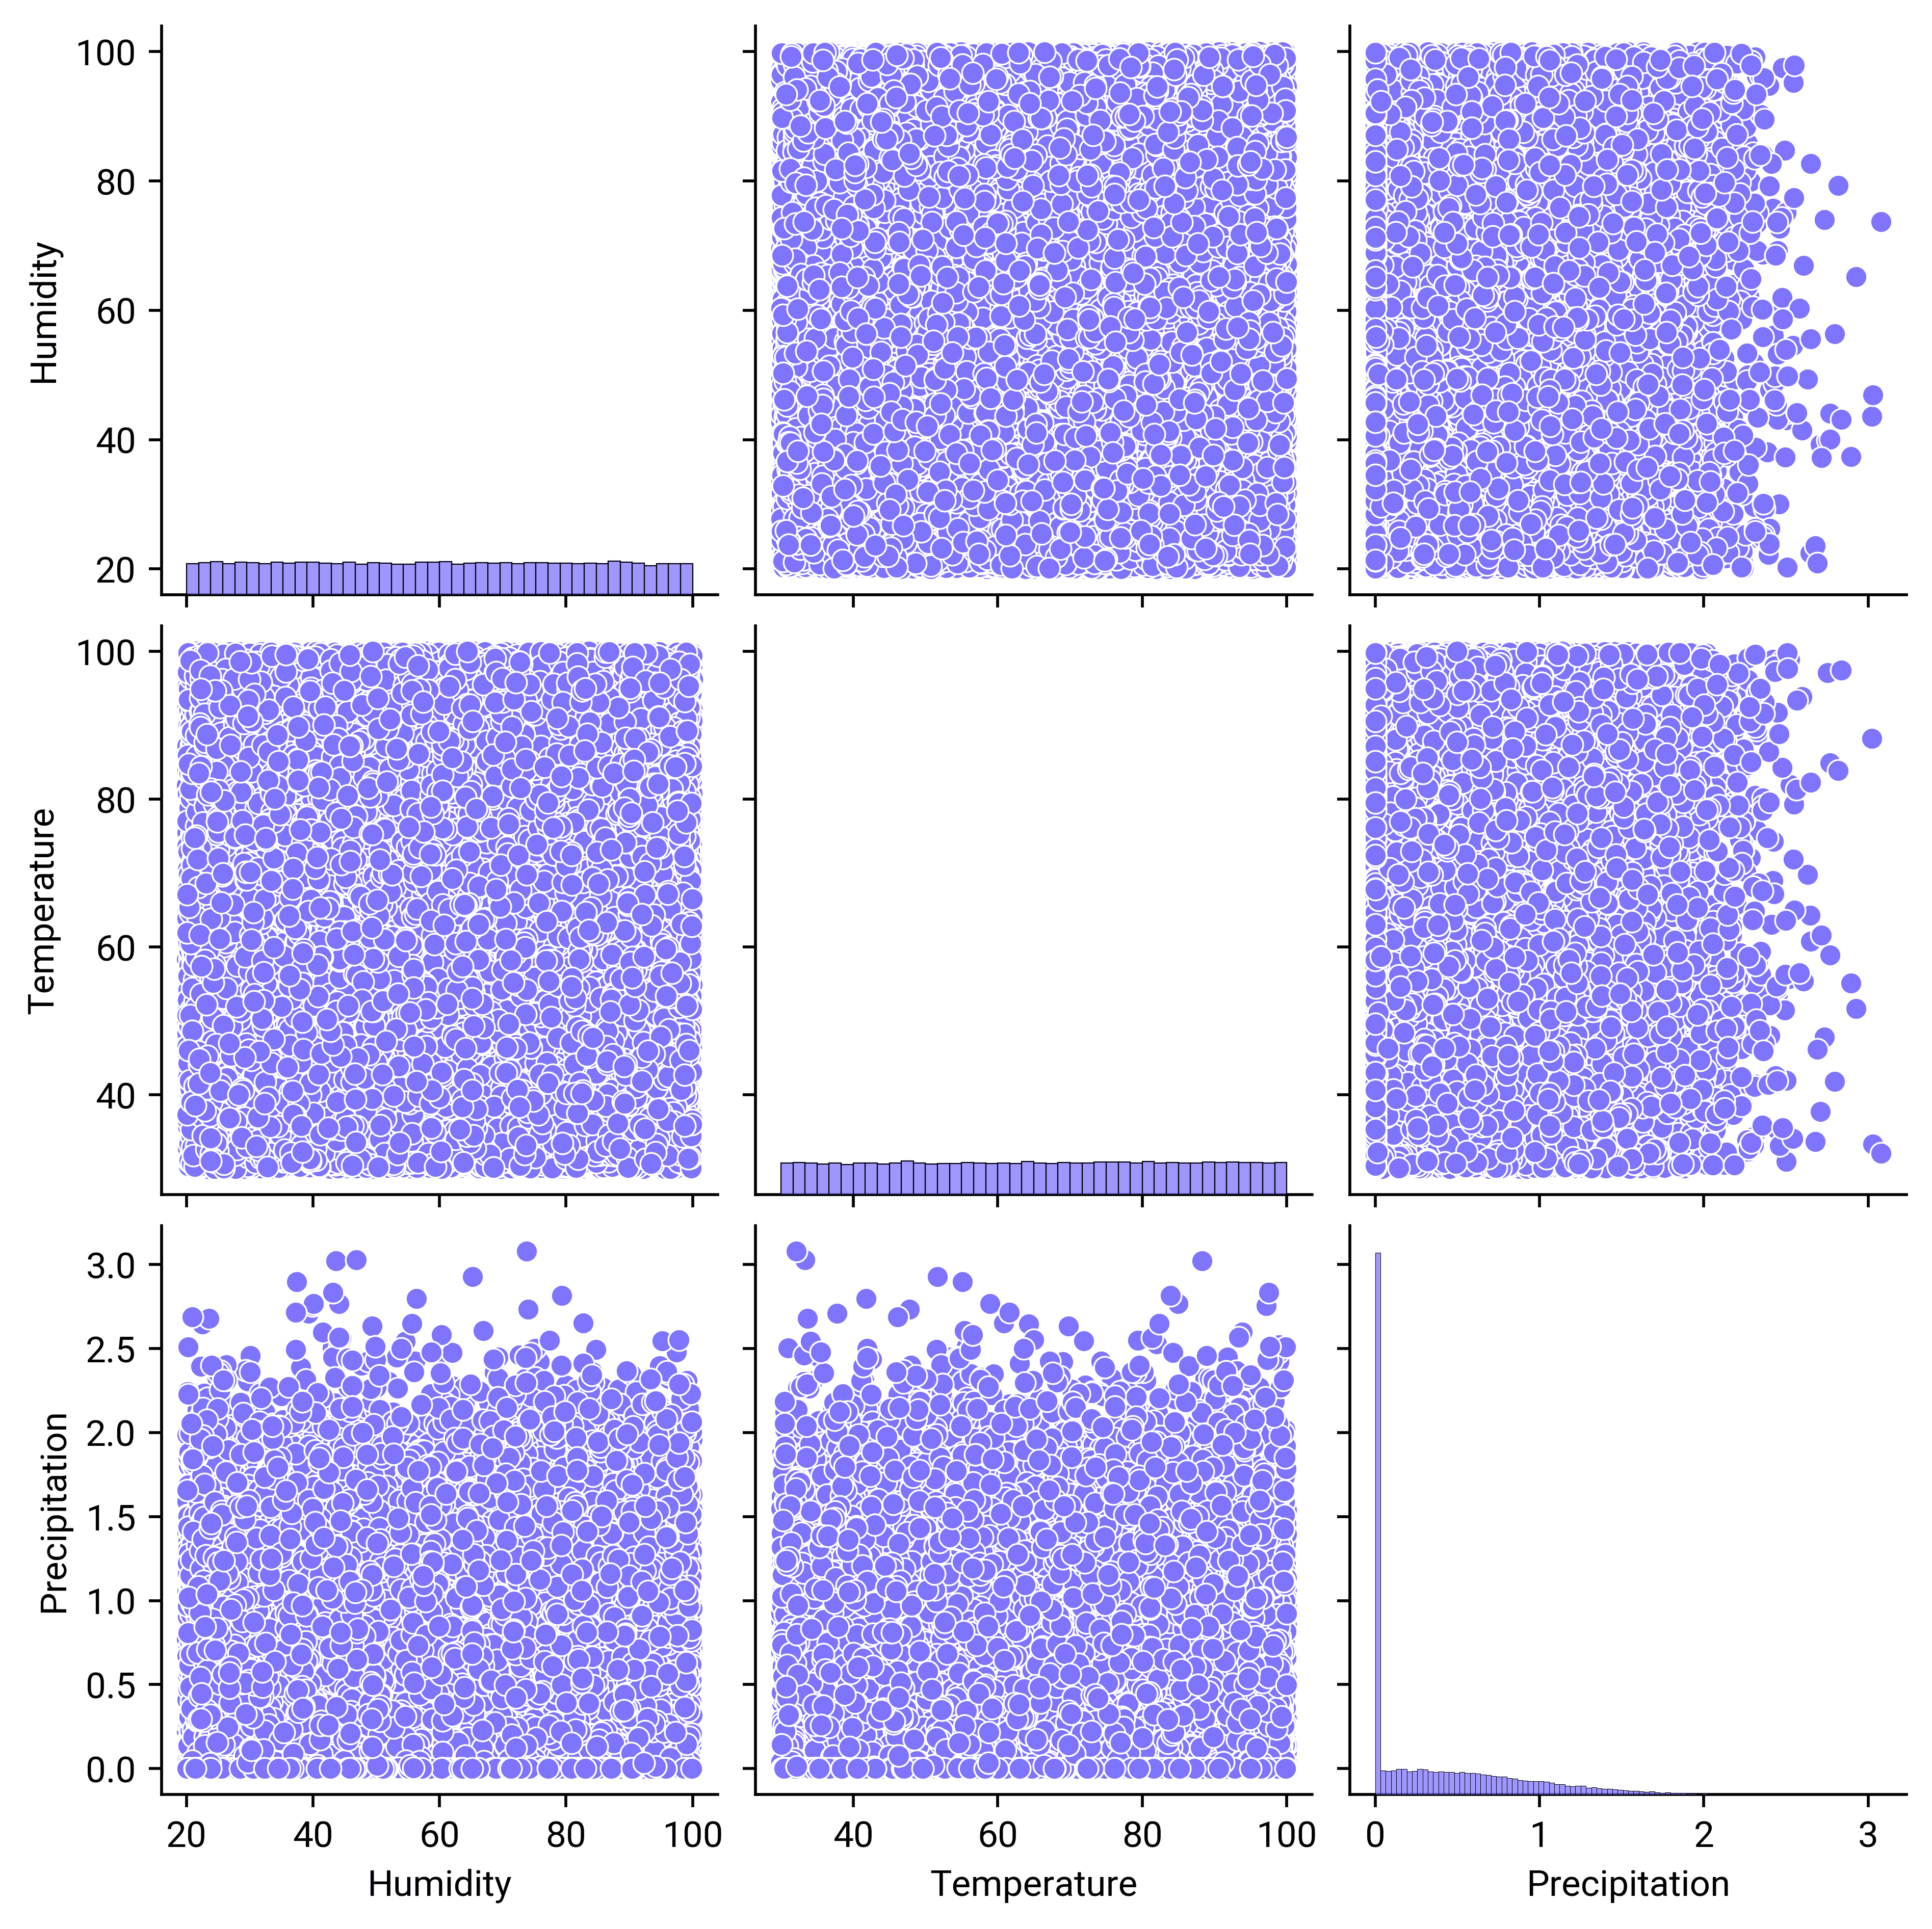
Humidity: Mean = 59.88, Std = 23.07, Min = 20.00, Max = 100.00
Temperature: Mean = 65.18, Std = 20.21, Min = 30.00, Max = 100.00
Precipitation: Mean = 0.39, Std = 0.47, Min = 0.00, Max = 3.08
Pairplot Analysis
Observations
Humidity vs. Temperature: The scatter plot indicates a wide spread with no clear correlation.
Humidity vs. Precipitation: The data points are densely packed, showing no obvious trend.
Temperature vs. Precipitation: Similar to the other pairs, the points are widely distributed without a clear pattern.
Conclusion and Insights
Data Distribution: The variables are widely distributed, with no strong linear relationships evident from the pairplot.
Further Analysis: Additional statistical methods may be needed to uncover any hidden patterns or correlations.
3. What is the distribution of cloud cover percentages across various locations?
Data Analysis
Mean Cloud Cover: The average cloud cover percentage across locations is approximately 54.94%, with a standard deviation of 0.30%. The values range from a minimum of 54.10% to a maximum of 55.37%.
Standard Deviation: The standard deviation of cloud cover percentages is around 25.98%, indicating variability in cloud cover across different locations.
Visualization Insights
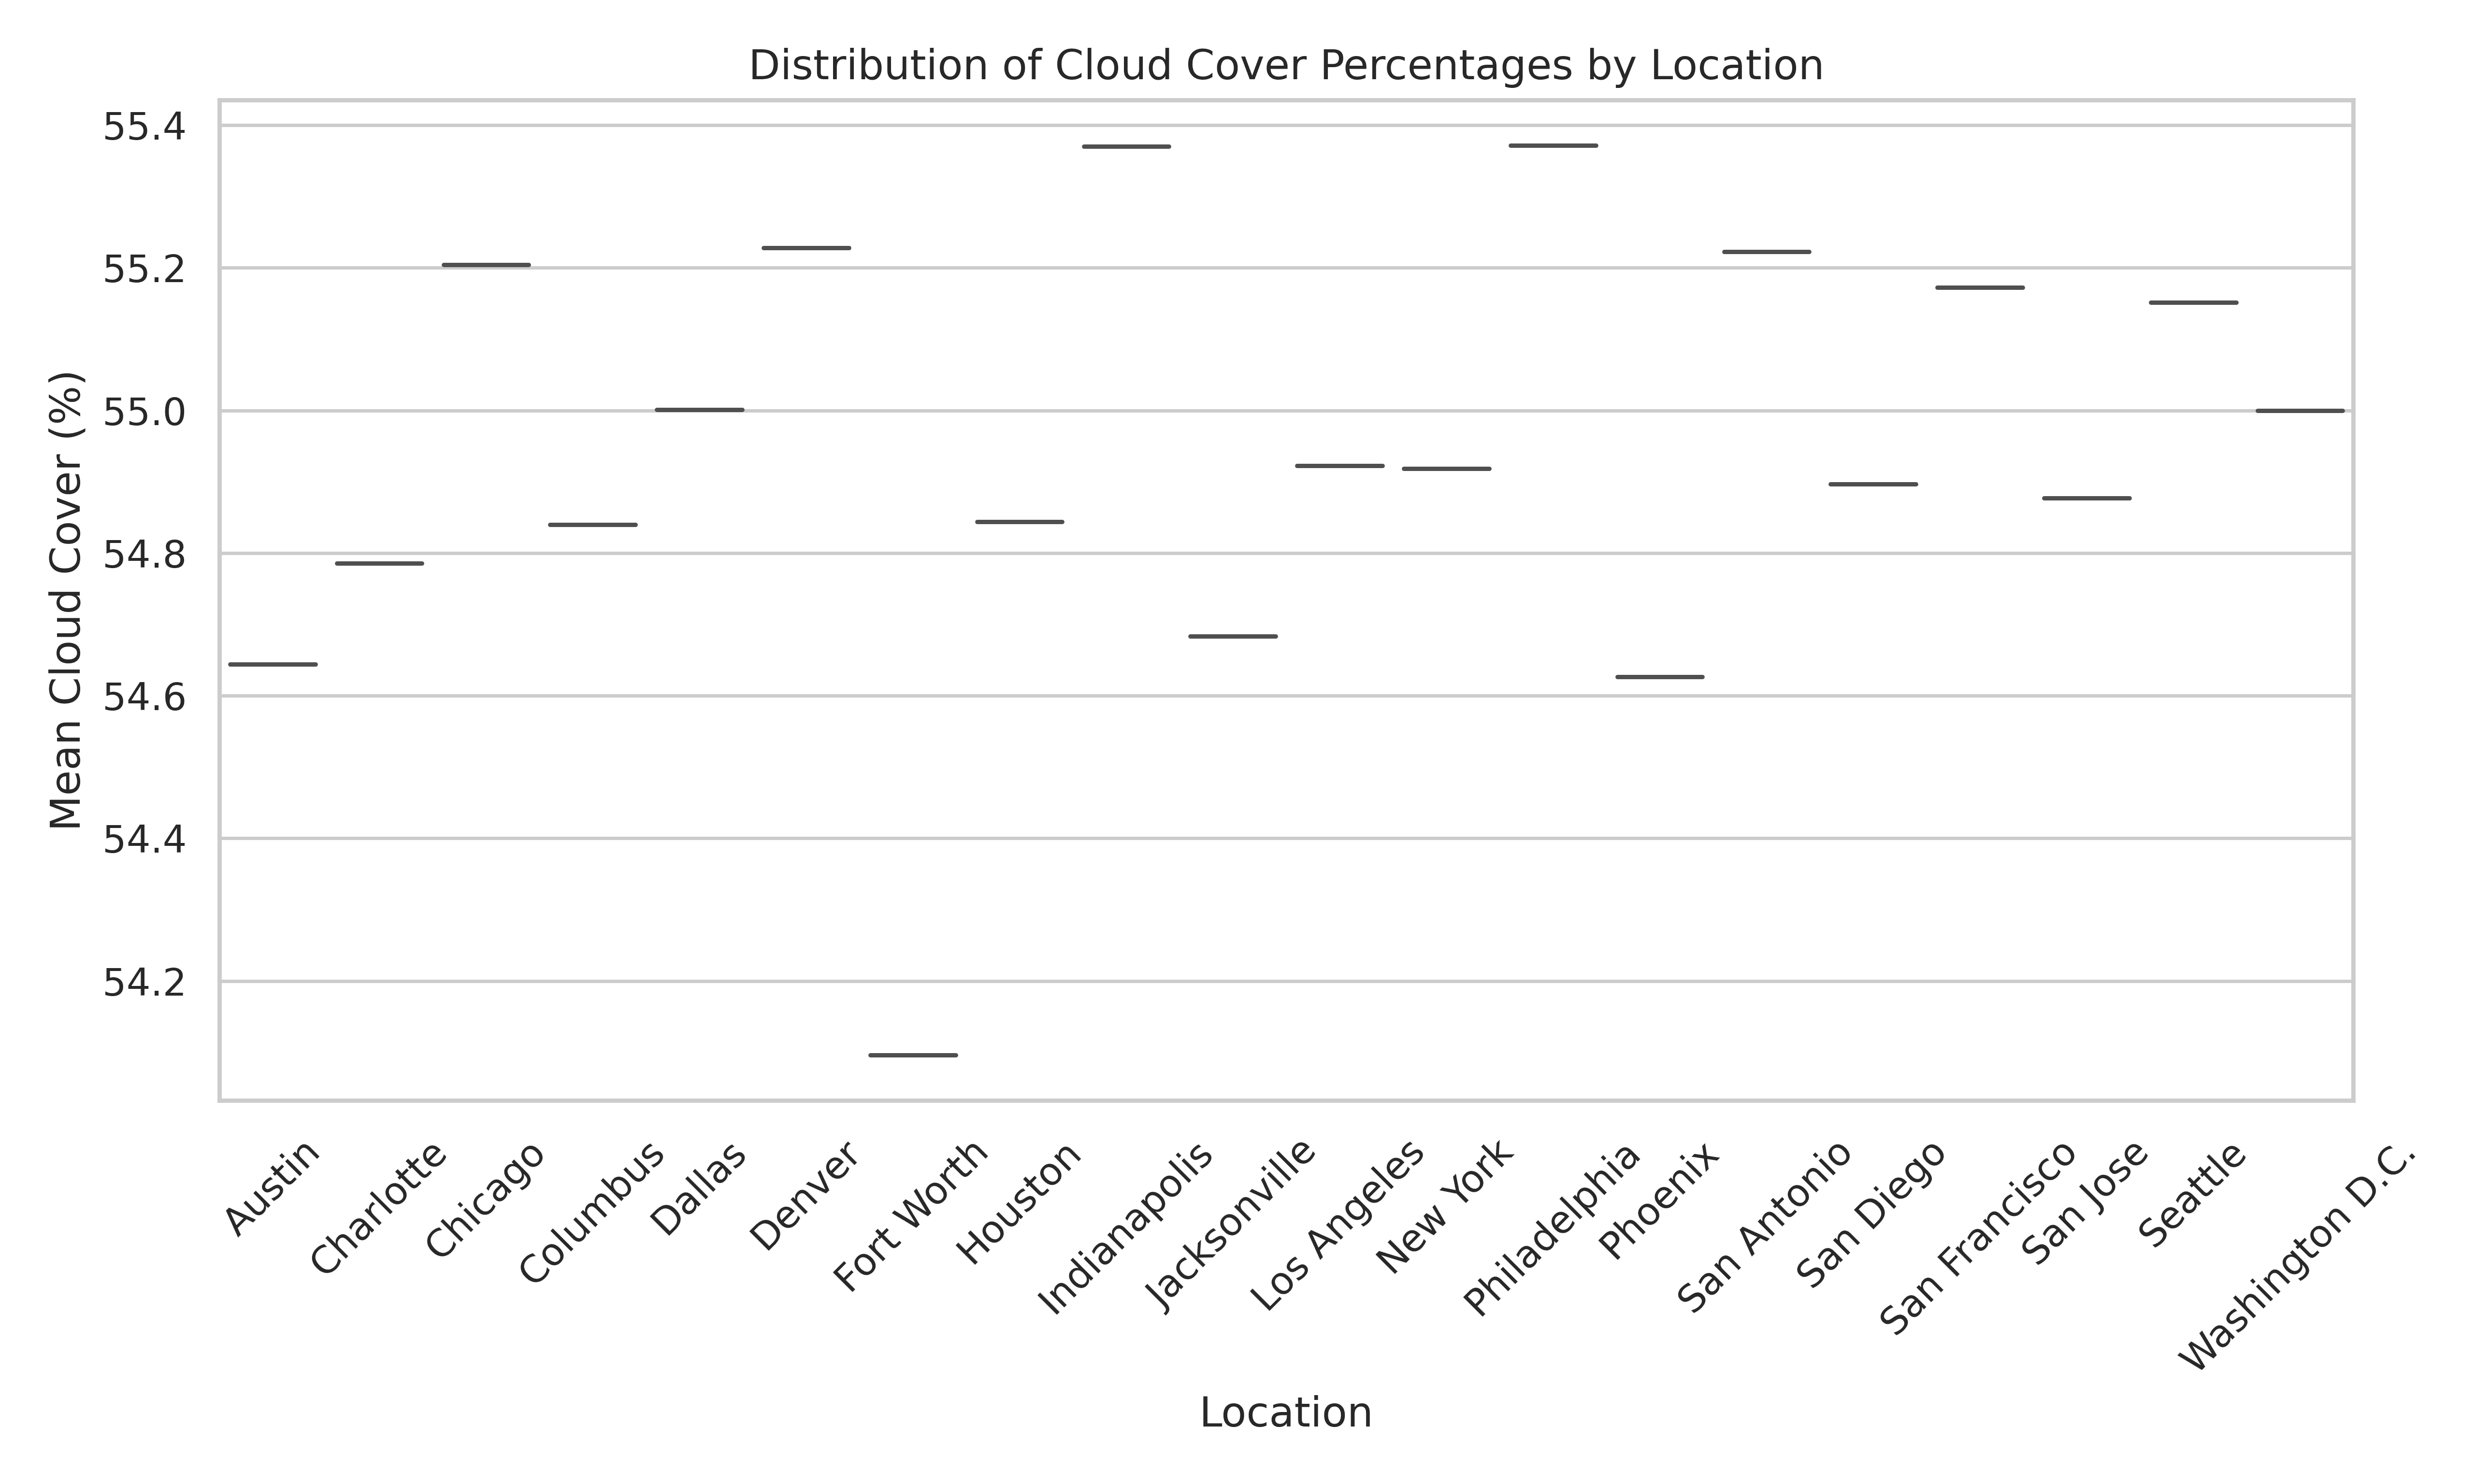
Spread and Central Tendency: The box plot shows the distribution of mean cloud cover percentages for each location. Most locations have mean values clustered around 54.5% to 55.2%.
Variability: The plot indicates slight variations in cloud cover percentages, with some locations having slightly higher or lower averages.
Conclusion and Insights
Consistent Cloud Cover: The mean cloud cover percentages are relatively consistent across locations, with minor variations.
Potential Influences: The slight differences in cloud cover could be influenced by geographical and climatic factors specific to each location.
4. Investigate the impact of wind speed on precipitation levels and the likelihood of rain, and compare these findings with the influence of cloud cover.
Wind Speed and Precipitation
Correlation: The data shows a weak correlation between wind speed and average precipitation, suggesting minimal impact.
Data Characteristics: The average precipitation has a mean of 0.39 with a standard deviation of 0.47, indicating variability in precipitation levels.
Wind Speed and Likelihood of Rain
Correlation: The likelihood of rain tomorrow shows a weak relationship with wind speed.
Data Characteristics: The likelihood of rain has a mean of 0.22, indicating a low probability of rain on average.
Cloud Cover and Precipitation
Correlation: Cloud cover shows a stronger correlation with average precipitation compared to wind speed.
Data Characteristics: Similar variability in precipitation levels as seen with wind speed.
Cloud Cover and Likelihood of Rain
Correlation: There is a more noticeable relationship between cloud cover and the probability of rain tomorrow.
Data Characteristics: The probability of rain has a mean of 0.22, similar to the wind speed data.
Visual Comparison
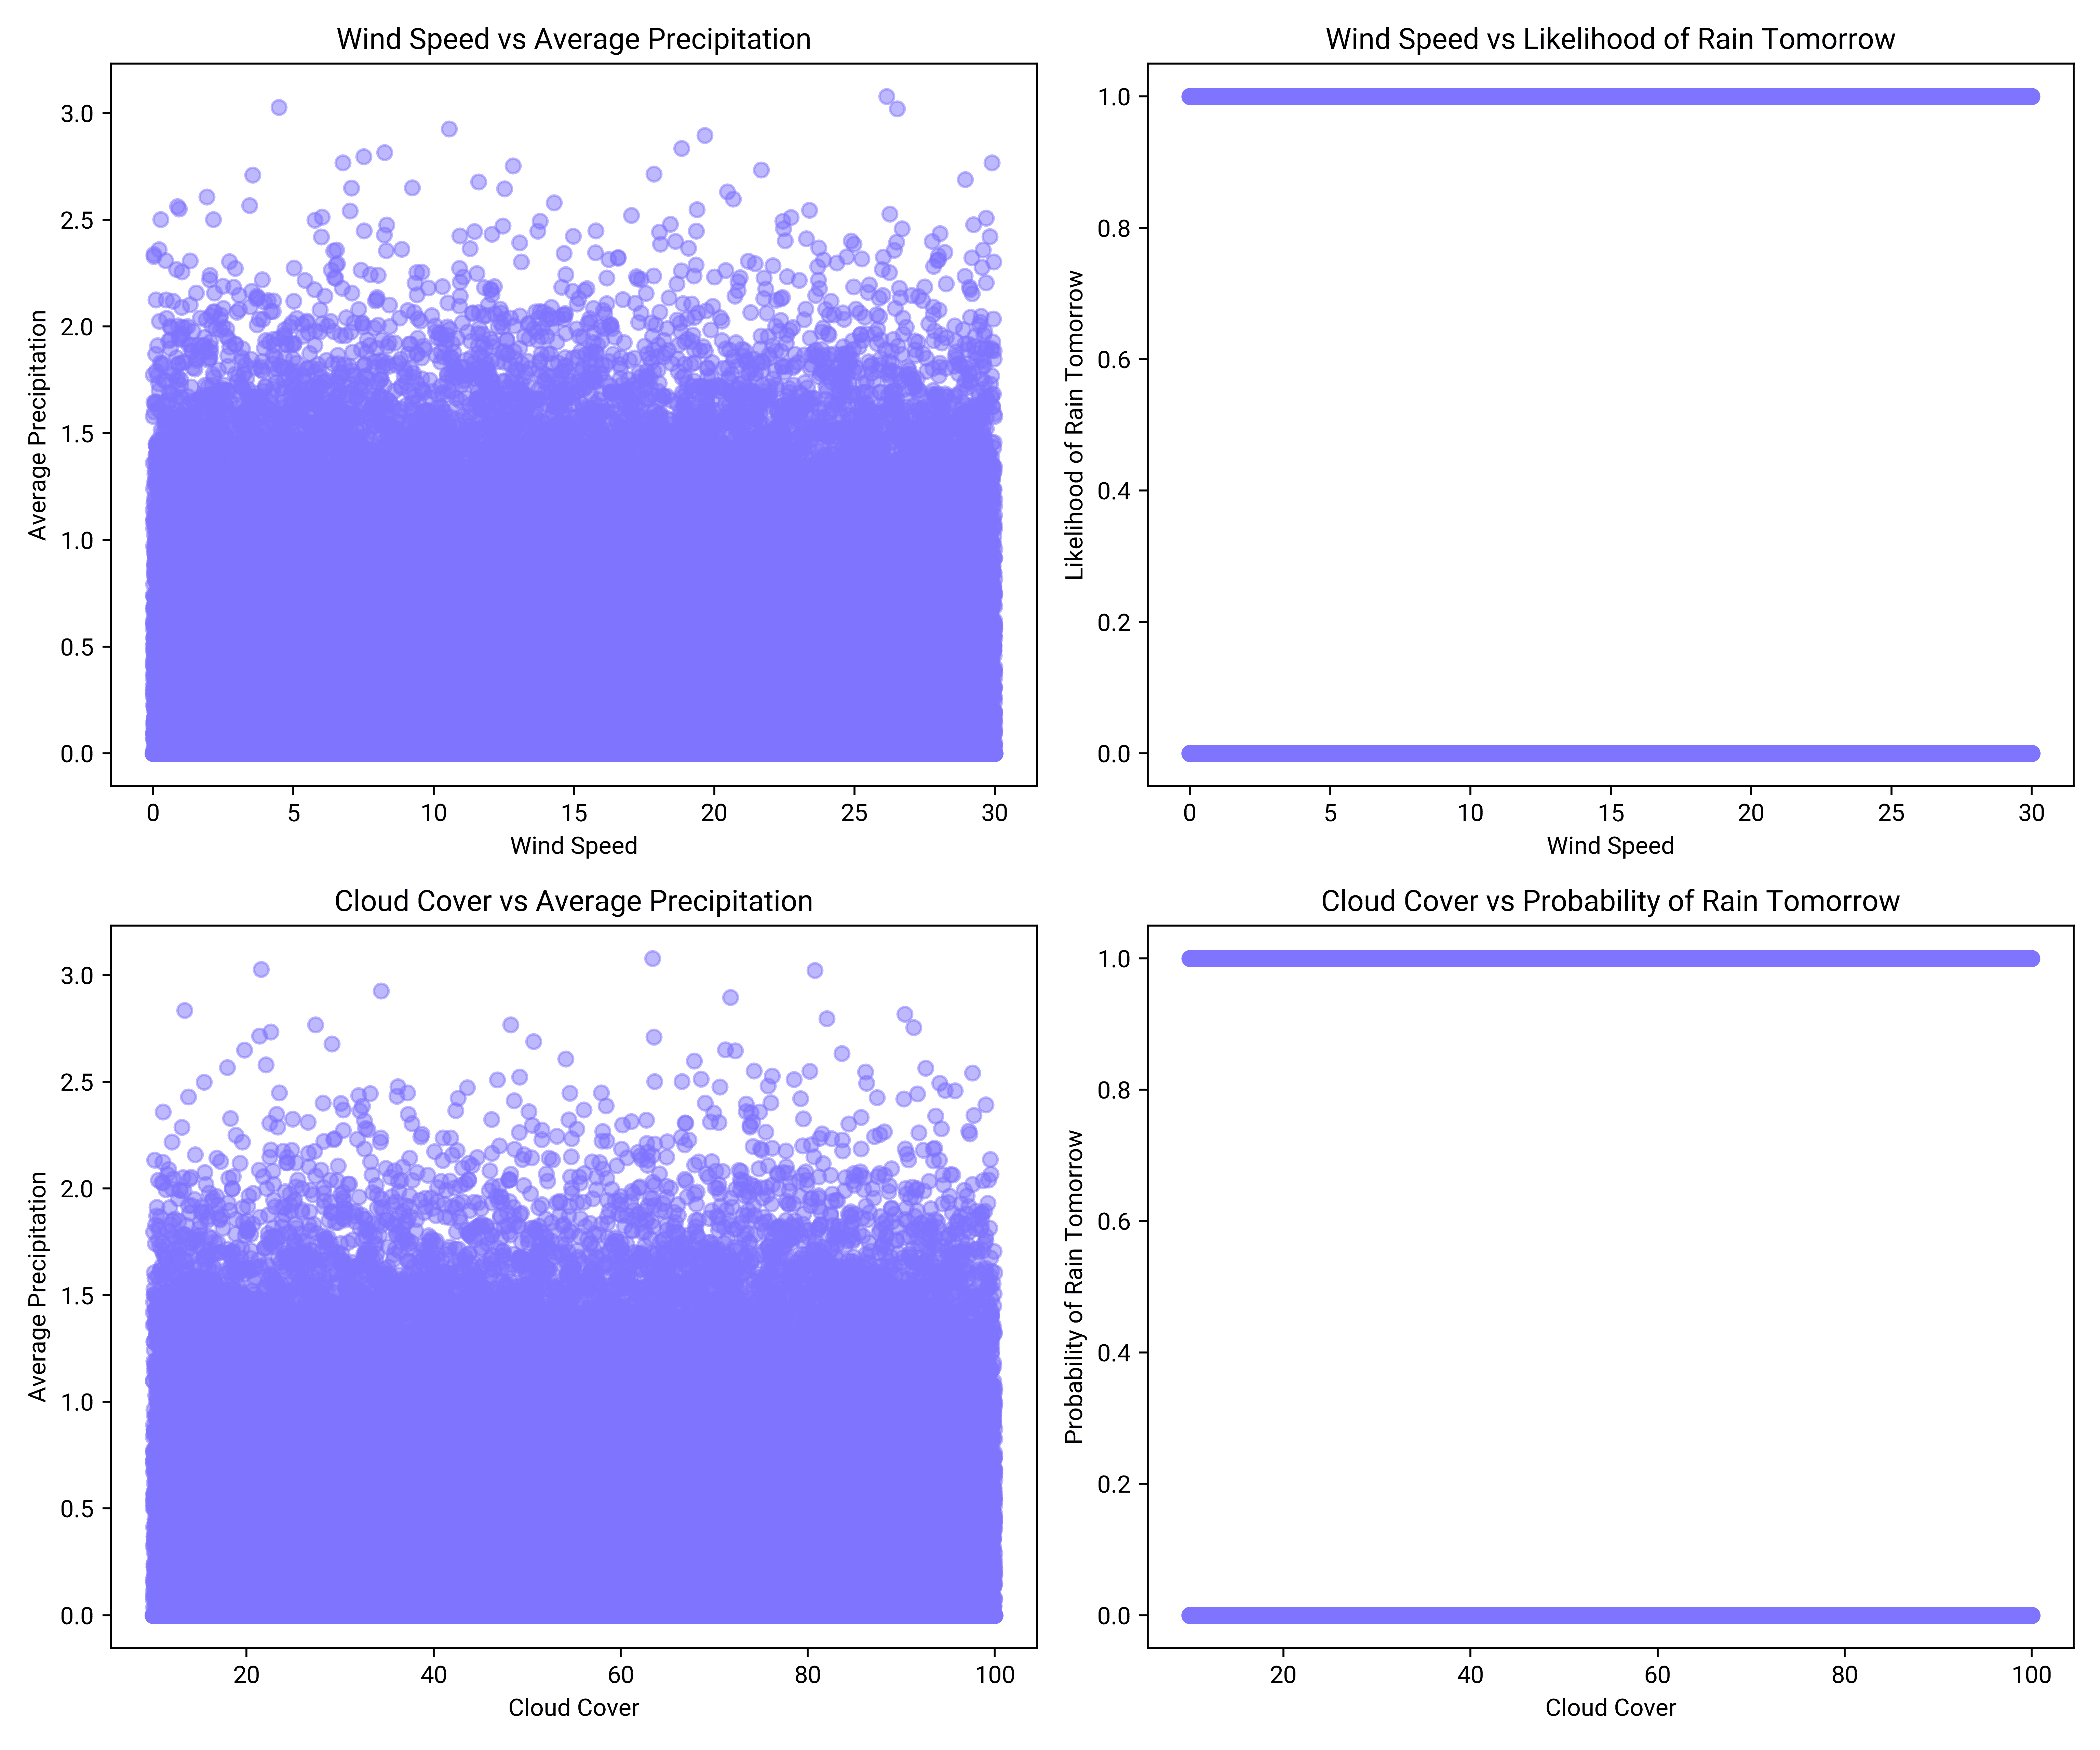
Wind Speed vs. Precipitation: The scatter plot shows a dispersed pattern, indicating a weak relationship.
Wind Speed vs. Rain Likelihood: The plot shows a concentration of points at 0 and 1, indicating a binary outcome with weak correlation.
Cloud Cover vs. Precipitation: The scatter plot suggests a stronger relationship compared to wind speed.
Cloud Cover vs. Rain Likelihood: Similar to wind speed, but with a slightly stronger correlation.
Conclusion and Insights
Wind Speed Impact: Wind speed has a minimal impact on both precipitation levels and the likelihood of rain.
Cloud Cover Impact: Cloud cover has a more significant influence on precipitation levels and the likelihood of rain compared to wind speed
5. How does the average temperature vary between the months of 2024 and 2025?
Monthly Temperature Differences
Mean Temperature Difference: The average temperature difference between the months of 2024 and 2025 is 0.15°C.
Standard Deviation: The standard deviation of the temperature differences is 0.47°C, indicating some variability in the monthly differences.
Maximum and Minimum Differences: The maximum temperature difference observed is 0.62°C, while the minimum is -0.94°C.
Detailed Monthly Analysis
January: The temperature difference is 0.53°C.
February: The temperature difference is 0.28°C.
March: The temperature difference is 0.44°C.
April: The temperature difference is 0.62°C, the highest among all months.
May: The temperature difference is -0.03°C, indicating a slight decrease.
June: The temperature difference is 0.02°C.
July: The temperature difference is -0.48°C, indicating a significant decrease.
August: The temperature difference is 0.55°C.
September: The temperature difference is 0.39°C.
October: The temperature difference is 0.46°C.
November: The temperature difference is -0.05°C.
December: The temperature difference is -0.94°C, the lowest among all months.
Conclusion and Insights
Overall Variation: There is a noticeable variation in average temperatures between the months of 2024 and 2025, with some months experiencing increases and others decreases.
Significant Changes: April and December show the most significant changes, with April having the highest increase and December the largest decrease in temperature.
6. Are there any noticeable patterns in pressure changes that could indicate weather anomalies?
Anomaly Count Analysis
High Anomaly Counts: Charlotte (148) and Chicago (138) have the highest anomaly counts, indicating potential significant deviations in pressure changes that could suggest unusual weather patterns.
Low Anomaly Counts: Columbus (108) and Seattle (111) have the lowest anomaly counts, suggesting fewer deviations and potentially more stable weather conditions.
Mean and Standard Deviation: The mean anomaly count is 124.35 with a standard deviation of 10.97, indicating a moderate spread in the anomaly counts across different locations.
Conclusion and Insights
Significant Deviations: Locations with anomaly counts significantly higher than the mean, such as Charlotte and Chicago, may be experiencing unusual weather patterns due to pressure changes.
Stability Indicators: Locations with lower anomaly counts, like Columbus and Seattle, might indicate more stable weather conditions with fewer pressure-related anomalies.
7. ROC Curve Analysis
Features Selected: The dataset includes features such as Temperature, Humidity, Wind Speed, Precipitation, Cloud Cover, and Pressure.
Target Variable: The target variable for this ROC curve analysis is 'Rain Tomorrow'.
ROC Curve Insights
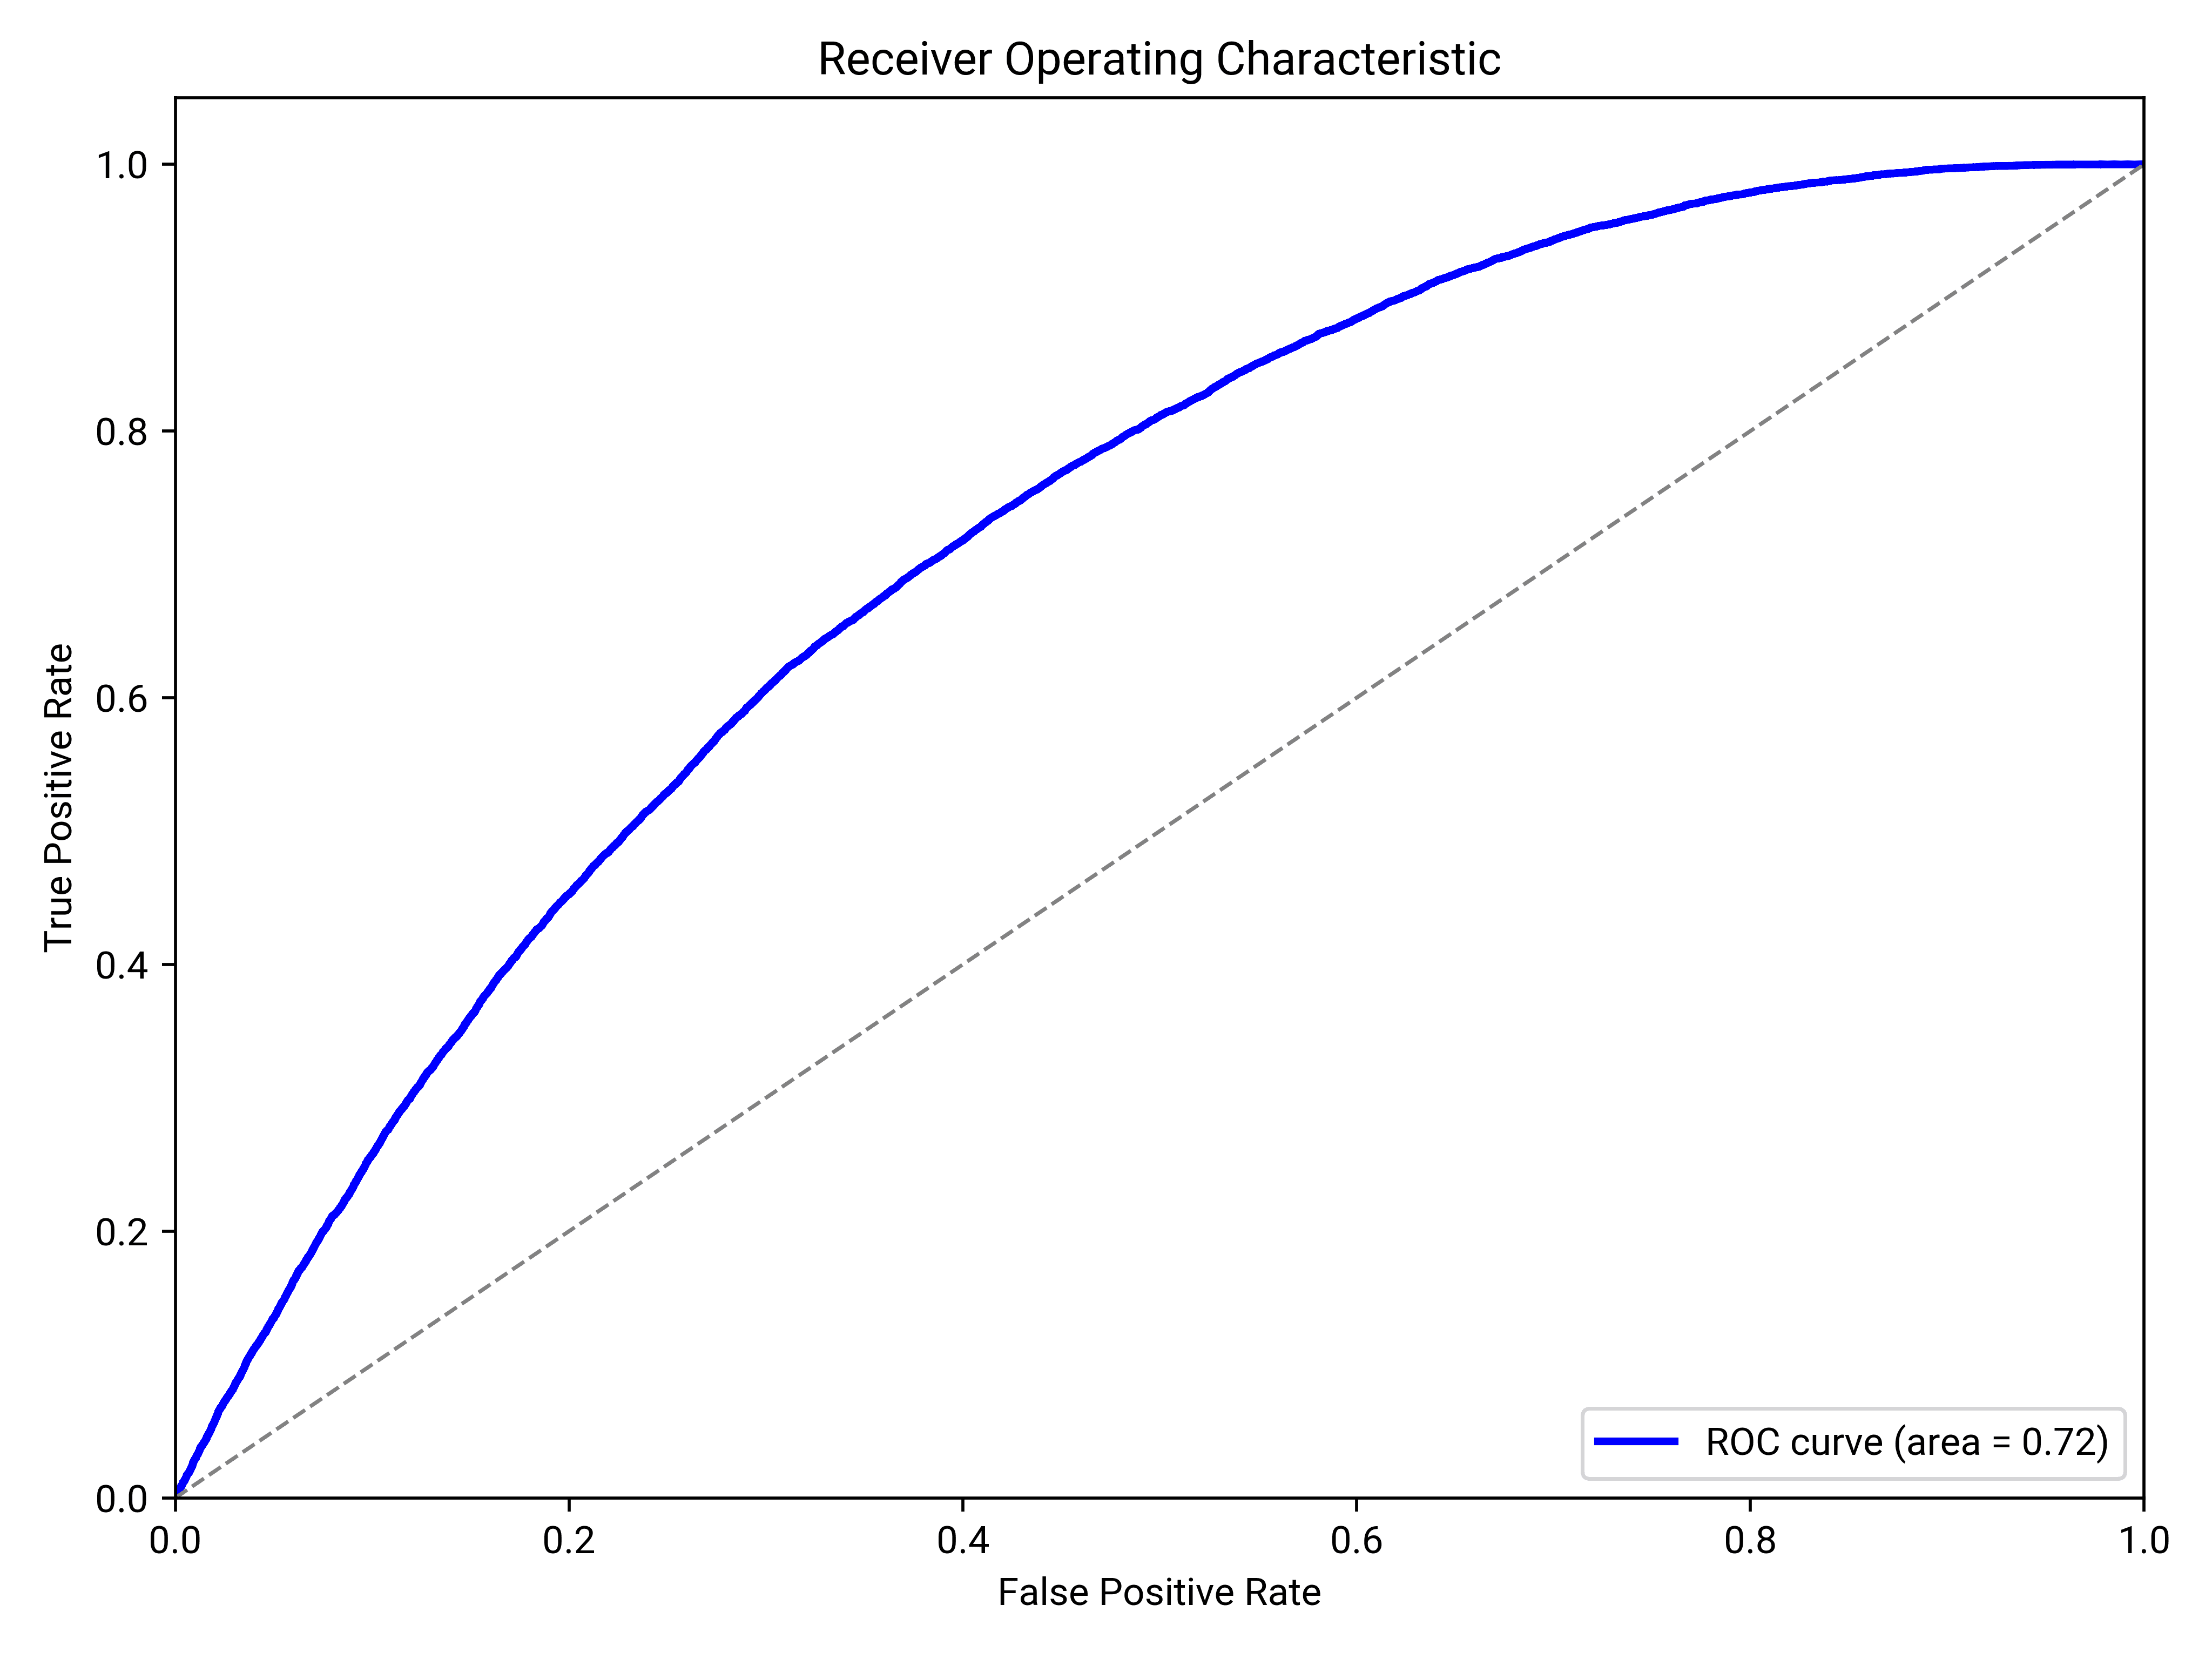
ROC Curve Description: The ROC curve illustrates the performance of a binary classifier in predicting 'Rain Tomorrow'.
Area Under Curve (AUC): The AUC is 0.72, indicating a moderate level of predictive accuracy.
Conclusion and Insights
Predictive Performance: The classifier shows a moderate ability to distinguish between days with and without rain tomorrow.
Feature Impact: The selected features contribute to the model's ability to predict the target variable, as reflected in the ROC curve.
Conclusion
The analysis of rainfall predictions for 2024-2025 reveals several key insights. Rainfall distribution is relatively consistent across the United States, with some variability driven by location-specific climate factors, such as those influencing cloud cover and temperature. While cloud cover shows a stronger correlation with rainfall, wind speed appears to have minimal impact. Additionally, temperature variations between 2024 and 2025 highlight regional differences that may affect future weather patterns. Overall, while the predictive models provide moderate accuracy, further analysis and more advanced statistical approaches will be needed to refine these predictions and better anticipate future rainfall trends.
Try Powerdrill AI now, explore more exciting data stories in an effective way!