Data Facts of the Olympic Games in the History

Paris Olympic Games is coming soon. Back to 2 years ago, those are some fact and figures talking about the Tokyo Olympic Games.
Powerdrill AI has connected to Data.World, which has the most fresh data about the Olympic Games. With the AI data analysis in Powerdrill for this Olympic dataset, let's take a look at the data fact of the Olympic Games in the history.
Given the dataset, Powerdrill AI detects and analyzes the metadata, then gives these relevant inquiries:
Athlete Demographics and Performance:
What is the average age, height, and weight of athletes who have won medals?
How do these demographics vary between different sports or events?
NOC and Regional Analysis:
Which NOCs have the highest number of participating athletes?
How do different regions perform in terms of medal counts?
Historical Trends:
How has the average age of athletes changed over the years?
What are the trends in the number of participating athletes over different Olympic Games?
Gender Analysis:
What is the distribution of male and female athletes across different sports?
How does the medal count compare between male and female athletes?
Event-Specific Insights:
Which events have the highest number of participants?
What are the most common sports for medal winners?
Seasonal Comparisons:
How do the Summer and Winter Olympics compare in terms of athlete demographics and medal distribution?
City and Host Analysis:
Which host cities have seen the highest number of records or notable performances?
How does the performance of athletes vary by host city?
Medal Distribution:
What is the distribution of gold, silver, and bronze medals across different NOCs and regions?
Are there any regions or NOCs that specialize in certain sports or events?
These inquiries can help in understanding various aspects of the Olympic Games, from athlete demographics to regional performance and historical trends.
Then for each the of inquiries, Powerdrill AI can automatically generate Python code to analyze the dataset, and then give the answer.
1. Athlete Demographics and Performance:
What is the average age, height, and weight of athletes who have won medals?
Ultimate Conclusion:
Average Age of Medal-Winning Athletes: 25.93 years
Average Height of Medal-Winning Athletes: 177.55 cm
Average Weight of Medal-Winning Athletes: 73.77 kg
These statistics provide a snapshot of the physical attributes of successful athletes in their respective sports.
How do these demographics vary between different sports or events?
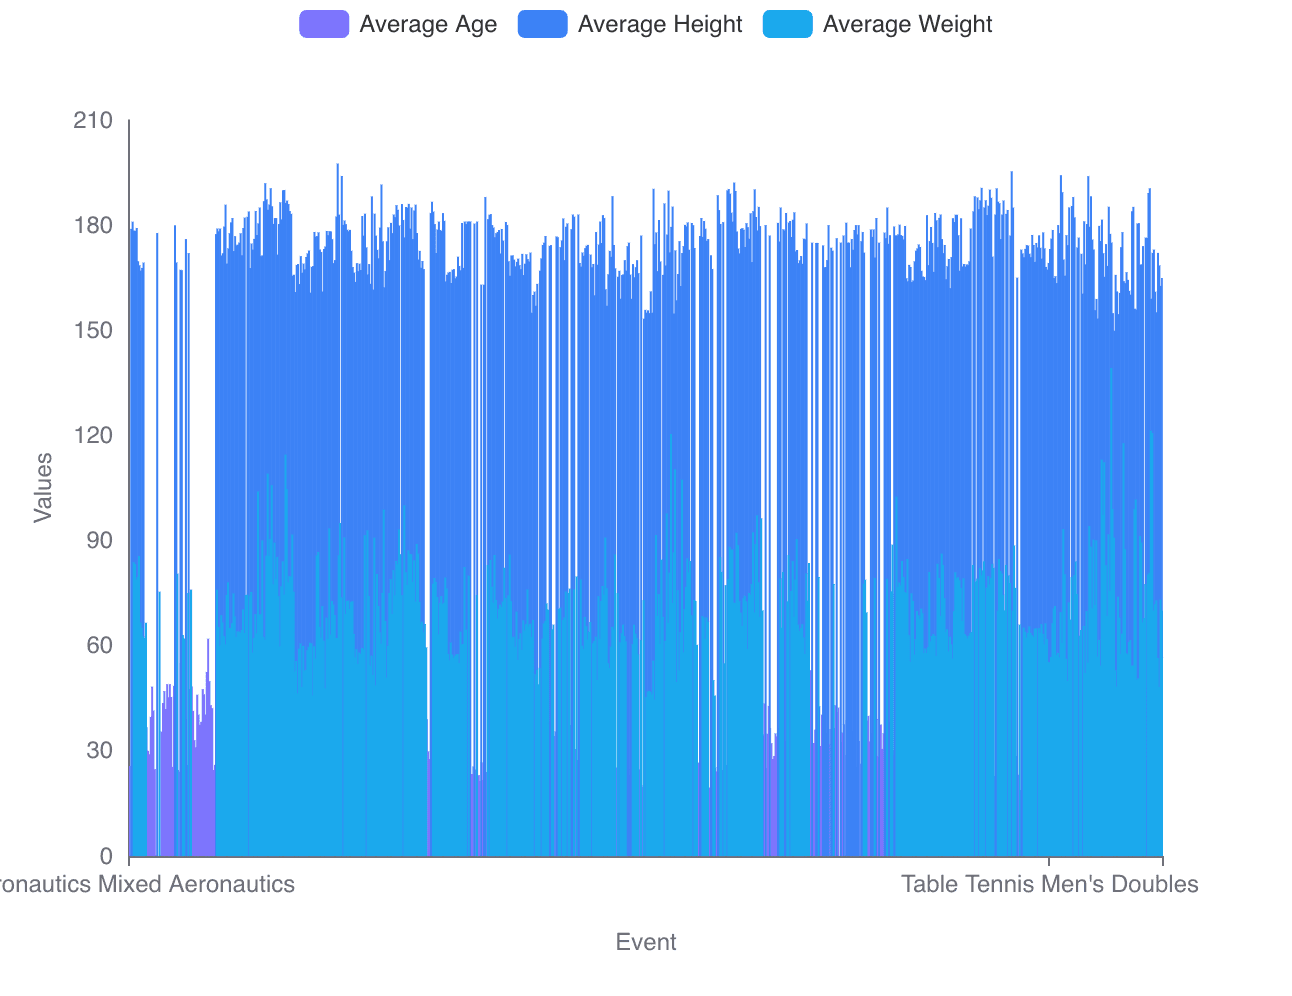
Based on the provided context and the task description, we can draw the following conclusions about the demographics of athletes who have won medals in various sports and events:
Average Age: Athletes who have won medals have an average age of approximately 27.69 years. The youngest average age recorded is 17.33 years, and the oldest is 62.00 years. This suggests a wide age range among successful athletes across different sports and events.
Average Height: The average height of medal-winning athletes is around 174.91 cm. Heights range from a minimum average of 149.87 cm to a maximum average of 197.56 cm. This indicates significant height diversity depending on the sport or event.
Average Weight: The average weight for these athletes is 71.41 kg, with a standard deviation of 13.29 kg. The lightest average weight is 44.58 kg, and the heaviest is 139.19 kg. Weight classes vary widely, reflecting the different physical demands of each sport or event.
The visualized data in the form of a bar chart or box plot (as requested by the user) would provide a clear graphical representation of these demographics, allowing for easy comparison between sports and events. However, the provided image is too dense to discern individual sports or events clearly. A more refined visualization, perhaps focusing on a subset of sports or using separate charts for each demographic, would be more informative.
The filtered dataset contains detailed records for 39,783 athletes who have won medals, including their sport, event, age, height, weight, and the type of medal won. This dataset can be used for further analysis or to create more specific visualizations as needed.
2.NOC and Regional Analysis:
Which NOCs have the highest number of participating athletes?
Top Participating NOCs: The analysis of the 'NOC' column in the athlete events dataset reveals that the National Olympic Committees with the highest number of participating athletes are:
USA: with a total of 18,853 athletes.
FRA (France): with a total of 12,758 athletes.
GBR (Great Britain): with a total of 12,256 athletes.
ITA (Italy): with a total of 10,715 athletes.
GER (Germany): with a total of 9,830 athletes.
Statistical Overview: The dataset contains information on 230 NOCs. The average number of athletes per NOC is 1,178.77, with a standard deviation of 2,503.28. The NOC with the minimum number of athletes has 1 athlete, while the NOC with the maximum has 18,853 athletes.
Data Scope: The provided data details only include the top 5 NOCs, but the dataset contains a total of 230 NOCs. For a comprehensive list, additional data would be required.
How do different regions perform in terms of medal counts?
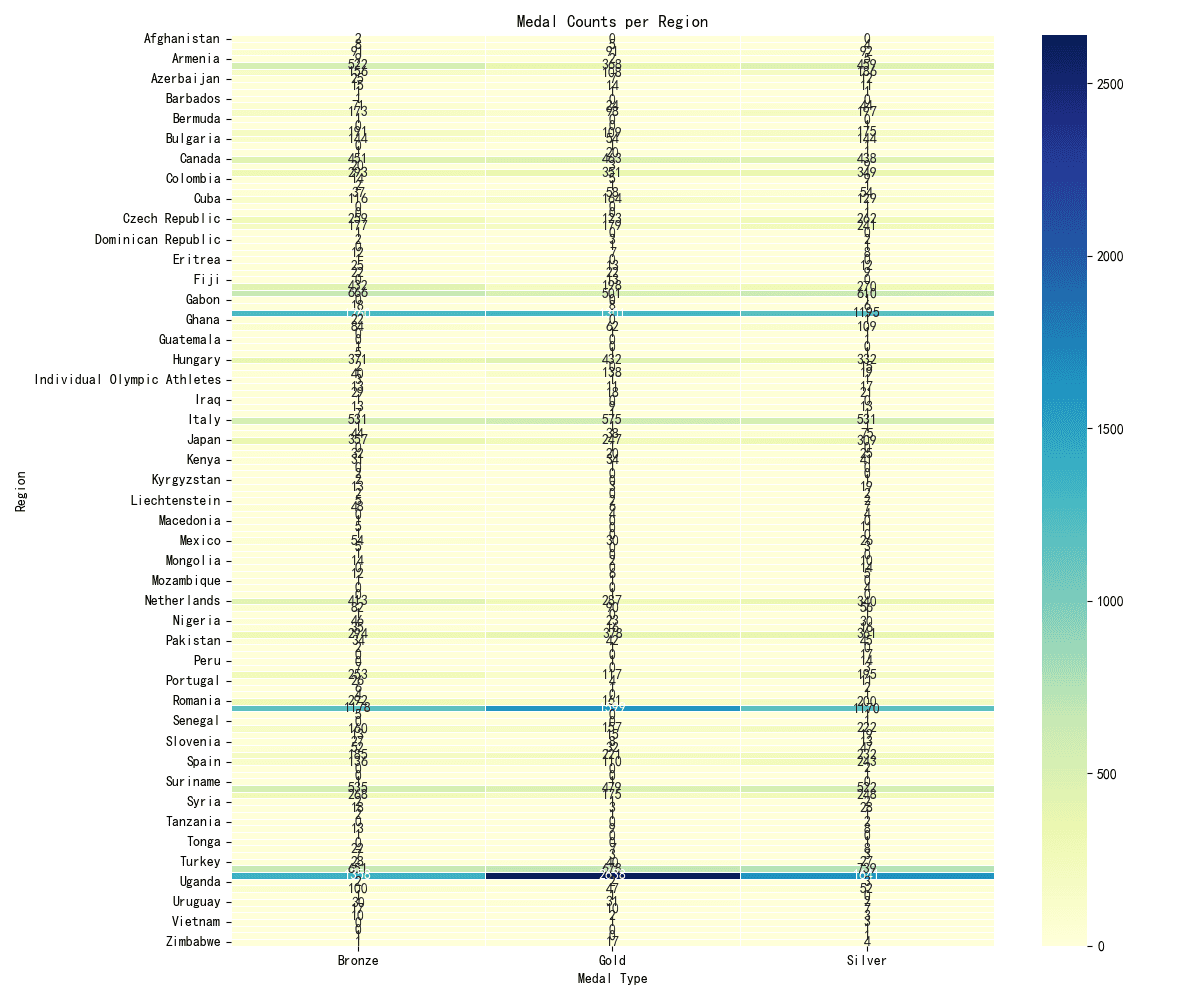
Key Observations from Data:
The mean medal count across all regions and sports is 30.50, with a standard deviation of 66.97.
The minimum number of medals for a region-sport combination is 1, while the maximum is 1080.
The top five entries in the dataset show regions such as Afghanistan and Algeria with medal counts ranging from 2 to 9 in sports like Taekwondo, Athletics, and Boxing.
3.Historical Trends:
How has the average age of athletes changed over the years?
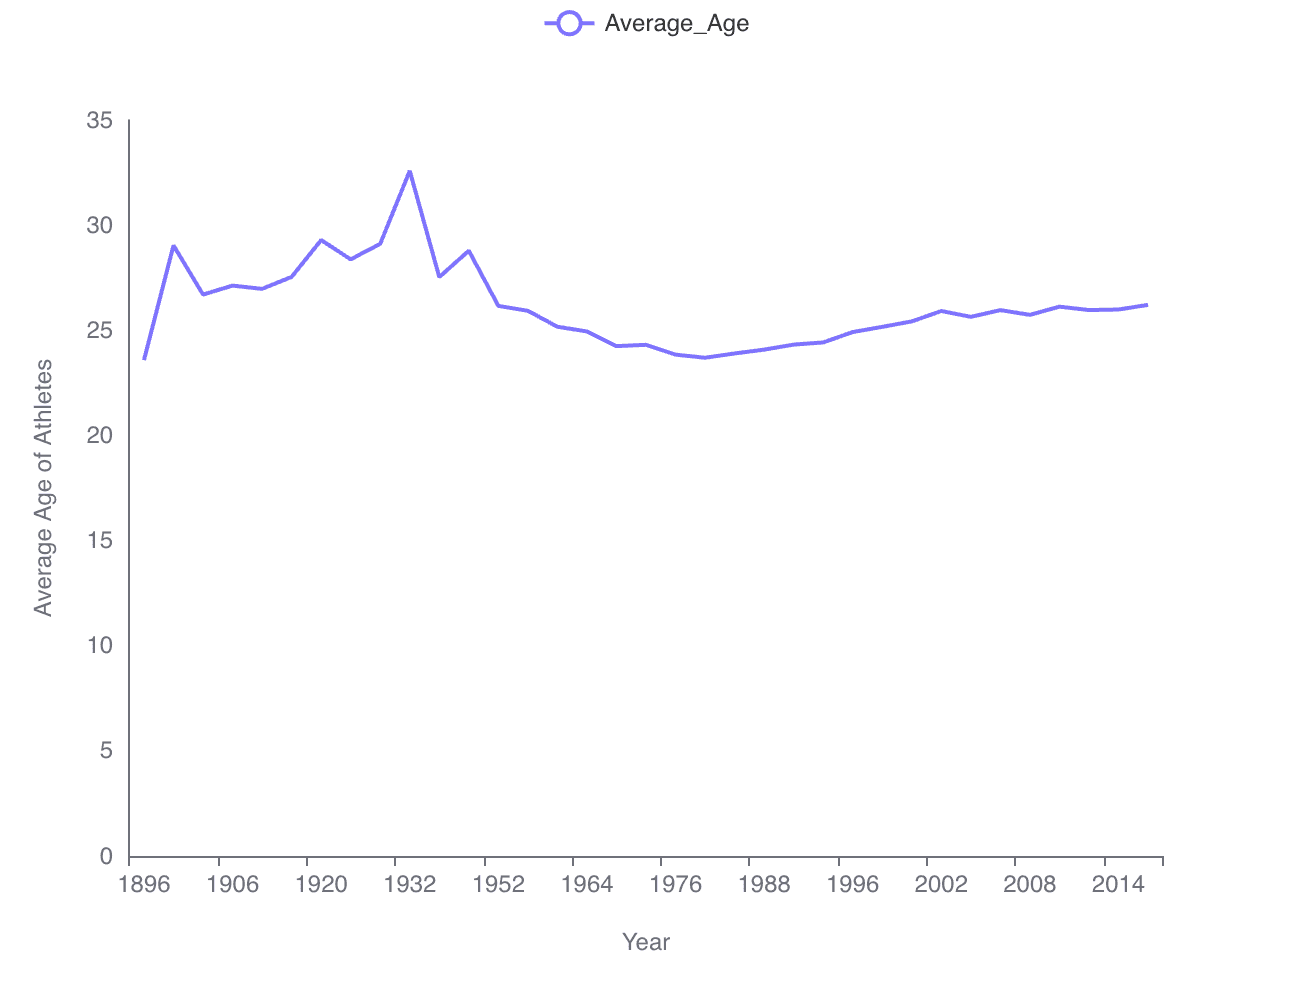
Trend Analysis: The line chart visualizes the change in the average age of athletes over the years. It shows a fluctuating trend with a significant peak and a general decline before a slight increase in recent years.
Historical Data: The earliest recorded average age in 1896 was 23.58 years. There was a notable peak around 1900 with an average age of 29.03 years.
Recent Trends: In more recent years, the average age appears to have stabilized somewhat, with a slight upward trend after reaching a low point.
Statistical Summary: The dataset spans from 1896 to 2016, with an overall mean average age of 26.13 years and a standard deviation of 1.98 years. The minimum and maximum average ages recorded are 23.58 years and 32.58 years, respectively.
Data Range: The dataset contains 35 data points, indicating that it may represent the average ages at Olympic Games or similar intervals.
Key Observations Emphasized:
Peak Average Age: 32.58 years (maximum)
Lowest Average Age: 23.58 years (minimum)
Overall Mean Average Age: 26.13 years
Recent Stabilization: Slight increase after the lowest point in the dataset
Visual Representation: The provided line chart effectively illustrates these trends and changes over the specified time period.
What are the trends in the number of participating athletes over different Olympic Games?
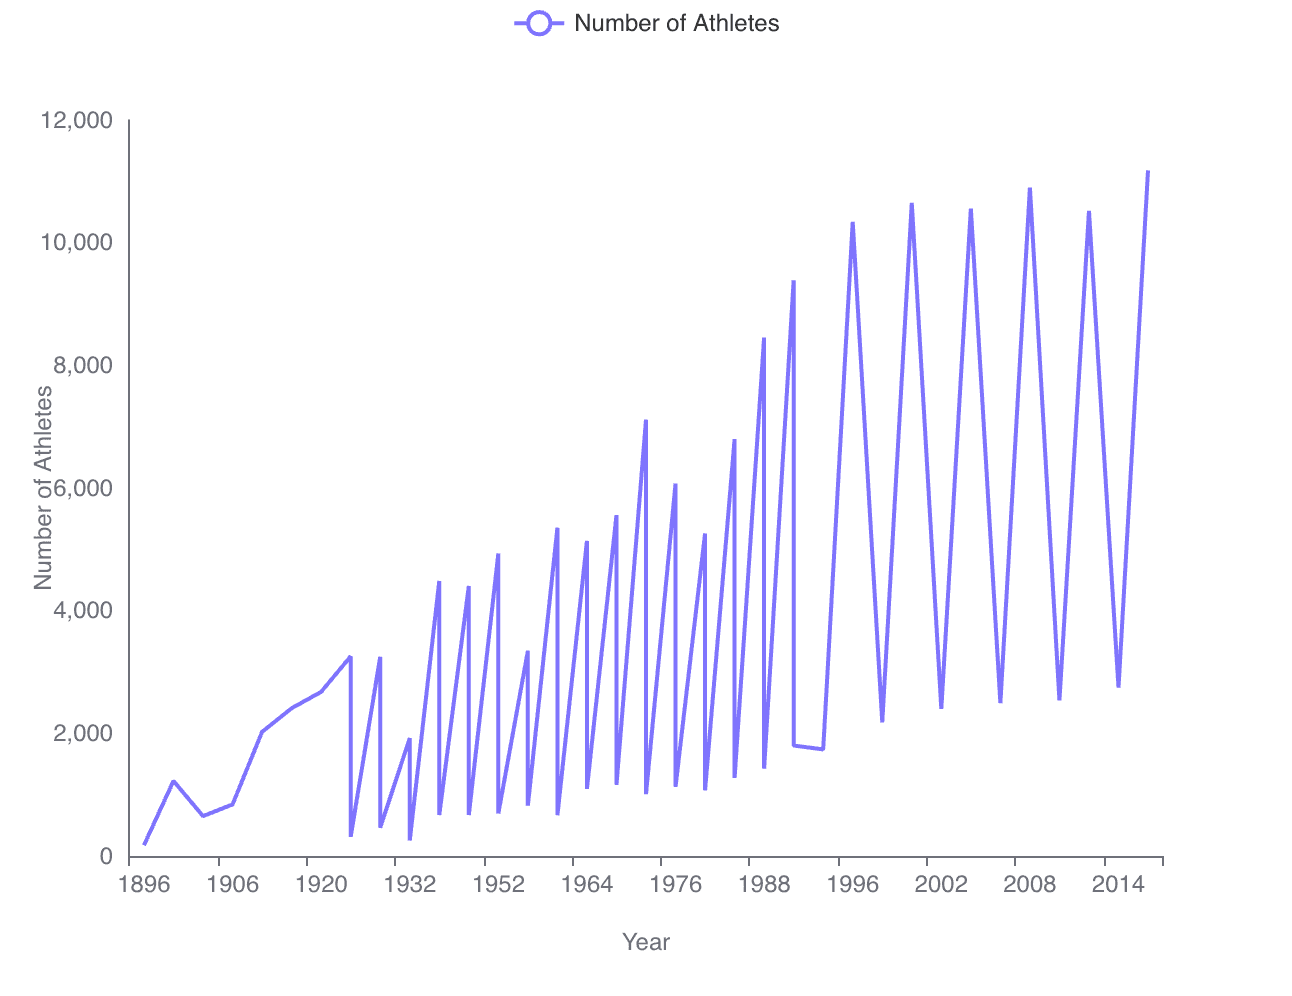
Trend Analysis:
The number of participating athletes in the Olympic Games has shown a general upward trend over the years.
There are noticeable fluctuations in the number of athletes, which could be attributed to various factors such as world events, the inclusion of new sports, or changes in the number of participating countries.
The line chart indicates that the growth in athlete participation is not linear, with some Olympic Games experiencing a significant increase in athletes, while others show a more modest rise or even a decrease.
Key Observations from Data:
The earliest recorded Games in 1896 had the fewest athletes (176).
The maximum number of athletes recorded was 11,179, although the specific year for this is not provided in the given data excerpt.
The average number of athletes participating in the Games is approximately 3,675.
Visual Data Insights:
The provided line chart visually supports the observation of an overall increase in athlete participation.
The chart also shows peaks and troughs, suggesting that certain editions of the Games were particularly large or small in scale.
Historical Context:
The variations in participation numbers may reflect historical contexts such as the two World Wars, which led to the cancellation of some Games, and the Cold War, which might have influenced the number of participating athletes due to boycotts.
Conclusion: The data and visual representation both confirm that the Olympic Games have generally become larger in terms of athlete participation over time, with a trend towards more athletes competing in each successive edition, albeit with some variability due to historical and organizational factors.
4.Gender Analysis:
What is the distribution of male and female athletes across different sports?
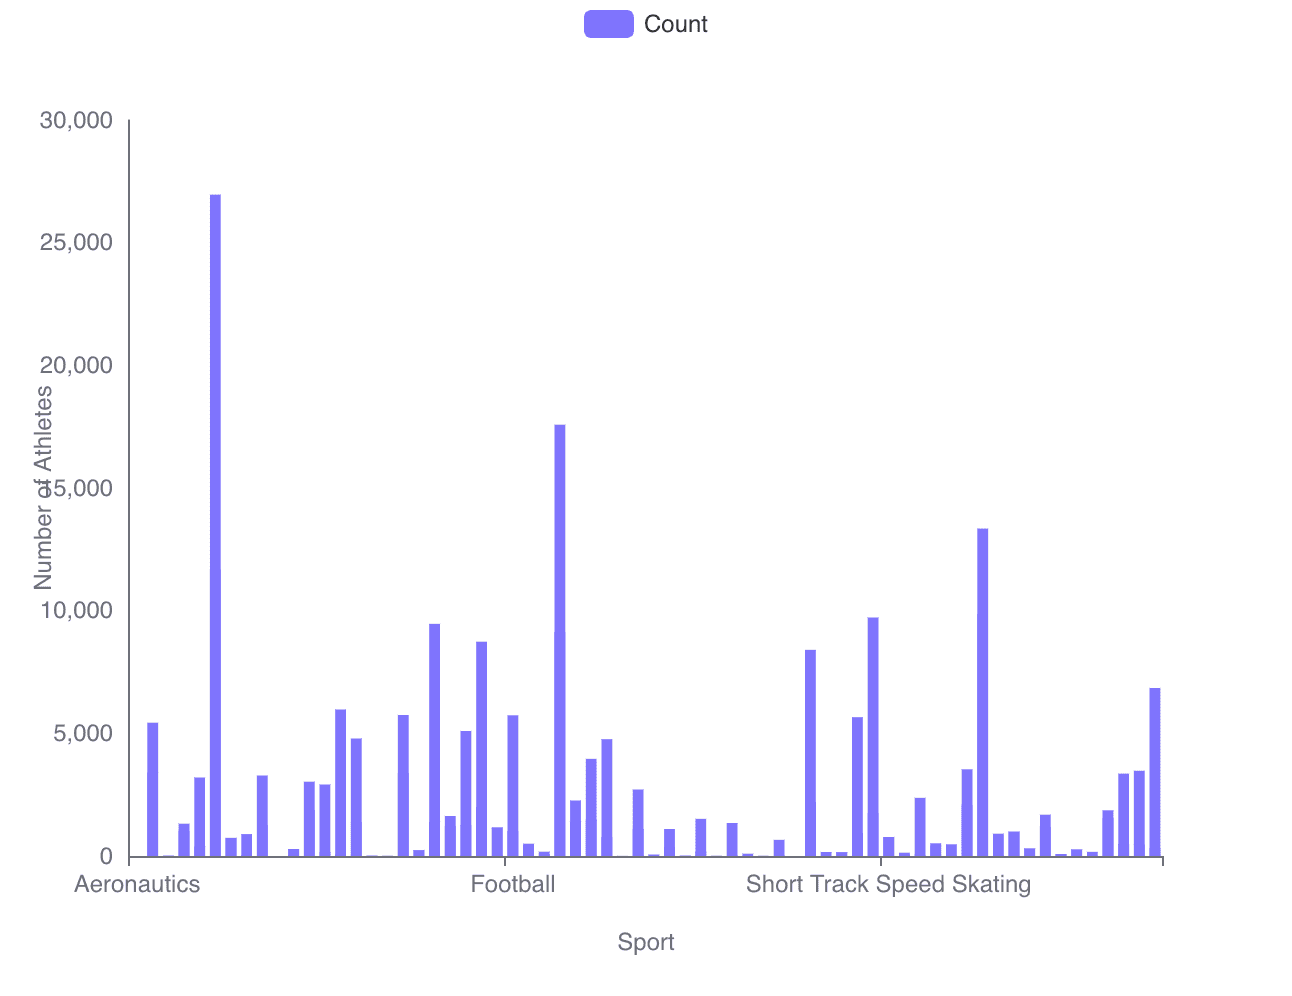
Based on the provided context and the visualization of the data, the distribution of male and female athletes across different sports varies significantly. The bar chart image illustrates the count of athletes in each sport, with separate bars for male and female athletes. However, the image does not clearly distinguish between the sexes due to the lack of color coding or labeling for the separate bars.
The analytical results data offers a clearer picture, showing a filtered dataset with only 'Sex' and 'Sport' columns. The data is grouped by 'Sport' and 'Sex', providing a count of male (M) and female (F) athletes in each sport. The detailed records show, for example, that there are 3,398 female athletes and 5,431 male athletes in Alpine Skiing. The dataset contains 116 rows, indicating that many sports have been analyzed.
Key Observations:
The mean count of athletes across all sports is 2,337.21, with a standard deviation of 3,854.73.
The minimum count of athletes in a sport is 1, and the maximum count is 26,958.
The first five rows of detailed data include sports such as Aeronautics and Alpinism, which have very few athletes, and Alpine Skiing, which has a larger number of athletes.
Data Limitations:
The bar chart does not clearly show the distribution between male and female athletes due to a lack of distinct colors or labels for each sex.
The detailed data provided only includes the first five rows, which is not sufficient to draw comprehensive conclusions about all sports included in the dataset.
Recommendations for Further Analysis:
Enhance the bar chart by adding distinct colors or labels to differentiate between male and female athletes for clearer visualization.
Provide the full dataset or a summary table that includes the count of male and female athletes for each sport to allow for a more detailed analysis of the distribution.
How does the medal count compare between male and female athletes?
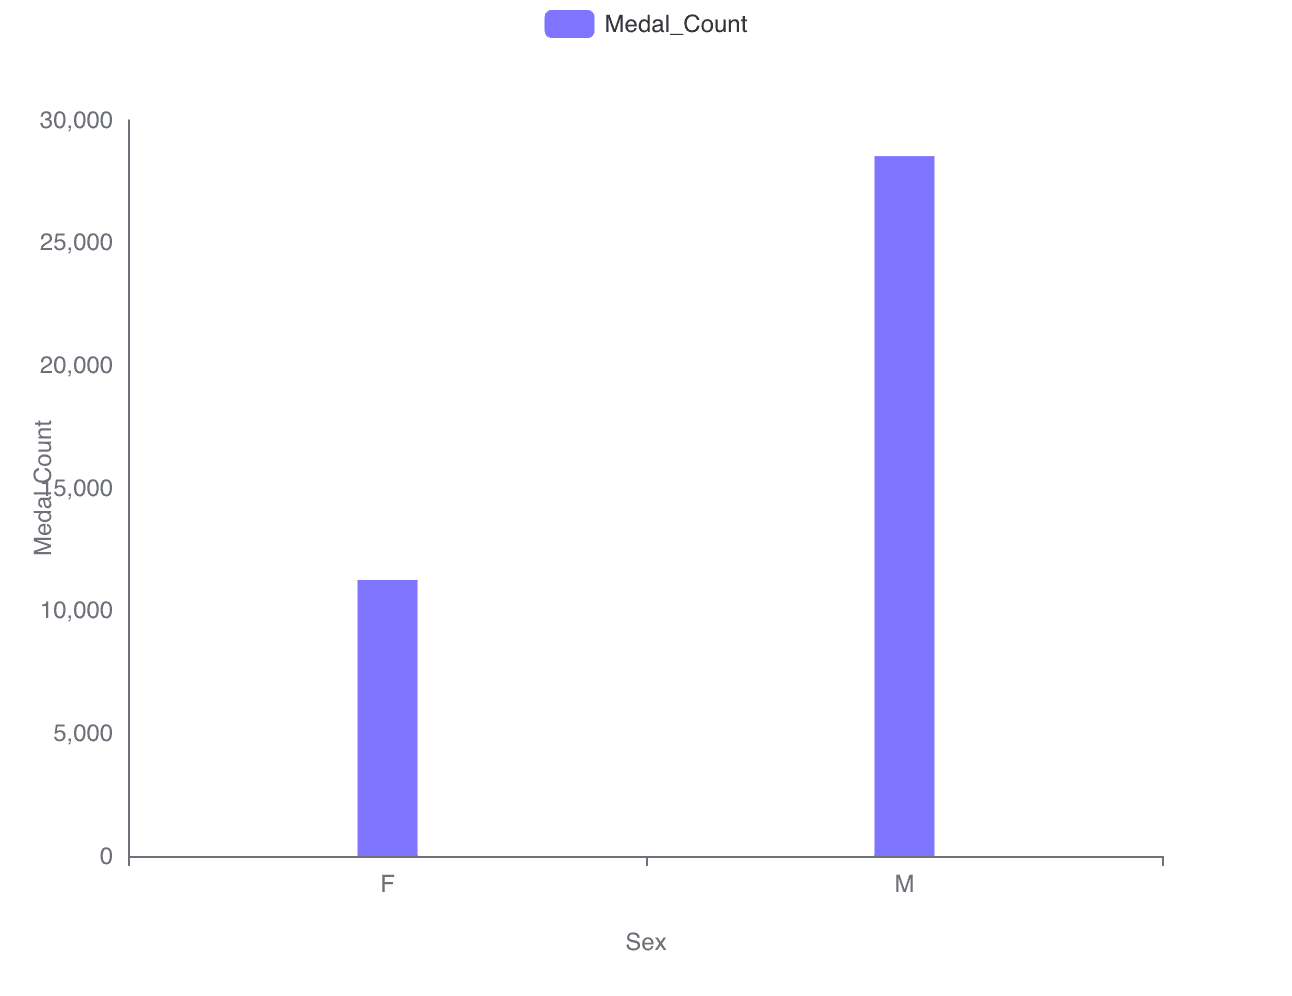
Comparison of Olympic Medal Counts by Gender:
Male Athletes: The data indicates that male athletes have won a total of 28,530 medals in the Olympic Games.
Female Athletes: Female athletes have won a total of 11,253 medals in the Olympic Games.
Observations:
There is a significant difference in the total medal counts, with male athletes having more than double the number of medals compared to female athletes.
The disparity may reflect historical differences in participation rates, the number of events available for each gender, and other socio-cultural factors that have influenced the representation of male and female athletes in the Olympics.
Data Summary:
The dataset was filtered to include only athletes who have won medals.
The data was grouped by gender, revealing the total medal counts for male and female athletes.
Recommendations for Further Analysis:
Investigate the historical trends in medal counts to understand how the gap has changed over time.
Analyze the distribution of medals across different sports to identify any patterns or disparities in gender representation.
Consider the impact of recent policy changes, such as the introduction of new events, on the medal counts for each gender.
5.Event-Specific Insights:
Which events have the highest number of participants?
Most Participated Events: The events with the highest number of participants are:
Football Men's Football: 5733 participants
Ice Hockey Men's Ice Hockey: 4762 participants
Hockey Men's Hockey: 3958 participants
Water Polo Men's Water Polo: 3358 participants
Basketball Men's Basketball: 3280 participants
Statistical Overview: The average number of participants across all events is 354.40, with a standard deviation of 545.10. The event with the least participants has only 1.
Data Scope: The analysis covers 765 different events.
What are the most common sports for medal winners?
Most Common Sports for Medal Winners:
Athletics is the most awarded sport with a total of 3,969 medals.
Swimming follows closely with 3,048 medals.
Rowing is the third most common with 2,945 medals.
Gymnastics and Fencing round out the top five with 2,256 and 1,743 medals respectively.
Data Summary:
The dataset contains 66 sports where athletes have won medals.
The average number of medals won per sport is 602.77.
The standard deviation in medal count across sports is 805.77, indicating a wide variation in medal counts.
The minimum number of medals won in a sport is 1, while the maximum is 3,969.
Note: The data provided includes the top five sports by medal count, and it is clear that Athletics is the leading sport for Olympic medal winners.
6.Seasonal Comparisons:
How do the Summer and Winter Olympics compare in terms of athlete demographics and medal distribution?
Athlete Demographics Comparison:
Age:
Summer Olympics: Mean age is approximately 25.67 years with a standard deviation of 6.70 years, ranging from 10 to 97 years.
Winter Olympics: Mean age is approximately 25.04 years with a standard deviation of 4.78 years, ranging from 11 to 58 years.
Observation: Athletes in both Olympics have similar mean ages, but the Summer Olympics show a wider age range and higher variability in age.
Height:
Summer Olympics: Mean height is approximately 175.52 cm with a standard deviation of 10.91 cm, ranging from 127 to 226 cm.
Winter Olympics: Mean height is approximately 174.59 cm with a standard deviation of 8.60 cm, ranging from 137 to 211 cm.
Observation: Athletes in both Olympics have similar mean heights, but the Summer Olympics show a wider range of heights.
Weight:
Summer Olympics: Mean weight is approximately 70.69 kg with a standard deviation of 14.80 kg, ranging from 25 to 214 kg.
Winter Olympics: Mean weight is approximately 70.76 kg with a standard deviation of 12.21 kg, ranging from 32 to 145 kg.
Observation: Athletes in both Olympics have similar mean weights, but the Summer Olympics show a wider range of weights and higher variability.
Medal Distribution Comparison:
Winter Olympics:
Gold: Mean of 41.59 medals with a standard deviation of 67.90.
Silver: Mean of 41.22 medals with a standard deviation of 64.81.
Bronze: Mean of 41.00 medals with a standard deviation of 54.61.
Observation: The distribution of medals is relatively balanced among the three categories, with a slightly higher mean for gold medals.
Summer Olympics:
Gold: A total of 11459 medals.
Silver: A total of 11220 medals.
Bronze: A total of 11409 medals.
Observation: The number of gold and bronze medals is very close, with silver medals being slightly less common.
Overall Observation:
The demographics of athletes are quite similar between the Summer and Winter Olympics, with minor differences in the variability of age, height, and weight.
The distribution of medals in the Winter Olympics is more balanced across the three categories compared to the Summer Olympics, where gold and bronze medals are more prevalent than silver.
Note: The provided data for the Summer Olympics demographics and medal distribution is aggregated, while the Winter Olympics data is more detailed, which may affect the direct comparability of the statistics.
7.City and Host Analysis:
Which host cities have seen the highest number of records or notable performances?
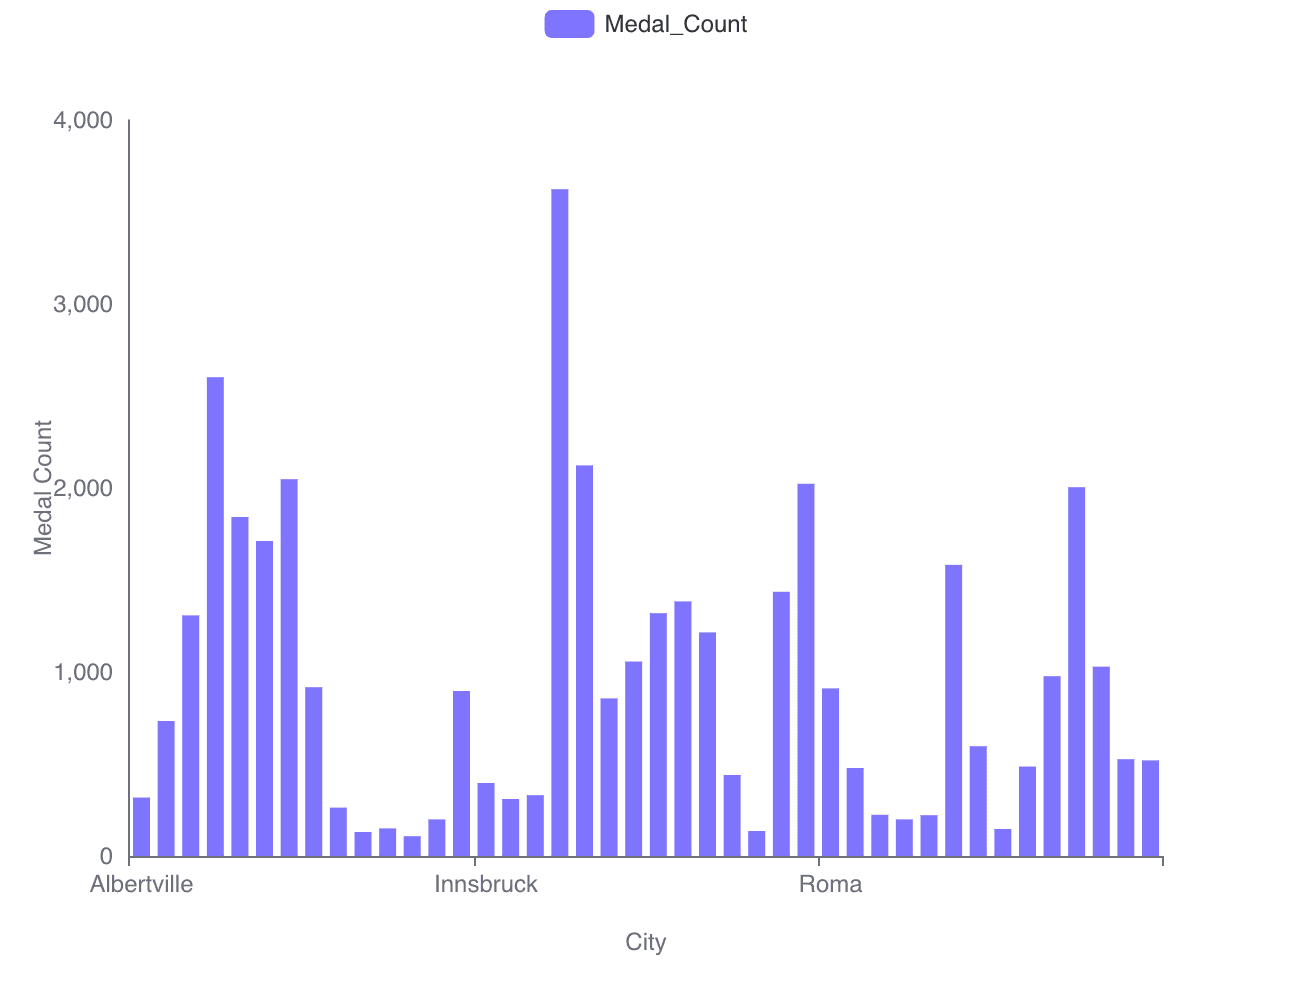
Ultimate Conclusion
Based on the provided data and visual representation, the host cities with the highest number of notable performances (medal wins) are as follows:
Athina (Athens): With a significant peak in the bar chart, it is evident that Athina has hosted a large number of notable performances.
London: Another city with a high bar on the chart, indicating a substantial number of medal wins.
Beijing: Also features prominently on the bar chart, suggesting a high count of notable performances.
Additional Observations:
The bar chart visualizes the medal counts for various cities, with some bars standing out more than others, indicating those cities have higher counts of notable performances.
The exact medal counts are not provided in the image, but the relative heights of the bars allow for a comparison between the cities.
Data Contextualization:
The city_performance_counts data table lists cities and their corresponding medal counts, with Athina, London, and Beijing among the top based on the provided examples.
The filtered_data table confirms that the dataset has been filtered to include only records with medal wins, which are considered notable performances.
Conclusion: Athina, London, and Beijing are the host cities with the highest number of records or notable performances, as indicated by both the data table and the bar chart visualization.
How does the performance of athletes vary by host city?
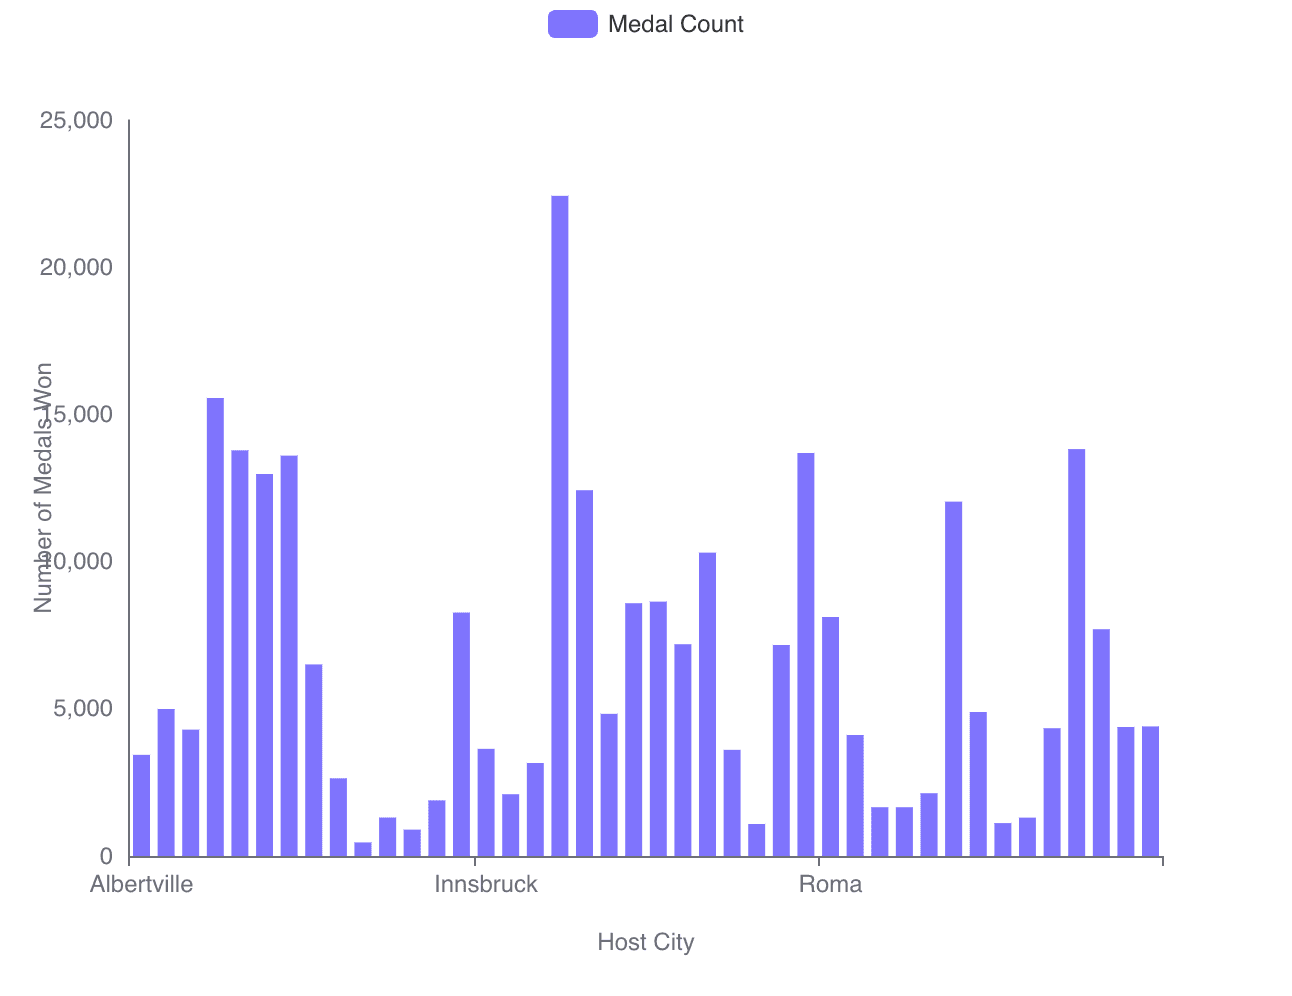
Based on the provided context and visualized data, we can draw the following conclusions about the performance of athletes in different host cities:
Variation in Medal Counts: There is a significant variation in the number of medals won across different host cities. This is evident from the bar chart and the statistical data provided.
Top Performing Cities: Some cities have a notably higher medal count, indicating that athletes' performances in these cities were exceptional. For example, Athina stands out with a particularly high medal count of 15,556.
Average Medal Count: The average number of medals won across all cities is 6,455.14, with a standard deviation of 5,070.49, suggesting a wide distribution in the performance levels.
Range of Performance: The minimum and maximum medal counts are 460 and 22,426 respectively, highlighting the disparity in athlete performance from one host city to another.
Data Insights: The first five rows of the city medal count data show varying performances, with cities like Albertville having 3,436 medals and Atlanta having 13,780 medals.
Key Observations from the Bar Chart:
The bar chart provides a visual representation of the data, where each bar corresponds to a host city and its height represents the number of medals won.
The chart clearly shows that some cities have much taller bars, indicating a higher number of medals won in those cities.
The distribution of medals is not uniform, and there are peaks and troughs that suggest certain cities were more favorable for athletes or hosted more events, leading to a higher medal count.
In conclusion, the performance of athletes varies significantly based on the host city, as demonstrated by the number of medals won. This variation could be influenced by a multitude of factors, including the number and types of events held, the conditions of the venues, and the level of preparation and participation by athletes.
8.Medal Distribution:
What is the distribution of gold, silver, and bronze medals across different NOCs and regions?
Medal Distribution by NOC:
The data indicates a total of 149 NOCs have been awarded medals.
The average number of gold medals per NOC is 89.74, with a standard deviation of 264.93.
The average number of silver medals per NOC is 88.03, with a standard deviation of 199.89.
The average number of bronze medals per NOC is 89.23, with a standard deviation of 188.18.
Top Performing NOCs:
The NOC with the maximum gold medals has 2638 golds.
The NOC with the maximum silver medals has 1641 silvers.
The NOC with the maximum bronze medals has 1358 bronzes.
Regional Medal Distribution:
The dataset has been merged to include the corresponding regions for each NOC.
For example, NOC 'AFG' represents Afghanistan with 0 gold, 0 silver, and 2 bronze medals.
NOC 'ALG' represents Algeria with 5 gold, 4 silver, and 8 bronze medals.
NOC 'ARG' represents Argentina with 91 gold, 92 silver, and 91 bronze medals.
Data Insights:
The distribution of medals is highly varied among different NOCs and regions.
There is a significant disparity in medal counts, with some NOCs having thousands of medals and others with none or very few.
The data suggests that certain regions and NOCs are more dominant in the Olympics, likely due to a combination of factors such as investment in sports, population size, and historical participation in the games.
Recommendations for Further Analysis:
Investigate the factors contributing to the high performance of top NOCs.
Analyze the impact of socio-economic factors on the medal tally of different regions.
Explore trends over time to see how the distribution of medals has changed across different Olympic games.
Are there any regions or NOCs that specialize in certain sports or events?
Specialization by Region and Sport: The data analysis reveals that regions do indeed show specialization in specific sports. The grouping of the merged data by 'region' and 'Sport' with the 'Count' of occurrences provides insights into which sports are more prevalent in certain regions.
Key Observations:
The mean count of sports participation by region is 73.69, with a standard deviation of 166.87. This indicates a wide variance in the number of participants per sport across different regions.
The maximum count observed is 3211, suggesting that there are sports with very high participation in some regions.
The minimum count is 1, which could indicate niche specializations or low participation in certain sports within some regions.
Detailed Examples:
Afghanistan shows participation in Athletics (22), Boxing (5), Football (11), Hockey (39), and Judo (3). This suggests a higher inclination towards Hockey within the region.