
As we move deeper into the first quarter, I find myself watching one number more closely than any other: 7,002.28. That record high in the S&P 500 has become a psychological and structural magnet for the market. With March 31 approaching, the real question isn’t whether the index is strong — it clearly is — but whether there is enough time, volatility, and narrative momentum left to push it decisively through that ceiling.
Using a structured probability framework powered by Powerdrill Bloom, I modeled both the likelihood of a “touch” and the stricter scenario of a quarter-end close above the record. My base case suggests meaningful upside potential, but not a decisive breakout with high conviction.
1. My Core Forecast: Mildly Bullish, Not a High-Conviction Breakout
As of February 26, 2026, the index is trading around 6,890–6,900 — roughly 1.5% below the 7,002.28 threshold. That proximity matters. Markets don’t need a major macro shock to test a level this close. A modest positive catalyst can be enough.
However, time is the limiting factor. The remaining window to March 31 is relatively short. Meanwhile, the CBOE Volatility Index is hovering around 19. This level signals a moderate volatility environment — stable enough to support gains but not low enough to make an effortless breakout likely.
My overall view is straightforward: a test of the highs is realistic, but a sustained move above the record by quarter-end remains uncertain.
2. Quantifying the Probability: Touch vs. Close
To make the forecast precise, I separate the outcome into two definitions.
The first is a close-based scenario, where the index must finish March 31 at or above 7,002.28. The second is a touch-based scenario, where the index reaches the level at any point before March 31, even intraday.
I use a lognormal price framework as a first-order approximation, anchored to observable market inputs:
Spot level around 6,896
Annualized volatility near 19% based on VIX
Net carry around 3.2% annually (risk-free rate minus dividends)
Under these assumptions, my base-case probabilities are:
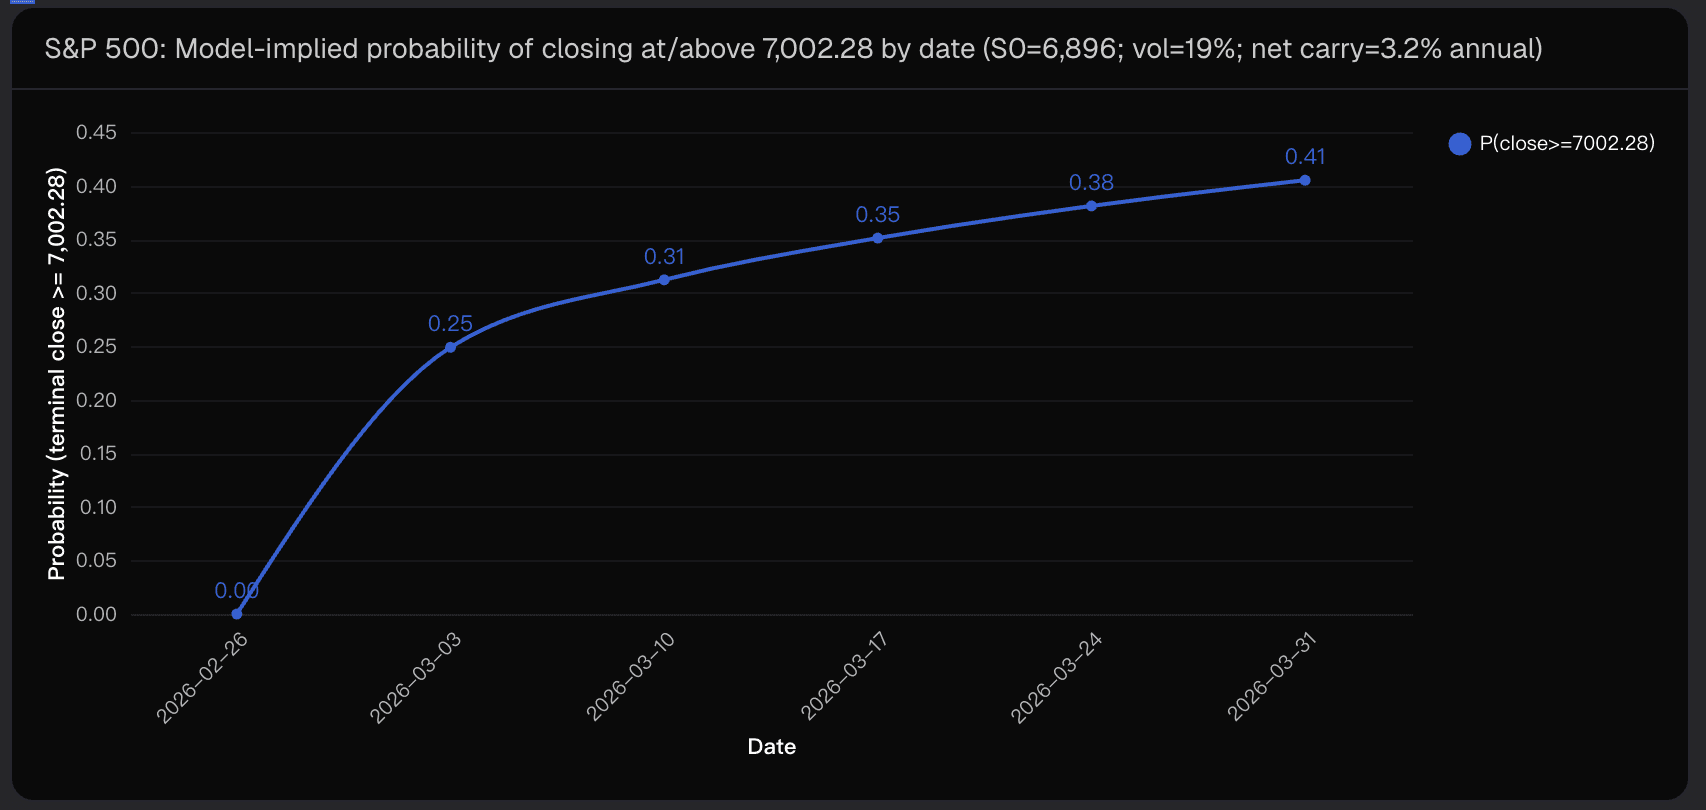
Probability of closing at or above 7,002.28 on March 31: about 41%
Probability of touching 7,002.28 before March 31: about 47%
The difference between these two outcomes is important. Markets frequently test major highs without finishing above them on a specific date.
As the timeline moves toward March 31, the probability of closing above the level increases gradually. The model implies a steady rise from near zero today to roughly 41% by quarter-end, reflecting the growing opportunity for the index to reach the threshold.
3. What the Distribution Suggests
Probability alone does not fully describe the outlook. The expected distribution of outcomes shows how wide the range of possibilities remains.
Using the same baseline assumptions, the projected March 31 distribution looks roughly like this:
Median level near 6,905
Lower range near 6,400
Upper range around 7,435
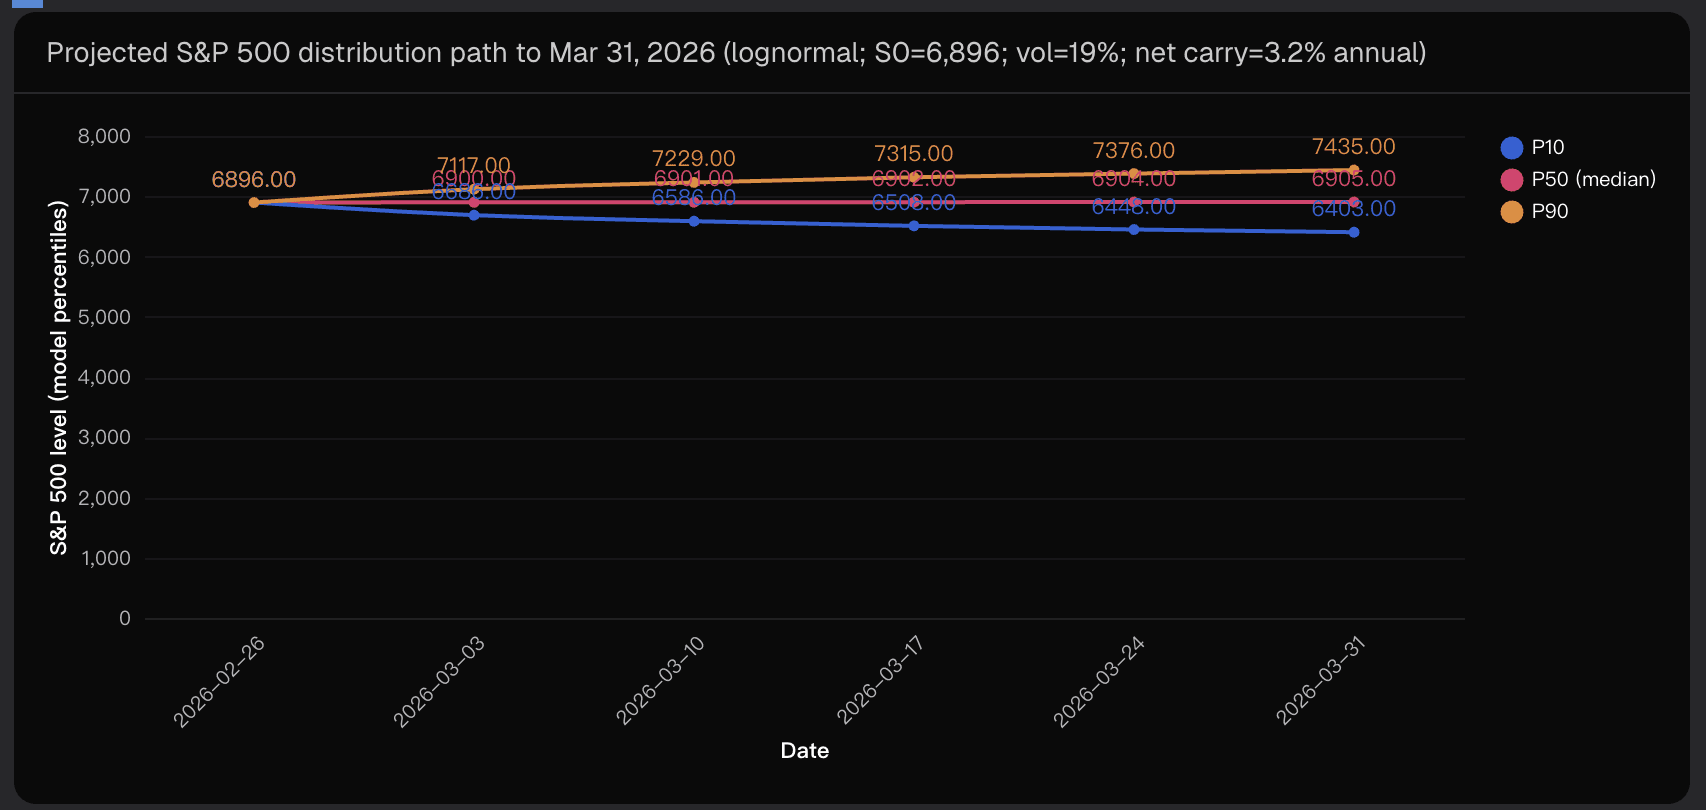
This wide distribution explains why the touch probability is close to a coin flip even though the index is already near the target level.
The median path suggests a stable market rather than a strong trend. However, the upper tail clearly allows for a new record high if conditions remain supportive.
4. Key Drivers That Could Push the Index Higher
Market Structure
When the index sits only 1–2% below a major high, relatively small positive catalysts can trigger a fast move upward. Systematic strategies such as trend-following and volatility-control funds often add exposure when markets remain stable, reinforcing upward momentum.
Volatility Conditions
A VIX near 19 reflects a balanced environment. It supports movement in both directions rather than guaranteeing a steady climb. Extremely low volatility environments tend to produce smoother advances, while the current regime suggests intermittent pullbacks are likely.
Macro Backdrop
A continuation of the soft-landing environment remains one of the most supportive scenarios for equities. Cooling inflation combined with resilient growth typically reduces pressure from real interest rates and lowers recession risk. Under these conditions, incremental new highs become achievable even without dramatic earnings surprises.
Earnings Narrative
Large-cap earnings expectations remain stable, supported by continued investment and productivity gains tied to artificial intelligence. If earnings revisions remain stable or improve slightly, valuations can stay elevated enough to support a marginal new high.
5. Risks That Could Prevent a Breakout
Several developments could quickly reduce the probability of reaching the record:
Inflation data that pushes interest rates higher
Central bank guidance that delays expected rate cuts
A volatility spike that pushes VIX into the mid-20s or higher
Earnings disappointments among index heavyweights
A failed breakout attempt that turns the record level into strong resistance
Major highs are often tested multiple times before a sustained breakout occurs. A failed first attempt could keep the index below the record through quarter-end even if the broader trend remains positive.
Conclusion: A Balanced Setup Into Quarter-End
My base-case estimate is that the S&P 500 has roughly a coin-flip chance of touching 7,002.28 before March 31, but a lower probability of finishing the quarter above that level. The index is close enough for a test to occur quickly, yet the remaining time window and moderate volatility make a confirmed breakout uncertain.
From a probability perspective, this is a balanced setup rather than a one-sided opportunity. The upside path toward a new record remains open, but the margin for error is small as quarter-end approaches.
The full probability modeling and distribution analysis behind this forecast were generated using Powerdrill Bloom, which allowed me to translate market volatility and price dynamics into a transparent scenario-based outlook.
This analysis is for informational purposes only and does not constitute investment advice.
Related Post

2026年2月25日
/
Post by

2026年2月10日
/
Post by

2026年2月9日
/
Post by