Will Bitcoin Dip to $80,000 in February?
Molly·

As February 2026 approaches, one question is on many investors’ minds: could Bitcoin drop to $80,000?
Using Powerdrill Bloom, I’ve analyzed price patterns, derivatives activity, and market narratives to arrive at a structured probability assessment.
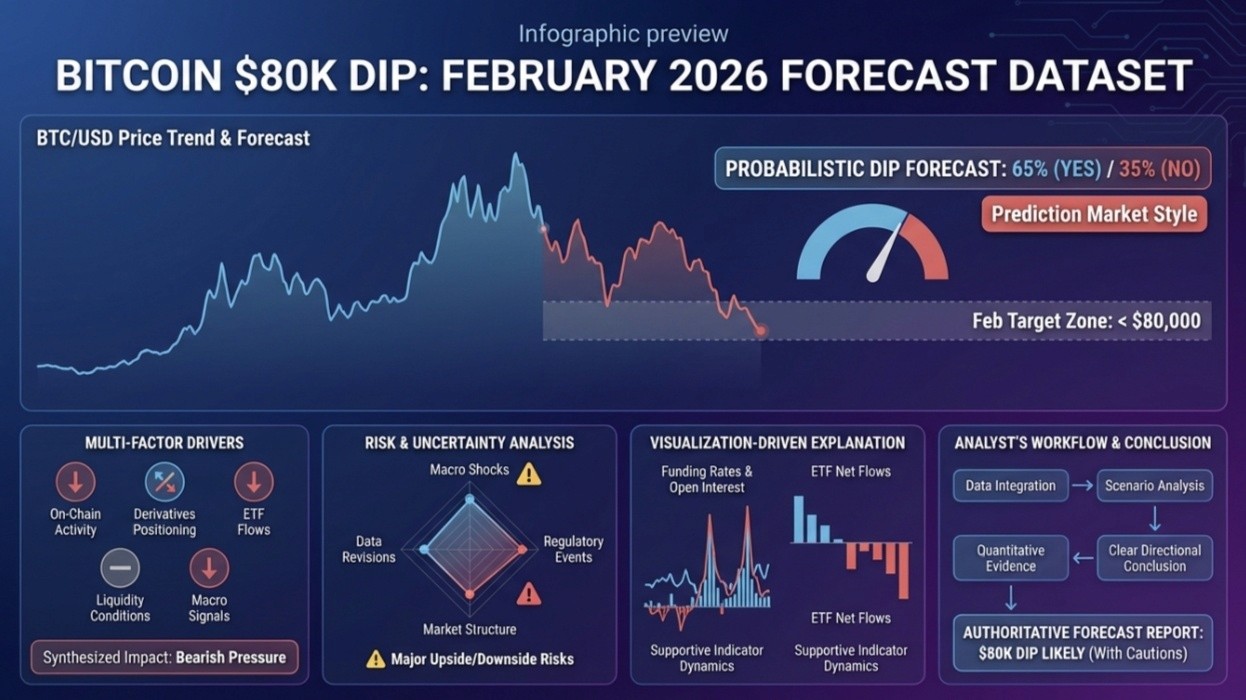
This is a Topic Preview Image generated by Powerdrill Bloom based on my question.
My base case suggests Bitcoin will remain above $80,000 throughout February, most likely trading in a mid-$80k to low-$90k range. Intraday volatility could create sharp wicks, driven primarily by liquidation events, but the overall trend should hold.
A dip to $80,000 would indicate a more severe "risk-off + deleveraging" environment. In such a scenario, the market would test the late-2025 lows, triggering clustered liquidation levels.
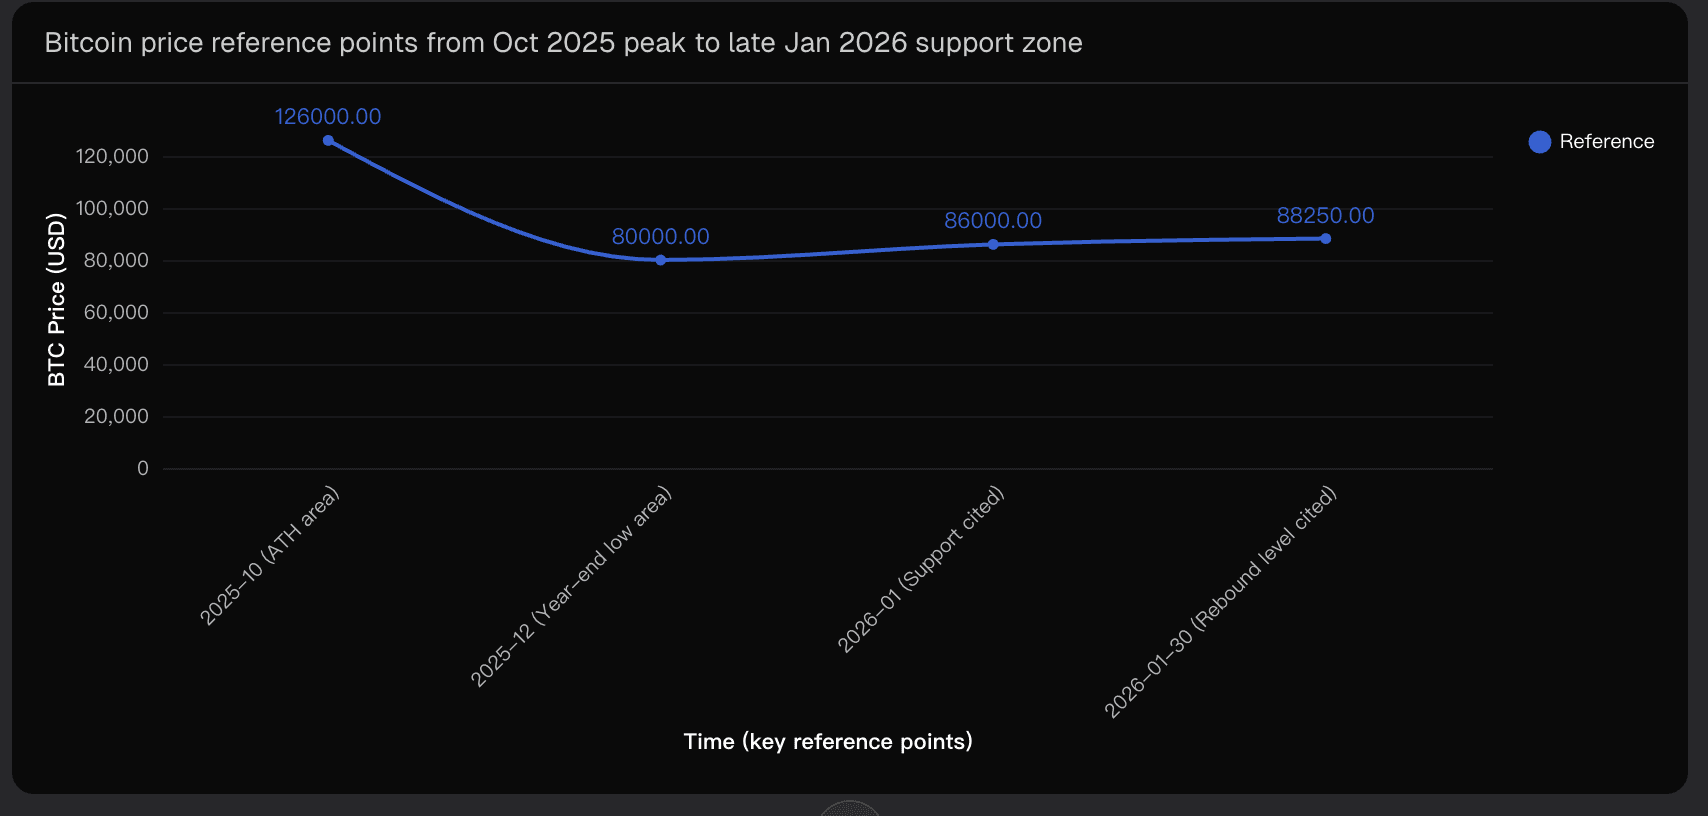
Historical reference points—from the October 2025 all-time high to January 2026 support zones—illustrate how these key levels define the battlefield for market participants.
Based on my analysis:
Probability Bitcoin touches or dips below $80,000 in February 2026: 35%
Probability Bitcoin holds above $80,000 through February 2026: 65%
A 35% probability is higher than “tail risk,” reflecting the market’s recent ability to move quickly through the $86k–$90k band under crowded leverage. However, it remains below 50% because $80,000 is a widely observed prior low, attracting defensive positioning and dip buyers.
The $80,000 zone, established in late 2025, serves as a strong magnet in stress scenarios. January 2026 commentary frequently cited $86,000 as a key support, indicating that the market already leans on a nearby floor. Given the short distance between $86k and $80k, a single volatility expansion day could bridge this gap.
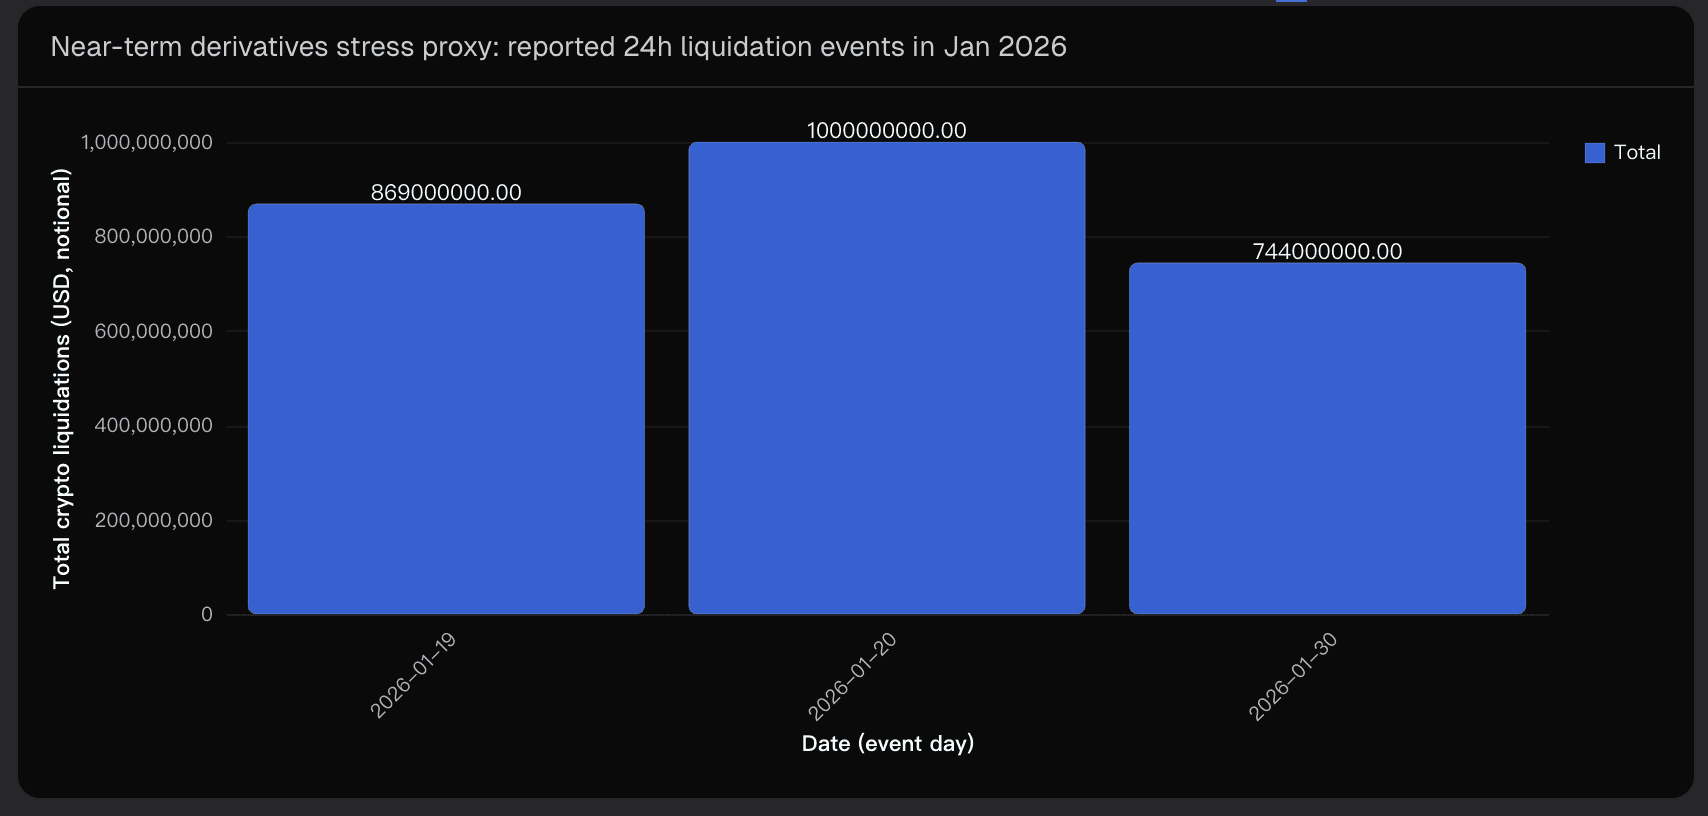
Leverage in the derivatives market makes Bitcoin’s downside non-linear. Even without a macro shock, funding and positioning imbalances can trigger forced selling, pushing spot through thin liquidity zones.
Reported January 2026 liquidation events—ranging from hundreds of millions to ~$1B—highlight how leverage can cascade rapidly.
The $80,000 level is not purely technical; it’s a consensus narrative. Market participants coordinate expectations around this level for stop placement, hedging, and monitoring liquidation heatmaps.
Multiple forecasts cite mid-$70k lows as plausible downside scenarios, making $80k a realistic test even if the median price remains higher.
A February dip is most likely under one or more of the following:
Macro tightening surprises (interest rates, inflation, or growth shocks) triggering cross-asset deleveraging.
Institutional flow headwinds, such as ETF outflows reducing spot “catch bids.”
Equity market drawdowns increasing crypto risk premia.
Absent these catalysts, Bitcoin could remain in a volatility-controlled range, approaching but not breaching $80,000.
Breakdown and weak rebound from $86k support (support turning into resistance).
Large, clustered liquidation days paired with rising open interest.
Sustained institutional selling or broad risk-off in equities.
Evidence of structural accumulation or strong spot bid response.
Falling open interest during down moves, indicating healthy deleveraging.
Volatility compression and stable funding positions.
Macro stabilization and improved liquidity conditions.
My analysis relies on reference-point prices and reported liquidation events, not tick-by-tick datasets. Bitcoin can react violently to single-event news shocks, which are difficult to model probabilistically. This makes scenario-based reasoning more appropriate than precise timing forecasts.
In summary, the base case (65%) sees Bitcoin holding above $80k, trading in a range roughly between $80k and $90k+. The downside scenario (35%) occurs if $86k support breaks, leverage cascades, and spot briefly probes $80k.
The key indicator is whether selloffs reflect true deleveraging or fragile persistence. Observing open interest and funding dynamics in real time is crucial.
Tools like Powerdrill Bloom are invaluable for visualizing these scenarios, allowing me to combine historical reference points, liquidation events, and narrative focal levels into a clear probability-driven analysis.
Disclaimer: This forecast is for informational purposes only and does not constitute financial advice.