Data Fact: Zeven cruciale cijfers achter de cryptocrash van juni 2026
TL;DR — De cryptocrash van juni 2026 in 5 cijfers
De cryptomarkt kreeg medio 2026 een keiharde realitycheck. Na maanden van zijwaartse koersbewegingen bezweek de bodem, aangedreven door institutionele uitputting en macro-economische tegenwind. Dit is de wereldwijde cryptocrash in vijf cijfers:
- -53%: De daling van Bitcoin vanaf de all-time high (ATH) van $126,296 in oktober 2025, recent gezakt van $72,840 tot onder $59,000 (-18% alleen al in juni).
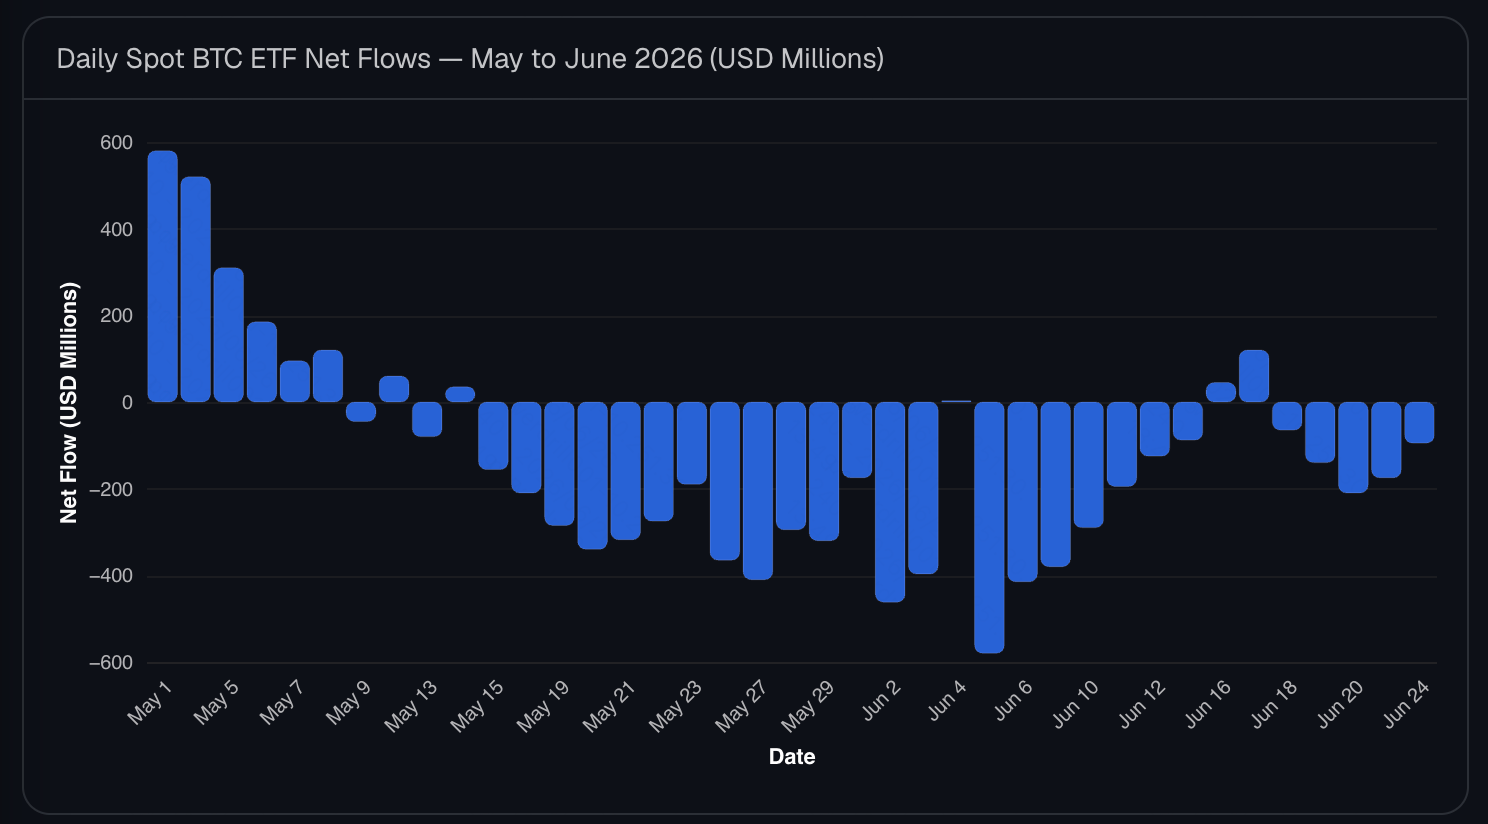
- $4.33 miljard: Het enorme bedrag dat over een recordperiode van 13 opeenvolgende dagen uit Spot BTC ETF's werd getrokken.
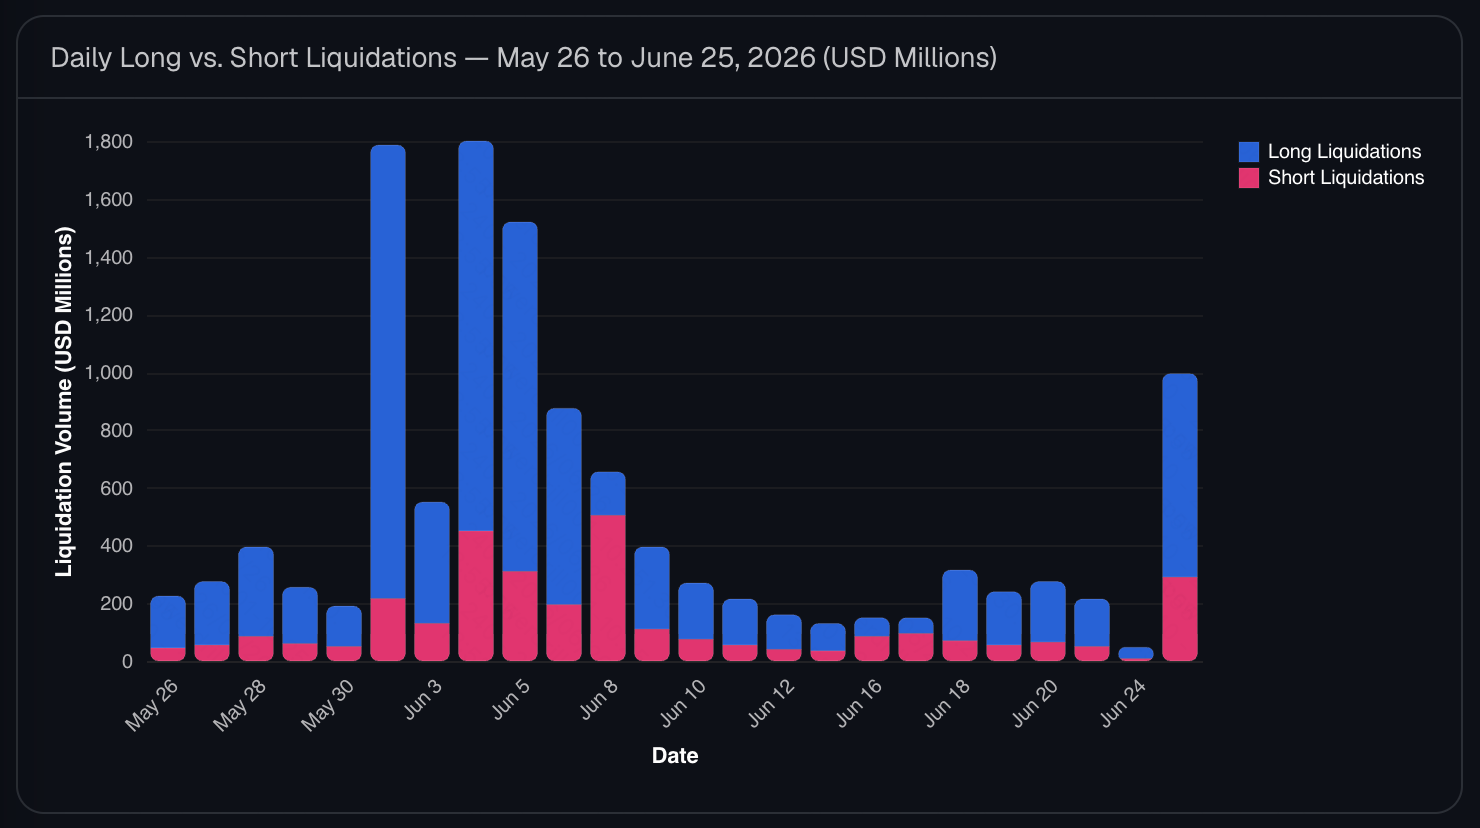
- $4.56 miljard: De totale waarde van liquidaties op de cryptomarkt in de afgelopen 30 dagen.
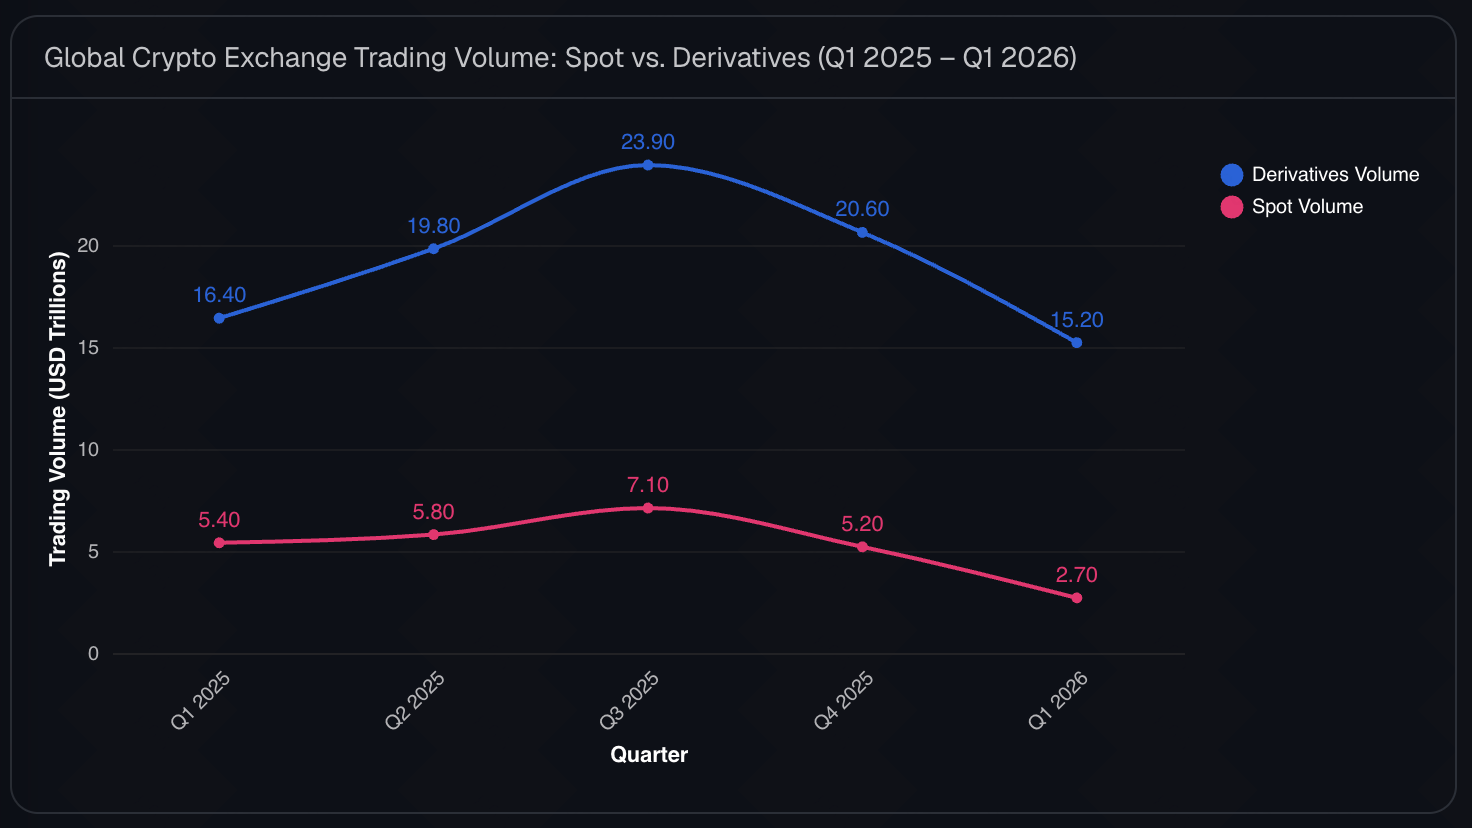
- -42%: De daling van het kwartaalvolume op exchanges vergeleken met de piek in Q3 2025.
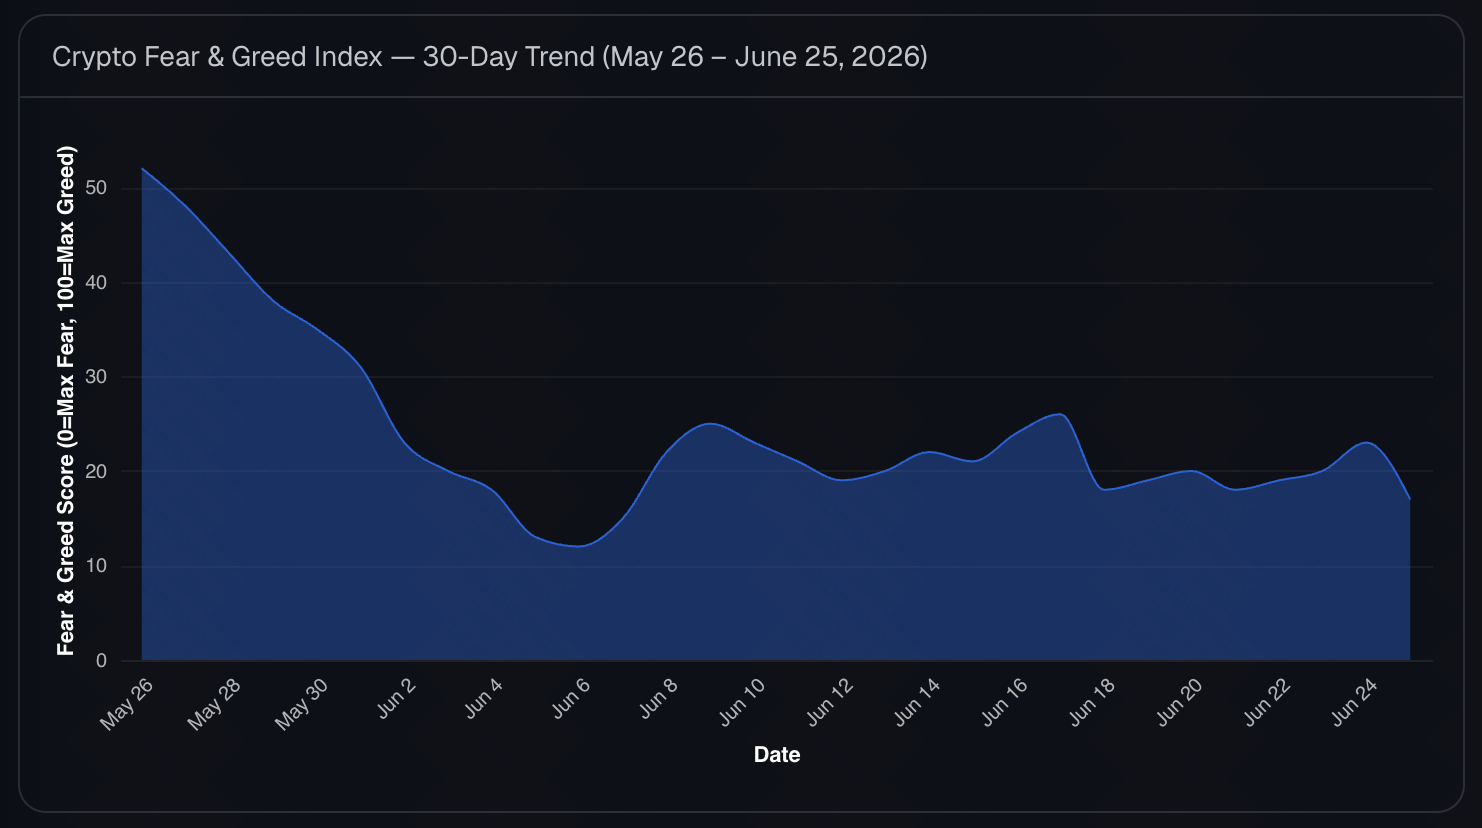
- 13/100: De Crypto Fear & Greed Index kelderde naar "Extreme Fear", het laagste marktsentiment sinds de bearmarkt van 2022.
Kort samengevat: De cryptocrash van juni 2026 was niet zomaar een technische correctie—het was een structurele deleveraging, aangedreven door kapitaalvlucht richting AI en veranderende macro-economische verwachtingen.
Een beetje achtergrond
Een jaar geleden werd het verhaal bepaald door institutionele adoptie, instroom in Spot ETF's en de euforie na de halving. Bitcoin schoot omhoog naar een ATH van $126,296 in oktober 2025.
Maar tegen juni 2026 was het gesprek drastisch verschoven. De combinatie van hardnekkige inflatie, havikachtig centralebankbeleid en een onmiskenbaar "vacuümeffect" van de opverende AI-aandelenmarkt onttrok liquiditeit aan risicovolle activa. Om te laten zien hoe ernstig deze marktcorrectie is, hebben we de cijfers op een rij gezet en de data het verhaal laten vertellen.
Over de dataset
Dit rapport is gebaseerd op openbaar beschikbare on-chain data, exchange-statistieken en institutionele stroomrapporten over begin tot medio 2026. Bronnen zijn onder meer ETF-instroom/uitstroomtrackers, Coinglass derivatenliquidaties, Alternative.me voor marktsentiment en toonaangevende on-chain analyseplatforms. Cijfers zijn bij benadering en afgerond voor de leesbaarheid.
Over de tool
Elke grafiek in dit rapport is gemaakt met Powerdrill Bloom, een AI-first data-analyseagent. We hebben de ruwe spreadsheet met marktstatistieken geüpload, en Bloom heeft deze opgeschoond, verkenningspaden voorgesteld en de onderstaande grafieken automatisch geproduceerd — geen SQL, geen Python, geen handmatige opmaak. Wil je dezelfde data zelf verkennen, bekijk dan onze AI-tool voor datavisualisatie.
Belangrijkste conclusies
- Instituten drukken op pauze. Spot ETF's beleefden hun langste aaneengesloten uitstroomreeks sinds hun lancering in januari 2024.
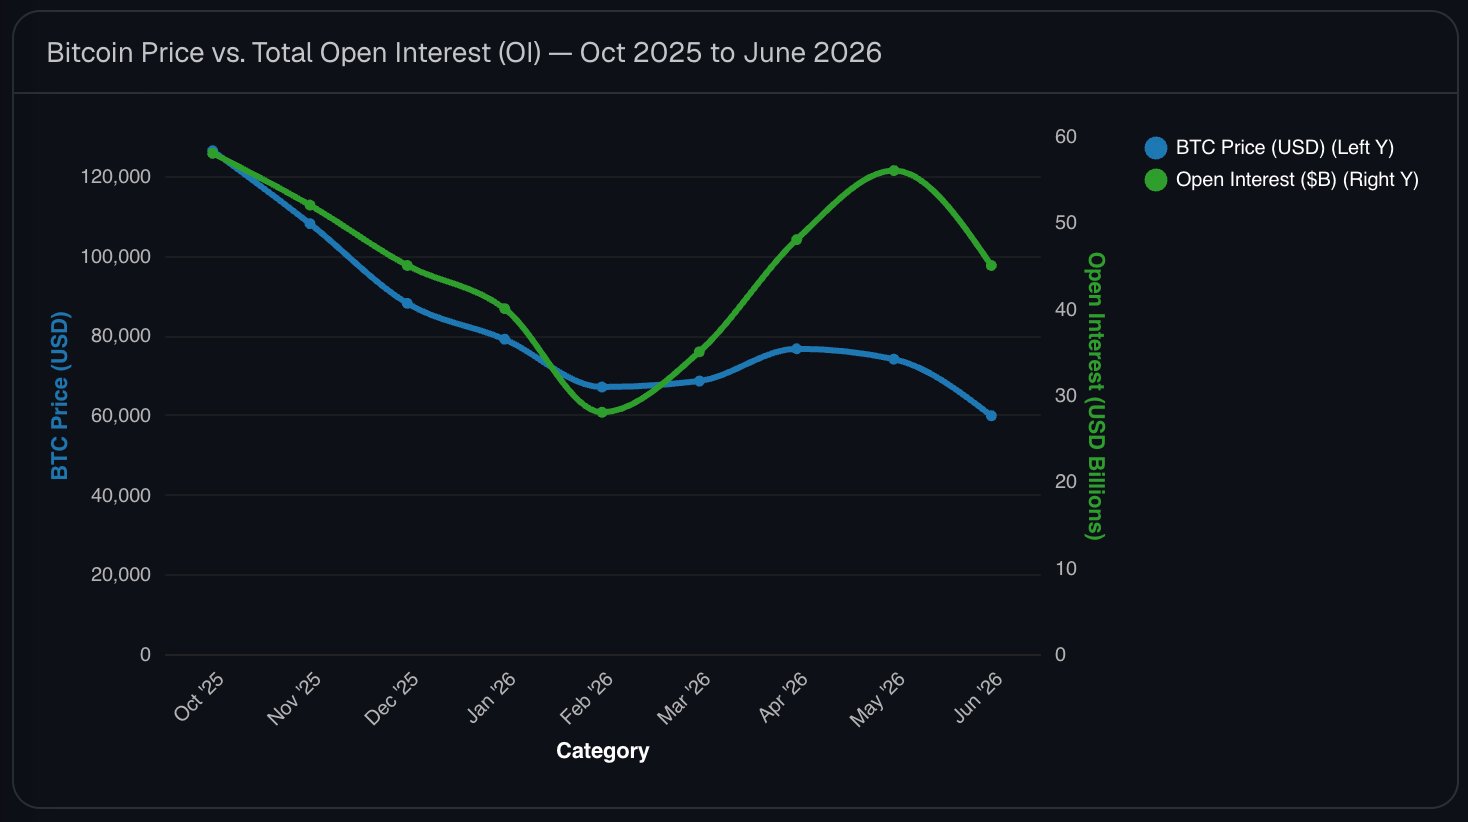
- De hefboom bereikte een kookpunt. De leverage ratio piekte op 2.63% voordat een historische uitverkoop de Open Interest halveerde.
- Het volume droogt op. Zowel spot- als derivatenvolumes krimpen, wat erop wijst dat traders de markt volledig verlaten in plaats van kapitaal te herschikken.
- Whales capituleren. Mega-wallets, Mt. Gox-distributies en zelfs overtuigde gelovigen als MicroStrategy werden betrapt op verkopen.
- Macrofactoren zitten aan het stuur. AI-aandelen en IPO's absorberen liquiditeit, terwijl hardnekkige inflatie renteverlagingen verder vooruitschuift.
De wereldwijde cryptocrash: de volledige data-analyse
1. ETF-uitstroom: 13 dagen bloeden ($4.33B)
Sinds hun lancering in januari 2024 zijn Spot BTC ETF's een pijler van de marktkracht geweest. Die reeks werd in juni 2026 hardhandig doorbroken. De markt zag 13 opeenvolgende handelsdagen van uitstroom, met een totaal verlies van $4.33 miljard (ongeveer 59,400 BTC). Alleen al BlackRock's IBIT noteerde een uitstroom van $980 miljoen in één week. Om olie op het vuur te gooien, liquideerde Morgan Stanley zijn volledige positie van 8,300 BTC.
2. Leverage ratio: piek op 2.63%
De markt werd gevaarlijk topzwaar. Op 2 juni bereikte de futures leverage ratio 2.63%, het hoogste niveau sinds de ATH van oktober 2025. Wat volgde was een brute afwikkeling: de totale Open Interest (OI) kelderde van $56 miljard naar $25 miljard (een dieptepunt in 6 maanden), en de arbitragebasis werd agressief samengedrukt van 12% tot slechts 4-5%.
3. Liquidaties: $4.56B weggevaagd in 30 dagen
Het deleveraging-proces was ongelooflijk pijnlijk voor traders met te veel hefboom. In de afgelopen 30 dagen vonden er in totaal $4.56 miljard aan liquidaties plaats. Het hoogtepunt was op 4 juni, toen er op één dag een duizelingwekkende $1.8 miljard werd geliquideerd. Daarvan was 75% ($1.35 miljard) longposities, waarbij de grootste enkele liquidatieorder uitkwam op $402 miljoen.
4. Exchange-volume: 32% lager QoQ
Traders verkopen niet alleen; ze vertrekken. Het totale handelsvolume in Q1 2026 bedroeg $17.9 biljoen—een daling van 32% ten opzichte van het vorige kwartaal en een enorme afname van 42% ten opzichte van de piek van $31 biljoen in Q3 2025. Cruciaal is dat zowel de spot- als de derivatenmarkten synchroon krompen, wat wijst op een echte liquiditeitsexodus in plaats van sectorrotatie.
5. Verkoop door whales: 36,000+ BTC gedumpt
De zwaargewichten deden hun posities van de hand. Wallets met tussen de 10,000 en 1,000,000 BTC verkochten in één week netto ruim 36,000 BTC. Tegelijkertijd verplaatste Mt. Gox 10,422 BTC (ter waarde van ongeveer $739 miljoen). Het meest schokkende: MicroStrategy—befaamd om zijn "nooit verkopen"-ethos—brak zijn eigen regel door 32 BTC te verkopen, wat een zware psychologische klap toebracht aan het marktvertrouwen.
6. Fear & Greed Index: Extreme Fear op 13
De marktpsychologie is volledig omgeslagen. In juni raakte de Crypto Fear & Greed Index een dieptepunt van 13 ("Extreme Fear"), met een 7-daags gemiddelde van slechts 20 (momenteel rond de 23-24). De Relative Strength Index (RSI) beweegt zich in de bandbreedte van 39-50. Al met al staat het marktsentiment op het laagste punt sinds het dieptepunt van de bearmarkt van 2022.
7. Macro-economische tegenwind: rente, olie en het AI-vacuüm
Crypto crasht niet in een vacuüm. Deutsche Bank heeft zijn prognose onlangs bijgesteld en houdt nu rekening met twee renteverhogingen in 2026 vanwege de hardnekkig aanhoudende inflatie. Het conflict tussen de VS en Iran heeft de olieprijzen opgedreven, wat de inflatievooruitzichten verder bemoeilijkt. Ondertussen roteert particulier en institutioneel kapitaal actief uit crypto en stroomt het naar de bloeiende markten voor AI-aandelen en IPO's.
Wat dit betekent voor traders en analisten (het lichtpuntje)
Voor risicomanagers en analisten ziet de data er misschien somber uit, maar er is een duidelijk lichtpuntje: de markt is volledig schoongespoeld.
De historische uitverkoop van hefboom is traditioneel een voorwaarde voor een marktomslag. We zagen in februari een vrijwel identieke OI-reset, die binnen slechts 3 weken werd gevolgd door een Bitcoin-rally van $7,000. Bovendien, terwijl middelgrote whales en instituten in paniek raakten, laat on-chain data zien dat bepaalde smart-money mega-whales tegen de trend in beginnen te accumuleren. Het risico is verschoven van "hoe diep kunnen we vallen" naar "wie koopt de bodem".
Hoe we deze grafieken maakten (met één klik)
Je hebt geen datateam nodig om zo'n marktrapport te maken. Dit is de precieze workflow:
- Kies een onderwerp of skill en upload vervolgens je data. Upload een CSV- of Excel-bestand met exchange-stromen, ETF-activiteit en liquidatiecijfers naar Powerdrill Bloom, en laat de AI de analyse afhandelen.
- Laat het canvas het verkennen. Bloom schoont de data automatisch op en stelt drie slimme verkenningspaden voor — trends, volume-uitsplitsingen, correlaties — en genereert vervolgens de grafieken voor je.
- Exporteer naar slides. Zet het hele canvas om in een gepolijste, presentatieklare deck en exporteer met één klik naar PowerPoint.
Geen SQL. Geen Python. Geen grafieken kopiëren en plakken in slides. Wil je het uitproberen op je eigen dataset? Probeer Powerdrill Bloom gratis.
FAQ
Hoeveel is Bitcoin gedaald ten opzichte van zijn piek?
Bitcoin zakte in juni 2026 tot onder $59,000, een daling van 53% ten opzichte van de all-time high van $126,296 in oktober 2025.
Waarom zien BTC ETF's zo'n enorme uitstroom?
Een combinatie van macro-economische tegenwind—zoals uitgestelde renteverlagingen en inflatievrees—samen met kapitaalrotatie naar AI-aandelen, heeft ertoe geleid dat traditionele beleggers risico afbouwen.
Is dit het begin van een nieuwe bearmarkt?
Hoewel de kortetermijnstatistieken wijzen op een zware deleveraging, hebben extreme hefboomuitverkopen zoals die we zagen (OI die daalde van $56B naar $25B) historisch gezien gefungeerd als lokale bodems en voorbodes van sterke herstelbewegingen.
Kan ik mijn eigen crypto-handelsdata op deze manier analyseren?
Ja. Upload een CSV- of Excel-bestand naar Powerdrill Bloom en het schoont de data op, bouwt de grafieken en laat je een slide-deck exporteren — zonder programmeren.
Tot slot
De zeven cijfers achter de cryptocrash van juni 2026 vertellen een duidelijk verhaal: de markt vloog met een hoge hefboom te dicht bij de zon, en een veranderend macro-economisch landschap dwong een gewelddadige reset af. Met $4.56 miljard weggevaagd en institutionele ETF-stromen die omkeren, is de speculatieve schuimlaag officieel verdwenen. De interessante vragen nu zijn of deze OI-reset de weg vrijmaakt voor een herstel in Q3, en hoe snel kapitaal terugroteert vanuit de AI-sector.
Benieuwd wat je handelsdata verbergt? Upload het naar Powerdrill Bloom en laat de grafieken het verhaal vertellen.