トップ11のAIデータ分析ツール - 2026年のアップデート

はじめに
2026年です。マーケティングマネージャーやビジネスアナリストの挑戦は「データを取得する」ことではなく、「インサイトの麻痺」を避けることです。
私は、マーケティングメトリクス、財務テーブル、および非構造的PDFなどの混沌としたリアルワールドのデータセットを市場で最も人気のある11のツールに投入しました。
この記事では、11月のトップ10 AIデータ分析ツールをレビューし、2026年に市場を支配すると予測される11のAIデータ分析ツールについて詳しく説明します。
リスト:2026年のベスト11 AIデータツール
徹底的なテストの結果、こちらが確定リストです:
パワードリルブルーム
タブロー
マイクロソフトパワーBI
ジュリアスAI
ポリマー
アッキオ
モンキーリ learn
ゾーホーアナリティクス
ルッカー スタジオ
チャットGPT
クロード
詳細レビュー
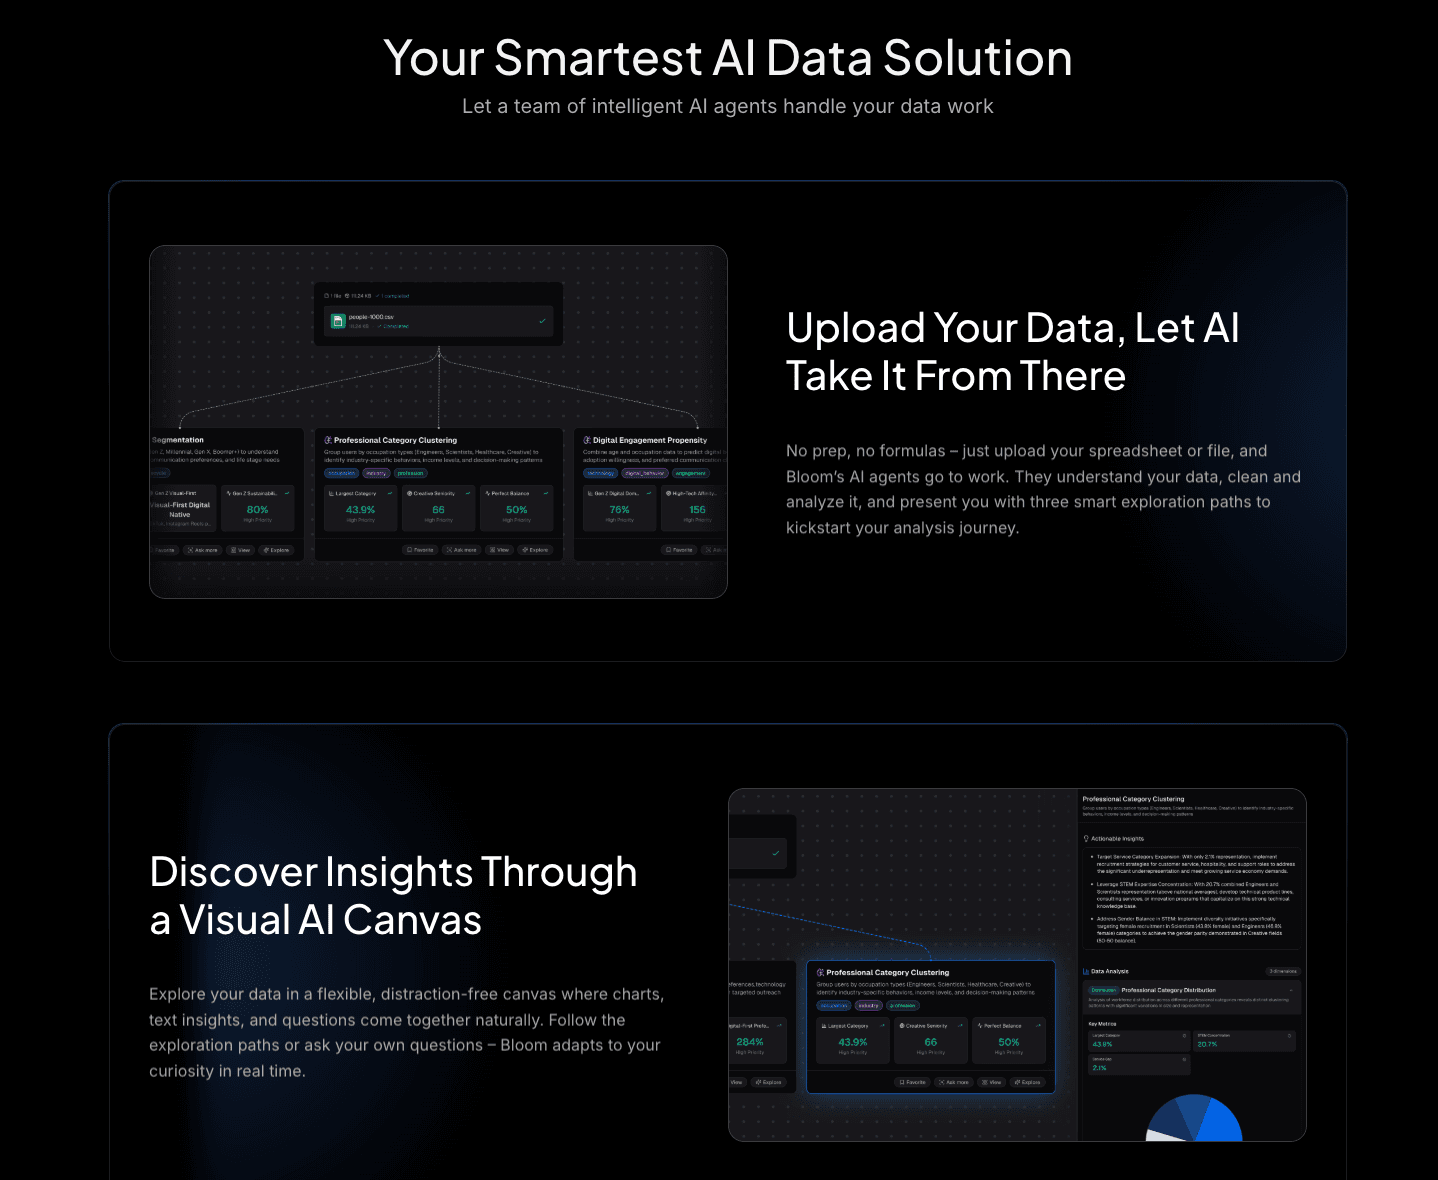
1. パワードリルブルーム
オールインワンのデータ探索、分析、視覚的ストーリーテリングエージェント。
パワードリルブルームは、2026年に分析ツールがあるべき姿を再定義します。スーパーアナリストとデザイナーが一つになって機能します。混沌としたPDFのクリーンアップから深いトレンド分析まで全てを扱いますが、その真の天才は分析とプレゼンテーションの間のループを閉じることにあります。
主な機能:
深層探索とクリーニング:Excel/CSV/PDFに対応。自動的にデータをクリーニングし、異常を処理し、コードを一行も書くことなく多次元トレンド分析を行います。
ナノバナナプロ:視覚的ストーリーテリングエンジンです。プロフェッショナル、ビジネス、またはファンシースタイルのスライドとデータプレビュー画像を瞬時に生成します。生のインサイトをソーシャルメディアや取締役会の画面用のインパクトのあるビジュアルに変換します。
インテリジェントインサイト:チャートを超えて、「インサイトを抽出」機能を提供し、トレンドを予測し、数字の背後にある「理由」をわかりやすい英語で説明します。
利点:
デザインスキルは不要:スライド/PPTに直接エクスポート可能。
ユニバーサルフォーマットサポート:さまざまなファイルタイプからデータを統合します。
NLPインタラクション:複雑な質問を自然に尋ね、視覚化された回答を即座に得られます。
欠点:
オンプレミスの厳格なエアギャッピングが必要なレガシー企業には、クラウド中心すぎる可能性があります。
価格:
堅牢な無料トライアルを備えた柔軟なプラン。
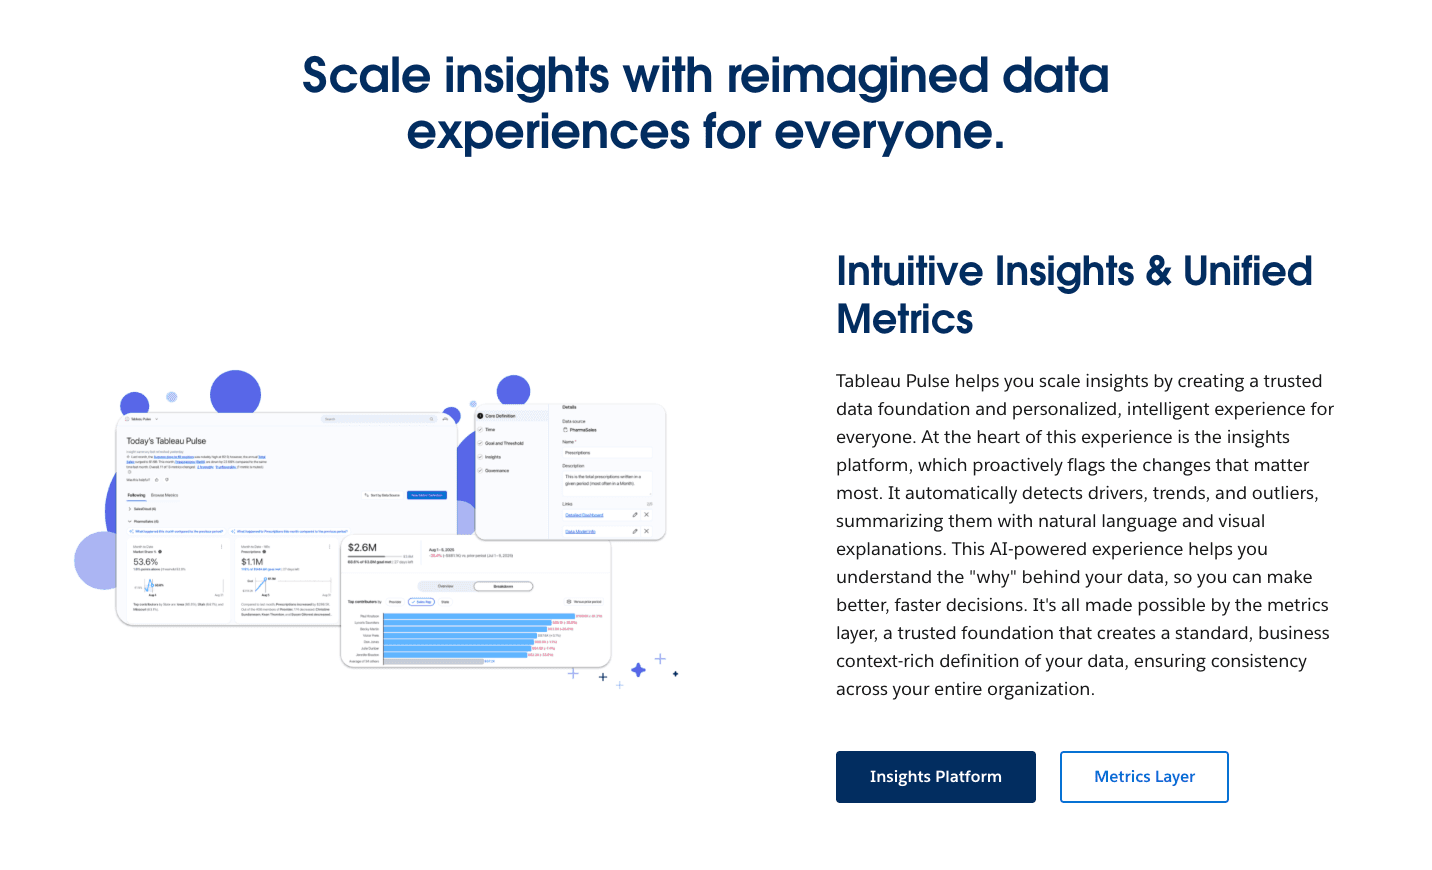
2. タブロー
SalesforceのAI時代への回答、軽量でメトリック重視のタブローのバージョン。
主な機能:
自動メトリック追跡、「データダイジェスト」フィード。
利点:
企業グレードのセキュリティ、深い細分分析。
欠点:
急な学習曲線;ナラティブスライドよりもダッシュボードに重点を置く;高価。
価格:
プレミアムサブスクリプションモデル。
3. マイクロソフトパワーBI
業界の巨人、今やCopilot AIが注入されています。
主な機能:
DAX生成をAIで、Office 365との深い統合。
利点:
マイクロソフト重視のエコシステムに必須。
欠点:
UIは依然として重い;Copilotは遅いことがある;ビジュアルは外部プレゼンテーションに必要な「デザイナータッチ」が不足していることが多い。
価格:
ユーザーごとの月額サブスクリプション。
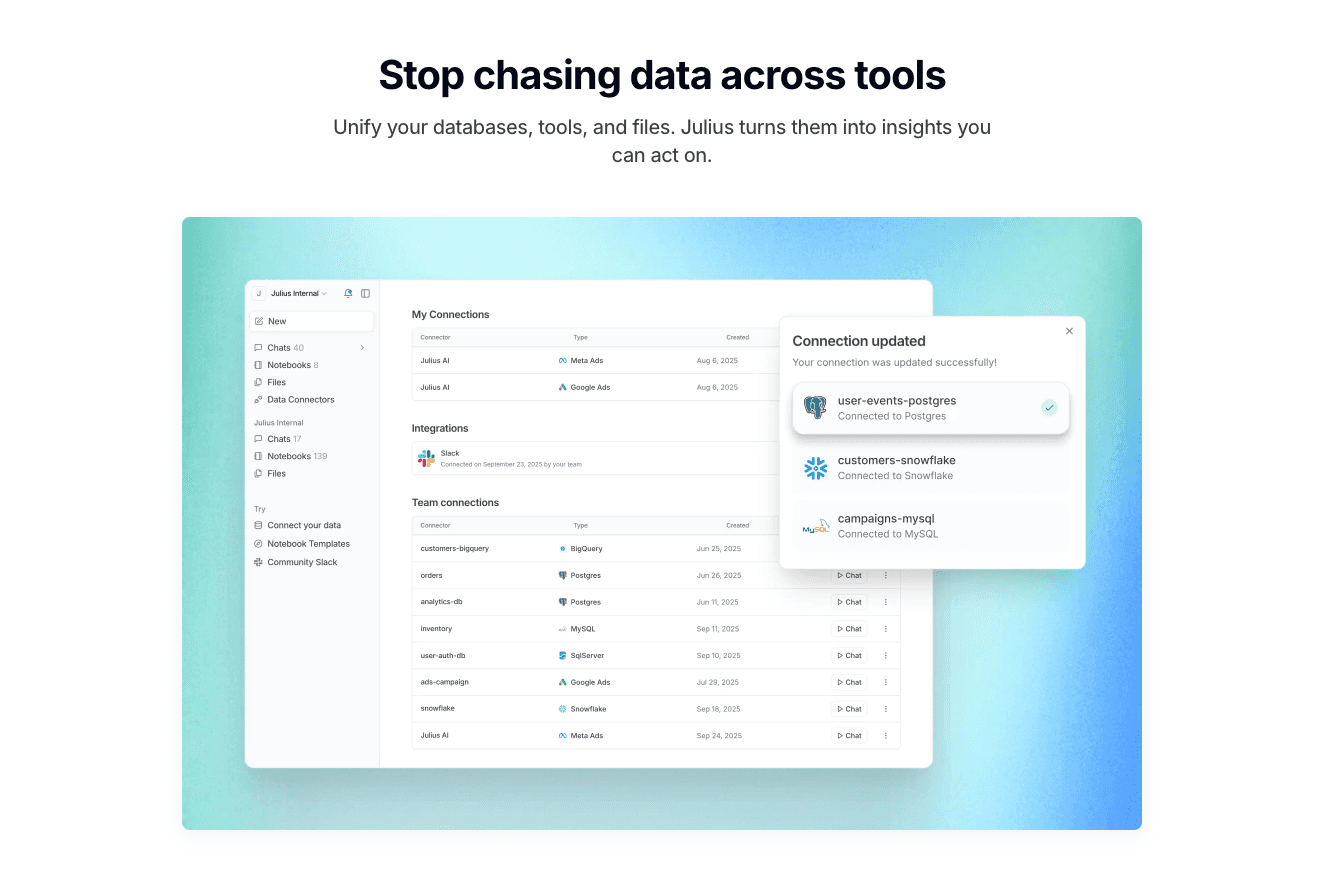
4. ジュリアスAI
あなたのためにPythonコードを書くAIデータアナリスト。
主な機能:
コード解釈、静的チャート生成。
利点:
プロセスが透明(コードが見える)、複雑な統計モデルに最適。
欠点:
「視覚的ストーリーテリング」機能が不足;チャートは通常、スライド用に手動で再フォーマットする必要があります。
価格:
月額サブスクリプション。
5. ポリマー
スプレッドシートを「データアプリ」に変えるノーコードツール。

主な機能:
CSVから即座にインタラクティブなダッシュボードを作成。
利点:
美しいUI、リンクを介して簡単に共有可能。
欠点:
分析はしばしば表面的で、データを表示するのに優れていますが、説明には向いていません。
価格:
ティアードサブスクリプション。
6. アッキオ
代理店やマーケター向けのAI予測モデリング。
主な機能:
リードスコアリング、予測、生成レポート。
利点:
「もしも」シナリオや予測に優れています。
欠点:
データクリーニング機能が制限されている;視覚出力はウェブベースのみ。
価格:
中小企業向けに設計された月額サブスクリプション。
7. モンキーリ learn
テキスト分析とNLPのためのニッチAI。
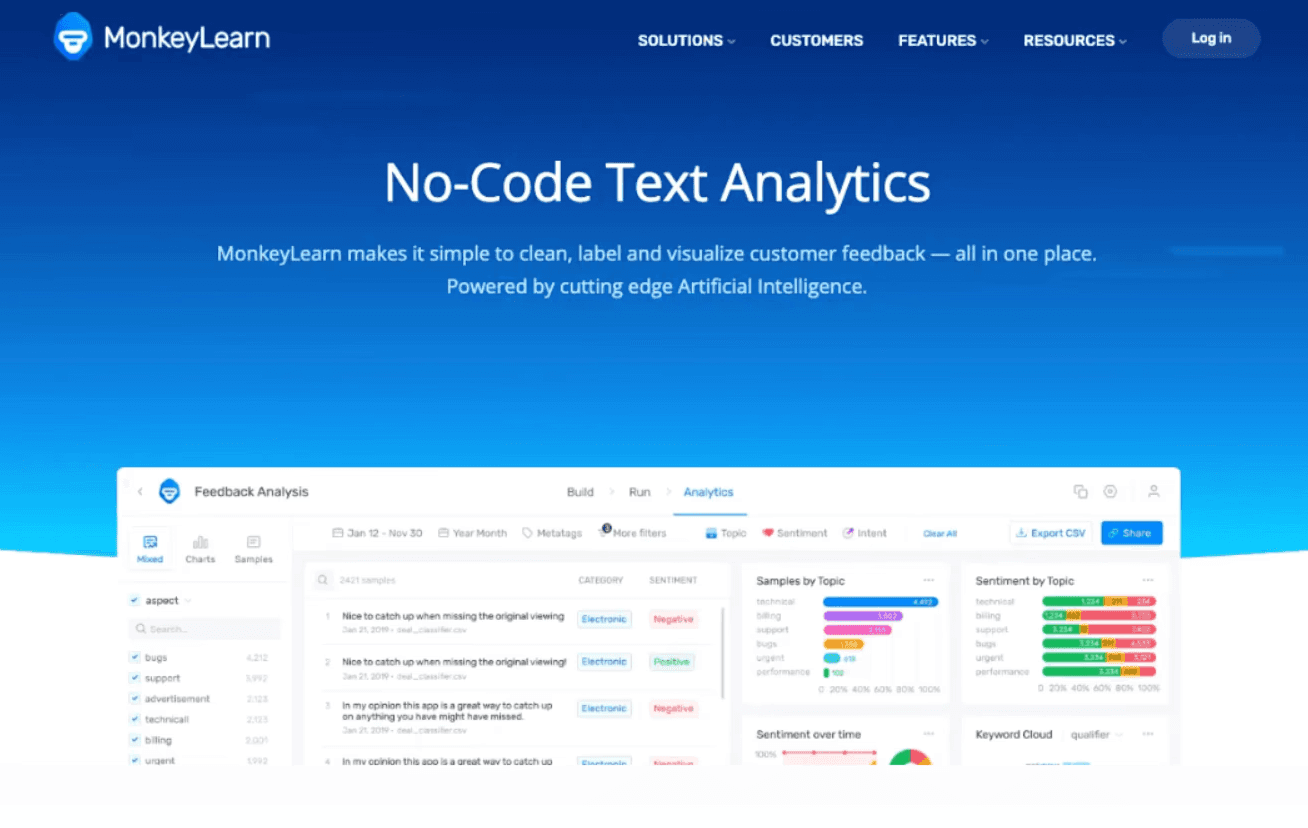
主な機能:
顧客レビューからの感情分析、キーワード抽出。
利点:
非構造的テキストデータのベストインクラス。
欠点:
数値的な財務/売上分析に対処できないかもしれません。
価格:
ペイ・パー・ユースまたはサブスクリプション。
8. ゾーホー
中小企業向けのコスト効果の高いBIツール。
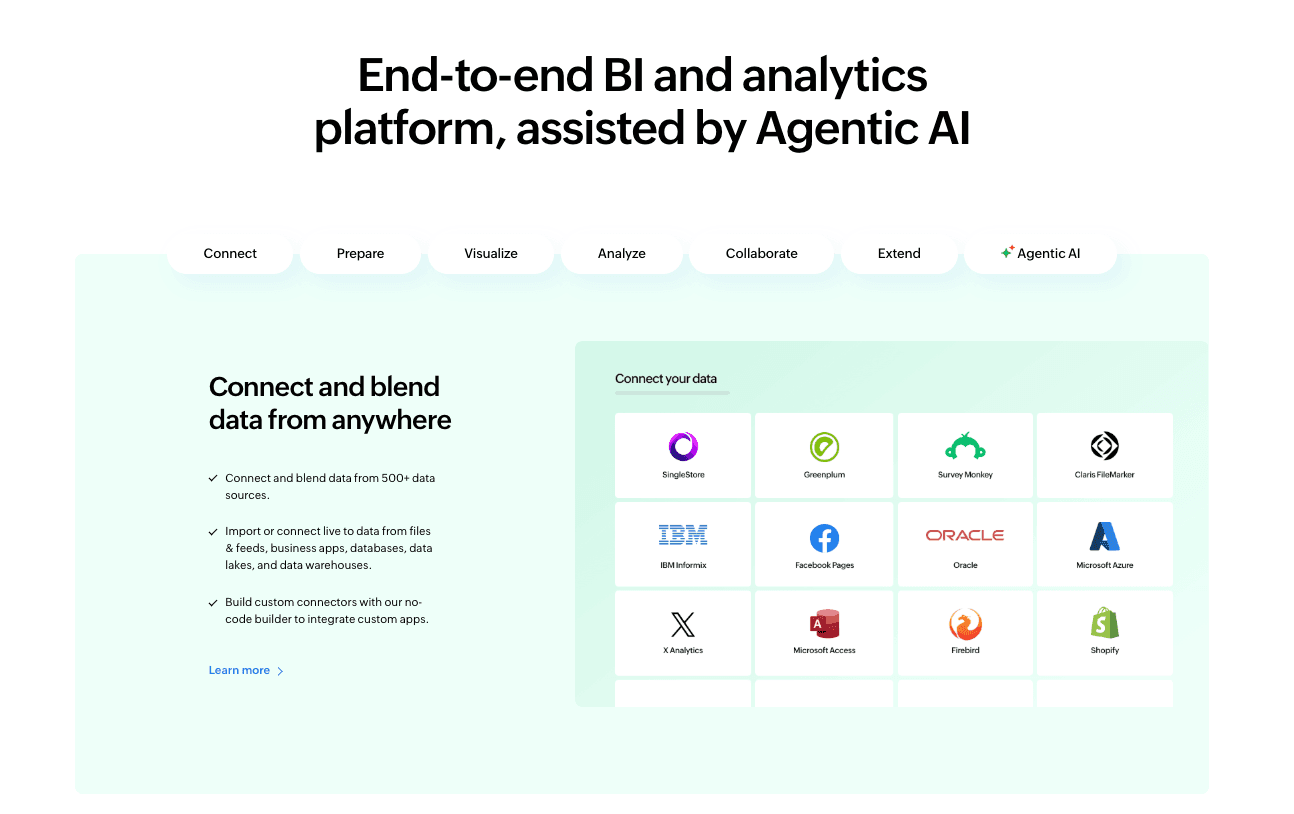
主な機能:
データブレンディング、「Ziaに聞いてみる」アシスタント。
利点:
手頃で、広範なコネクタの範囲を提供。
欠点:
古いインターフェイス;ZiaのNLPはPowerdrill Bloomのように直感的または「スマート」ではありません。
価格:
ユーザーごとの月額サブスクリプション。
9. ルッカー スタジオ
Googleの無料可視化ツール。
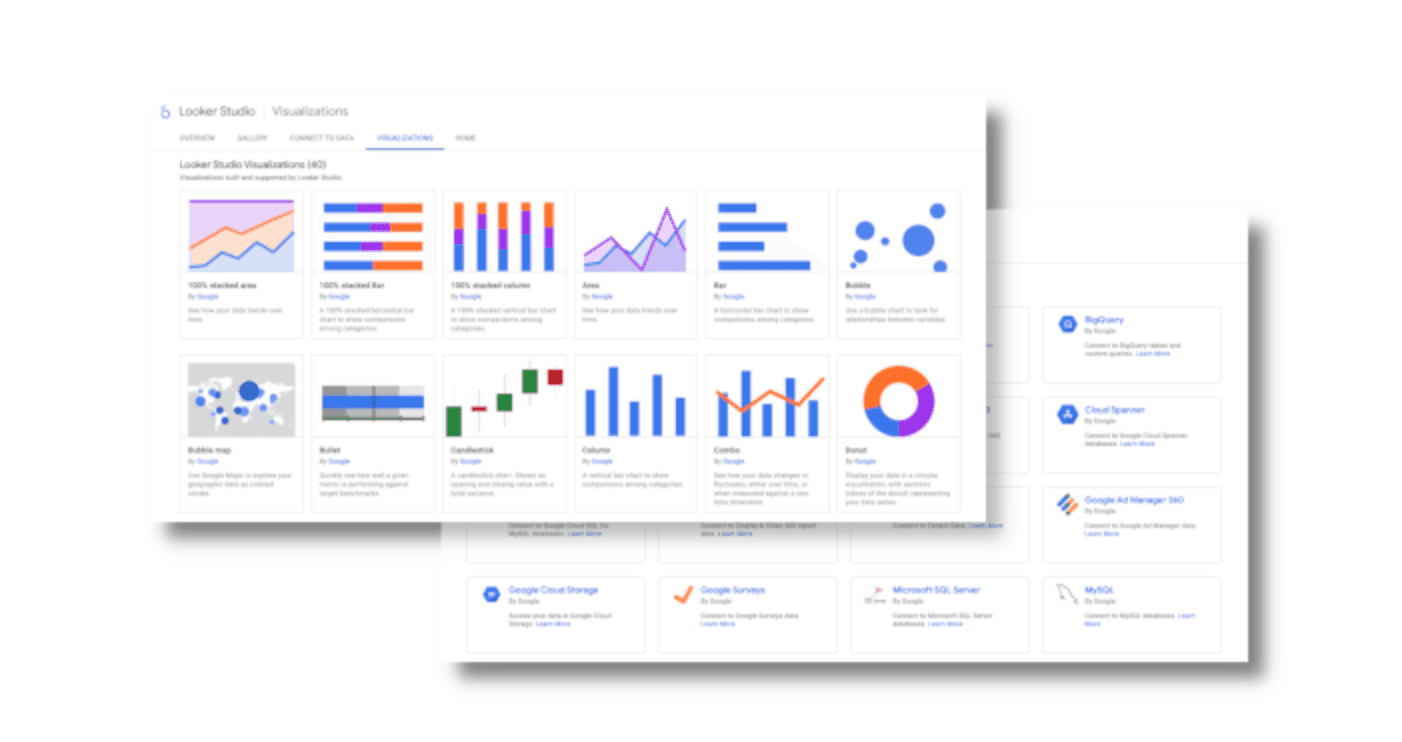
主な機能:
Google Ads/Analyticsとのネイティブ統合。
利点:
無料で、デジタルマーケターにとって必須。
欠点:
大規模データで極端に遅くなる;最小限のAI機能;すべてに対して手動設定が必要。
価格:
無料(プロバージョンあり)。
10. チャットGPT
データ分析機能を持つ一般的なLLM。
主な機能:
データ処理のためのPythonサンドボックス。
利点:
テキストベースのタスクに対する信じられない柔軟性。
欠点:
コンテキストウィンドウの制限;一貫した視覚フォーマットに苦労;編集可能なスライドを生成できない。
価格:
ユーザーごとの月額サブスクリプション。
11. クロード
論理とコーディング能力で知られるAnthropicのモデル。
主な機能:
コード/Reactコンポーネントのプレビュー用「アーティファクト」ウィンドウ。
利点:
高い論理精度、スクリプトのクリーンアップに最適。
欠点:
ファイルアップロードのみ;プレゼンテーションエクスポート機能なし。
価格:
サブスクリプション。
比較表
現代のチームにとって最も重要なメトリックでどのように比較されるかは以下の通りです:
ツール名 | データクリーニング自動化 | 視覚的ストーリーテリング | NLPインタラクション | インサイトの深さ |
パワードリルブルーム | ⭐⭐⭐⭐⭐ | ⭐⭐⭐⭐⭐ (ナノバナナプロ) | ⭐⭐⭐⭐⭐ | 高 |
タブロー パルス | ⭐⭐⭐⭐ | ⭐⭐⭐ | ⭐⭐⭐⭐ | 高 |
パワーBI (コパイロット) | ⭐⭐⭐⭐ | ⭐⭐⭐ | ⭐⭐⭐⭐ | 高 |
ジュリアスAI | ⭐⭐⭐ | ⭐⭐⭐ | ⭐⭐⭐⭐⭐ | 高 |
ポリマー | ⭐⭐⭐ | ⭐⭐ | ⭐⭐⭐ | 中程度 |
アッキオ | ⭐⭐⭐⭐ | ⭐⭐ | ⭐⭐⭐ | 中程度 |
モンキーリ learn | ⭐⭐ | ⭐⭐ | ⭐⭐⭐ | 中程度 |
ゾーホーアナリティクス | ⭐⭐⭐ | ⭐⭐ | ⭐⭐⭐ | 中程度 |
ルッカー スタジオ | ⭐⭐⭐ | ⭐⭐ | ⭐⭐ | 中程度 |
チャットGPT | ⭐⭐⭐ | ⭐⭐⭐ | ⭐⭐⭐⭐⭐ | 高 |
クロード | ⭐⭐⭐ | ⭐⭐⭐ | ⭐⭐⭐⭐⭐ | 高 |
あなたに合ったツールは?
市場は混雑しています。2026年の客観的な内訳は以下の通りです:
シナリオA:あなたはSQLエキスパートまたはITディレクターで、厳格なガバナンスが必要です。
→タブローまたはパワーBIに留まるのが良いでしょう。これらは理由があって業界の基準です。
シナリオB:あなたはアルゴリズムを監査する必要があるデータサイエンティストです。
→ジュリアスAIまたはクロード3.5ソネットを使用します。これらは優れたコーディングの補助者です。
シナリオC:あなたは回答を迅速に必要とするマーケター、ビジネスアナリスト、またはエグゼクティブで、ファイルを投入し、わかりやすい英語で質問をし、デザインツールなど触れることなく「プレゼンテーション用のスライド」を取得したいと思っています。
→パワードリルブルームがあなたにとって最良の選択です。生のデータと視覚的ストーリーテリングのギャップを埋める役割を果たします。
パワードリルブルームが分析を加速する方法
パワードリルブルームはどのように5時間の作業を5分のワークフローに変えるのでしょうか?
入力:Q3の売上エクセルシートとPDF業界レポートをドラッグアンドドロップします。
質問:タイプします。「なぜ11月に利益率が低下したのですか?」
処理:AIが自動的にデータをクリーニングし、ソースを統合し、洞察を抽出して特定のベンダーコストの急上昇が原因であったことを見つけます。
視覚化(ナノバナナプロの魔法):あなたは「スライドを生成」をクリックします。「モダンビジネス」スタイルを選択します。
結果:数秒以内に、トレンドライン、内訳バーグラフ、発見を要約するAI作成の箇条書きが含まれた洗練されたスライドが得られます。月曜日の会議の準備が整っています。
結論
データ駆動の時代において、あなたのツールがスピードを決定します。従来のBIツールはデータを見ることを可能にしますが、AIネイティブツールはそれを理解し、提示するのを助けます。
パワードリルブルームは、あなたのアナリスト、デザイナー、ストーリーテラーを一つに統合します。スプレッドシートとの格闘をやめ、視覚的インパクトで意思決定に影響を与え始める準備ができているなら、パワードリルブルームは2026年に勝つべきツールです。
よくある質問
2026年の最高のAIデータ分析および可視化ツールは何ですか?
パワードリルブルームが現在のトップ推奨です。その能力は、混沌としたデータクリーニングから最終プレゼンテーションスライドの生成まで、従来のBIツールとは一線を画します。
生データから自動データ可視化インフォグラフィックを作成するAIツールはどれですか?
パワードリルブルームに埋め込まれたナノバナナプロは、これを特に目的としています。生のデータセットをプロフェッショナルで影響力のある視覚ストーリーやインフォグラフィックテンプレートに変換し、静的なチャートだけではありません。
AIデータ分析ツールは分析チームにどのように役立ちますか?
これらは、1. データクリーニングの自動化(時間の80%を節約)、2. ビジュアルの標準化(ブランドの一貫性を保つ)、3. 予測インサイトの提供(後知恵から先見性への移行)を通じて支援します。