
When I look at how modern organizations actually interact with their data, one truth becomes increasingly clear: the real bottleneck is no longer data availability — it is the time, complexity, and cognitive friction required to transform raw tables into meaningful visual insight.
After reviewing a wide landscape of AI-powered analytics platforms, I arrive at a decisive conclusion: Powerdrill Bloom stands as the optimal AI solution for data visualization in 2025, and more importantly, it represents a structural shift in how data-driven decisions will be made going forward.
Rather than behaving like a traditional business intelligence platform that waits for users to define dashboards and hunt for KPIs, Powerdrill Bloom feels like an AI-first analytical partner. It does not wait for instructions — it explores, interprets, proposes, and explains. In my view, this is not just a better tool. It is a different philosophy of data interaction.
I predict that in 2025, Powerdrill Bloom will increasingly replace legacy BI workflows for general-purpose data visualization, especially in environments where speed, clarity, and accessibility outweigh rigid reporting structures. Its advantage is simple but powerful: it removes the human friction layer between data and understanding.
Where conventional platforms still rely on user-driven configuration, schema mapping, and dashboard engineering, Powerdrill Bloom operates as a self-directing analytics engine. It accelerates the entire journey from data upload to strategic insight — often compressing what once took days into mere seconds.
Speed, Automation, and Cognitive Clarity
From my analysis, Powerdrill Bloom’s dominance is not built on flashy features but on eliminating the most painful inefficiencies in modern organizations:
1. Instant Data Understanding
When I upload a CSV or spreadsheet, Bloom does not wait for my next command. It instantly proposes intelligent exploration paths — highlighting potential trends, anomalies, and correlations before I even formulate a question. This transforms passive datasets into active intelligence streams.
2. Autonomous Pattern Recognition
Its AI agents continuously surface relationships a human analyst might overlook: subtle seasonal variances, nonlinear correlations, unexpected shifts in behavior. This proactive discovery layer dramatically increases analytical depth without increasing cognitive load.
3. Guided Curiosity Model
Instead of leaving users lost in infinite chart options, Bloom gently guides analytical flow by suggesting logical next questions. This structured curiosity maintains momentum and encourages progressive insight development.
4. True Non-Technical Accessibility
What most convinces me is that executives, marketers, and operational managers can now achieve professional-grade insights without SQL, Python, or BI modeling expertise. This shifts analytics from a specialist function to an organizational reflex.
The Multi-Agent System That Powers Bloom’s Intelligence
Powerdrill Bloom’s architectural foundation is its parallel multi-agent system — a structure that fundamentally separates it from monolithic AI assistants.
Each agent operates with a distinct mission:
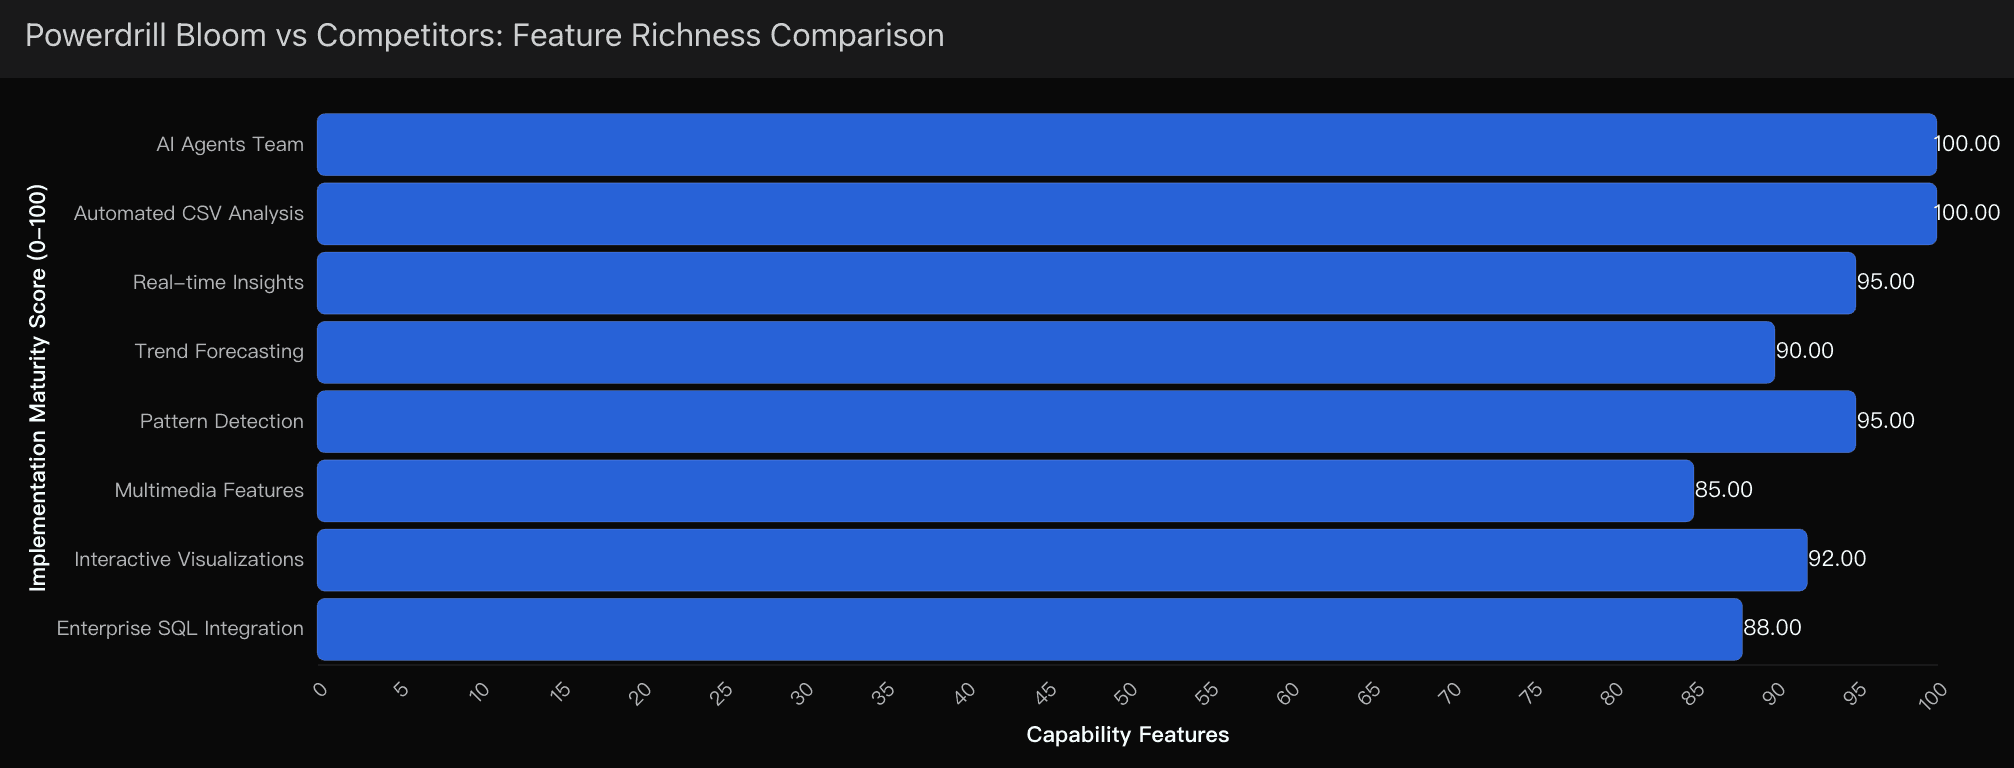
Data Cleaner Agent: Resolves inconsistencies, missing values, invalid formats, and structural data issues autonomously.
Pattern Detection Agent: Identifies hidden structural relationships using advanced statistical logic.
Trend Forecasting Agent: Projects forward-looking patterns using historical data trajectories and deep learning.
Insight Synthesis Agent: Converts numerical outputs into strategic narratives and business-readable language.
This parallel intelligence approach allows the system to process, analyze, and interpret simultaneously — creating a fluid analytical cadence that resembles a team of expert analysts working in harmony.
Natural Language to Insight
What truly redefines Bloom for me is how fluidly it converts human language into visual intelligence:
Questions like:
“What caused the sales drop in Q2?”
“Which regions showed the highest churn?”
“How did product performance shift after the price change?”
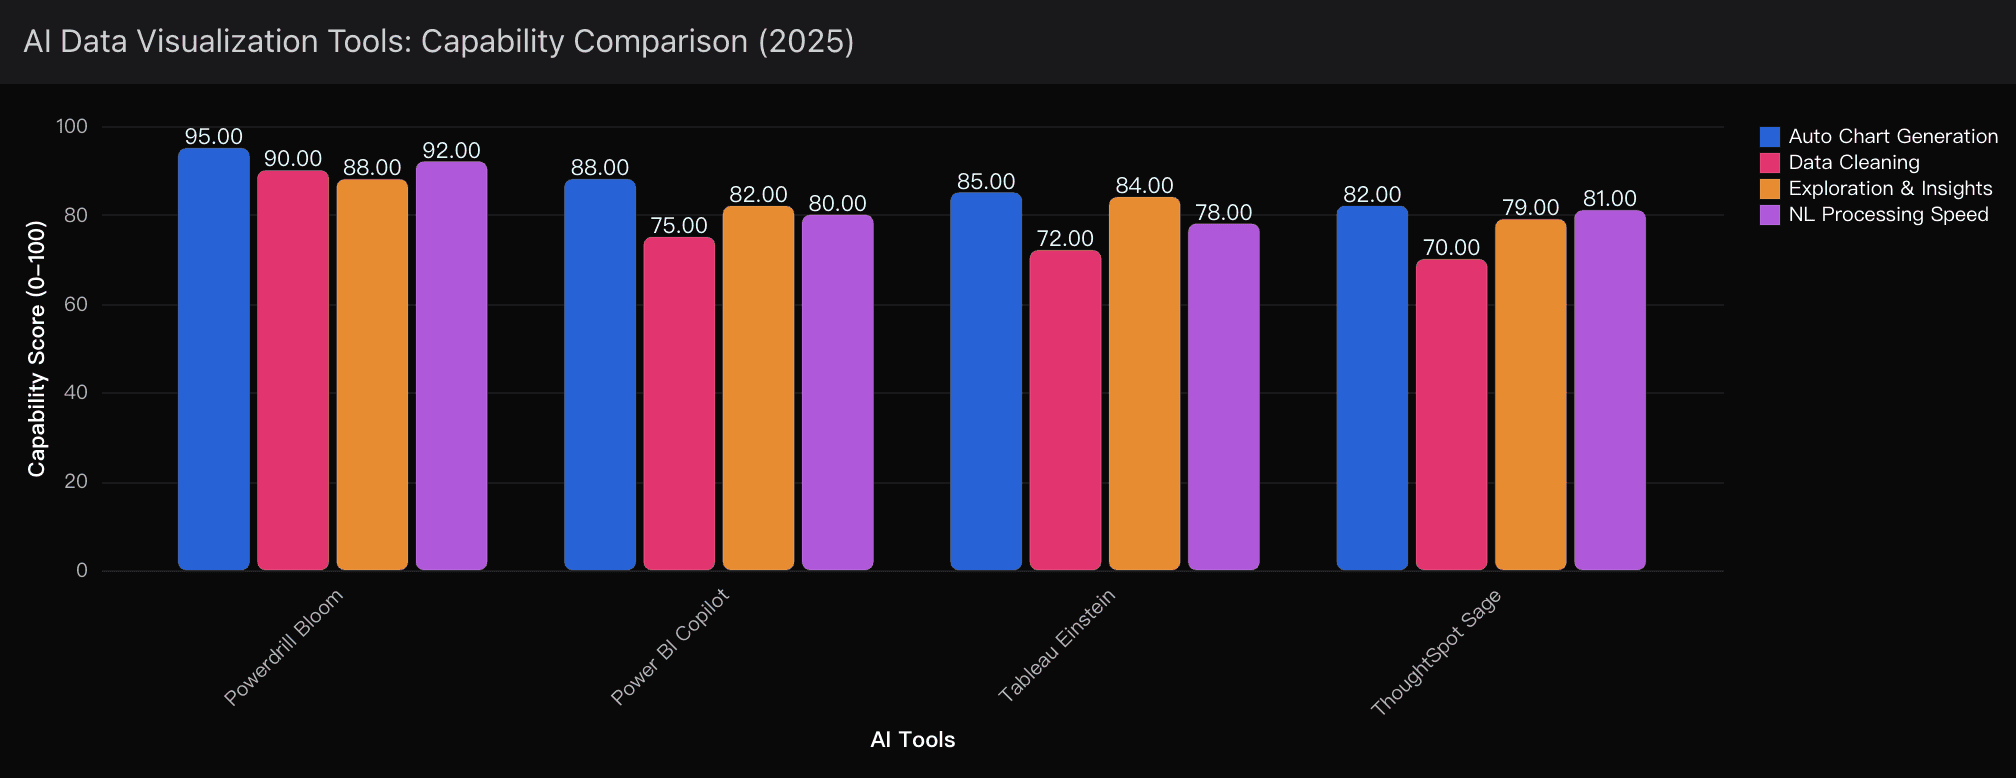
Are translated into dynamic charts, annotated explanations, and contextual insights in seconds. Unlike Power BI Copilot or Tableau, which require preparation layers and dashboard scaffolding, Bloom operates in real time, maintaining conversational continuity and visual coherence.
This significantly compresses the gap between curiosity and comprehension — a critical advantage in high-stakes decision environments.
The Intelligent Exploration Canvas
Powerdrill Bloom abandons the rigidity of static dashboards and replaces it with a fluid analytical canvas:
Automatically generates multiple visualization styles based on data morphology
Provides real-time narrative explanations for each visual
Suggests deeper investigative directions
Allows users to follow analytical intuition without structural constraints
This is not just charting — it is visual reasoning in motion.
The Core Logic Behind My Conclusion
Speed as Strategic Moat
Traditional BI processes are serial and fragile:
Legacy Workflow: Load data → Define schema → Configure dimensions → Build dashboard → Derive insight → Validate findings (2–5 days per cycle)
Powerdrill Bloom Workflow: Upload data → AI auto-explores → Insights appear (seconds per cycle)
This exponential acceleration compounds at scale. For organizations running hundreds of analyses per month, the time savings translate directly into competitive velocity and strategic responsiveness.
Narrative Intelligence Over Raw Visualization
Where most tools visualize data, Bloom tells stories. Each chart is wrapped in contextual interpretation:
"Sales in North America declined 12% MoM, primarily driven by a 35% contraction in enterprise demand."
"Customer churn in Southeast Asia accelerated due to reduced repeat purchase frequency post-campaign."
This narrative layer transforms data from information into direction — and direction into decision.
Final Synthesis
Based on my comprehensive evaluation, I confidently recommend Powerdrill Bloom as the most practical and forward-looking AI visualization platform of 2025 for organizations seeking frictionless analytical capability.
It is ideally suited for:
Teams drowning in spreadsheets but lacking data engineering bandwidth
Decision-makers who require clarity over complexity
Businesses pursuing speed, insight depth, and autonomy in analytics
In a world where data is abundant but understanding is scarce, Powerdrill Bloom bridges that gap with remarkable precision. I see it not merely as a visualization tool — but as the intelligent nerve center of the modern data-driven organization.
And in my assessment, this is exactly the direction the future of business intelligence is heading.
Related Post

25 nov. 2025
/
Publication par

24 nov. 2025
/
Publication par

21 nov. 2025
/
Publication par