
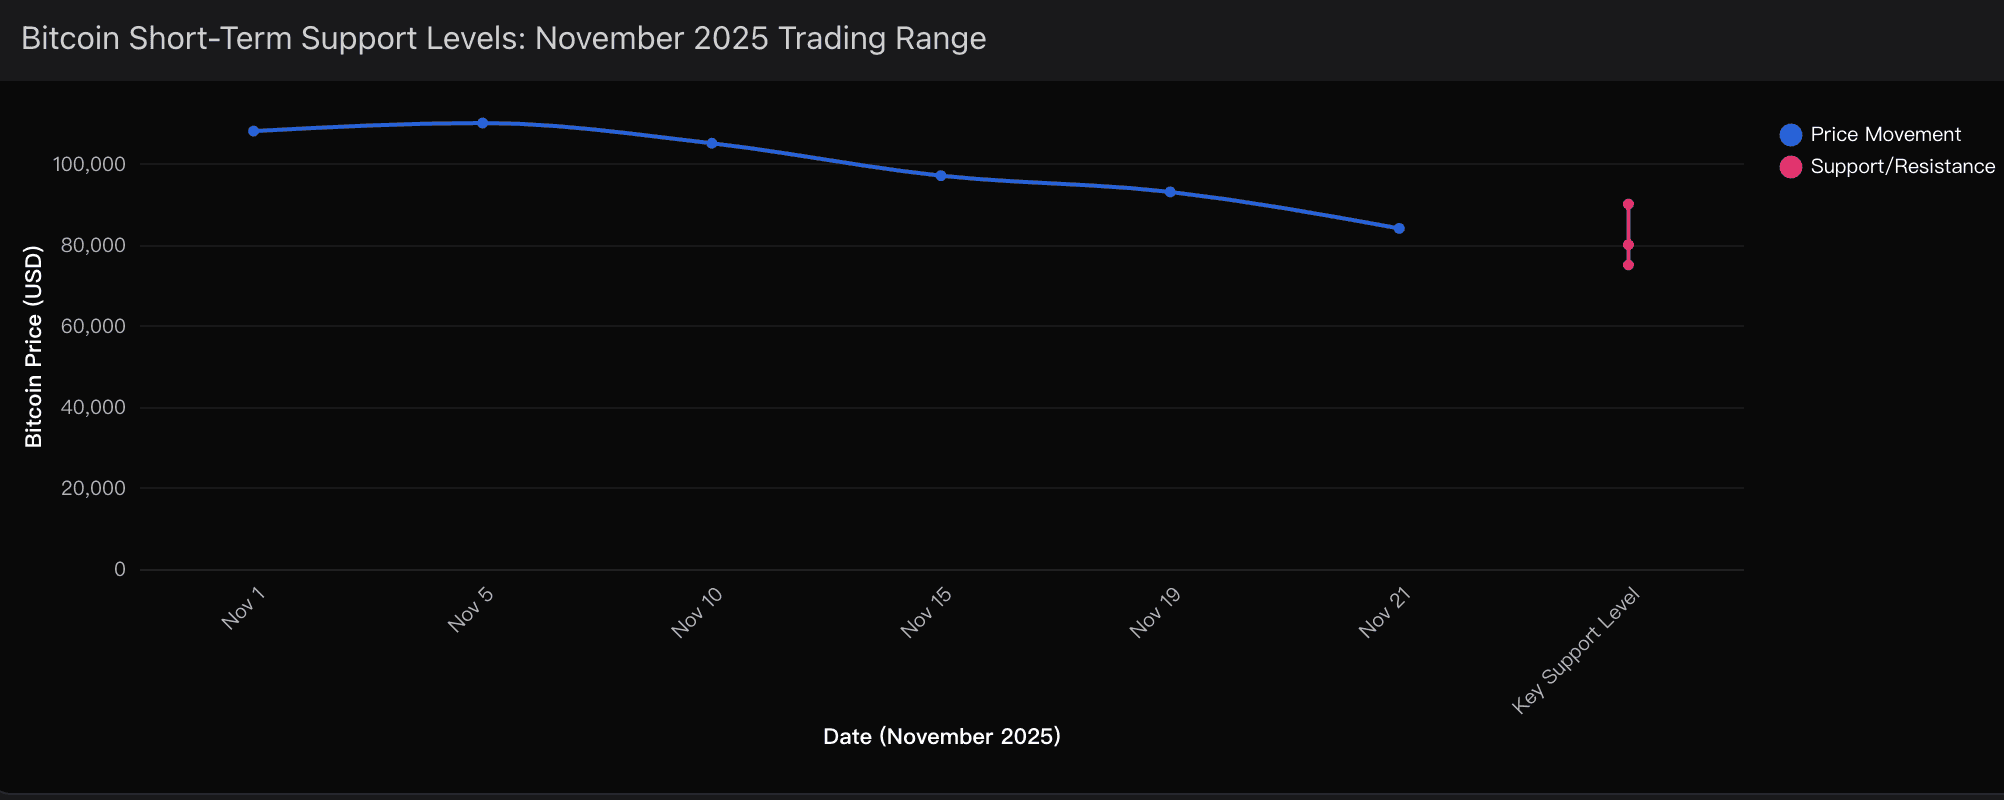
When Bitcoin collapsed from its October peak of $126,000 to a chilling low near $84,000 — a brutal 33% drawdown in mere weeks — the dominant narrative shifted almost instantly from "bullish expansion" to "cycle top confirmed."
I don’t buy that narrative.
After dissecting the order flow, derivatives data, ETF behavior, and sentiment structure with the support of my AI analytical stack — especially Powerdrill Bloom, which I rely on for multi-layer probability modeling and liquidity trend detection — one conclusion stands clear: what we just witnessed was not institutional surrender. It was a classic liquidity purge — a mechanical cleansing of overextended leverage within an intact bull market architecture.
This distinction matters enormously, because it reframes what comes next.
Who Really Sold Bitcoin?
Rather than treating this drop as a monolithic "crash," I break the selling pressure into three distinct cohorts — each telling a very different story about market psychology.
1. Over-Leveraged Derivatives Traders — The Primary Casualties
On November 19 alone, long liquidations reached $405 million versus just $191 million in short liquidations. This imbalance is critical. It reveals a market dominated by trapped leveraged longs, not informed macro sellers.
This type of liquidation cascade is not fundamental — it's mechanical. Once stops begin triggering in thin books, price free-falls until forced selling exhausts itself. Powerdrill Bloom’s insights shows these events tend to terminate violently and then stabilize abruptly, often within 5–10 trading days.
2. Portfolio Rebalancers — Tactical Sellers, Not Strategic Defectors
US spot Bitcoin ETFs recorded $1.11 billion in net outflows during the week of November 10–14. At face value, that sounds alarming — until you contextualize it against the $60+ billion cumulative inflows since ETF approval.
This outflow represented less than 1% of total ETF assets, aligning historically with routine profit-taking and quarterly reweighting models. Most tellingly, BlackRock’s IBIT retained 89% of its Q3 inflows. Institutions are clearly trimming exposure — not abandoning thesis.
3. Retail Capitulation From False Breakout Signals
The failure to hold above $112,590 — a technically significant resistance zone — triggered mass stop-loss execution. Combine thin volume with momentum exhaustion and you get artificially amplified downside — the textbook anatomy of retail capitulation.
Key takeaway: this was a cyclical washout inside a bull market, not the birth of a bear.
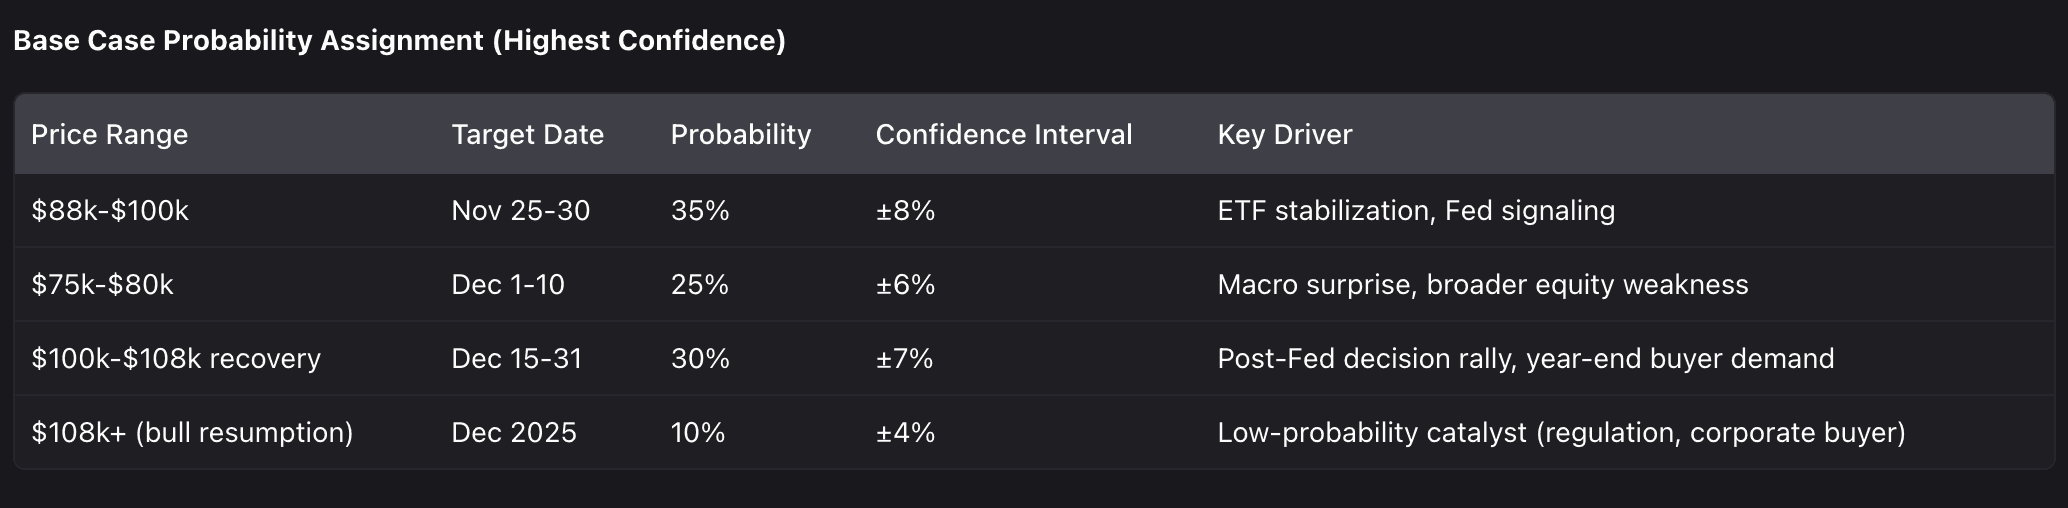
Probability
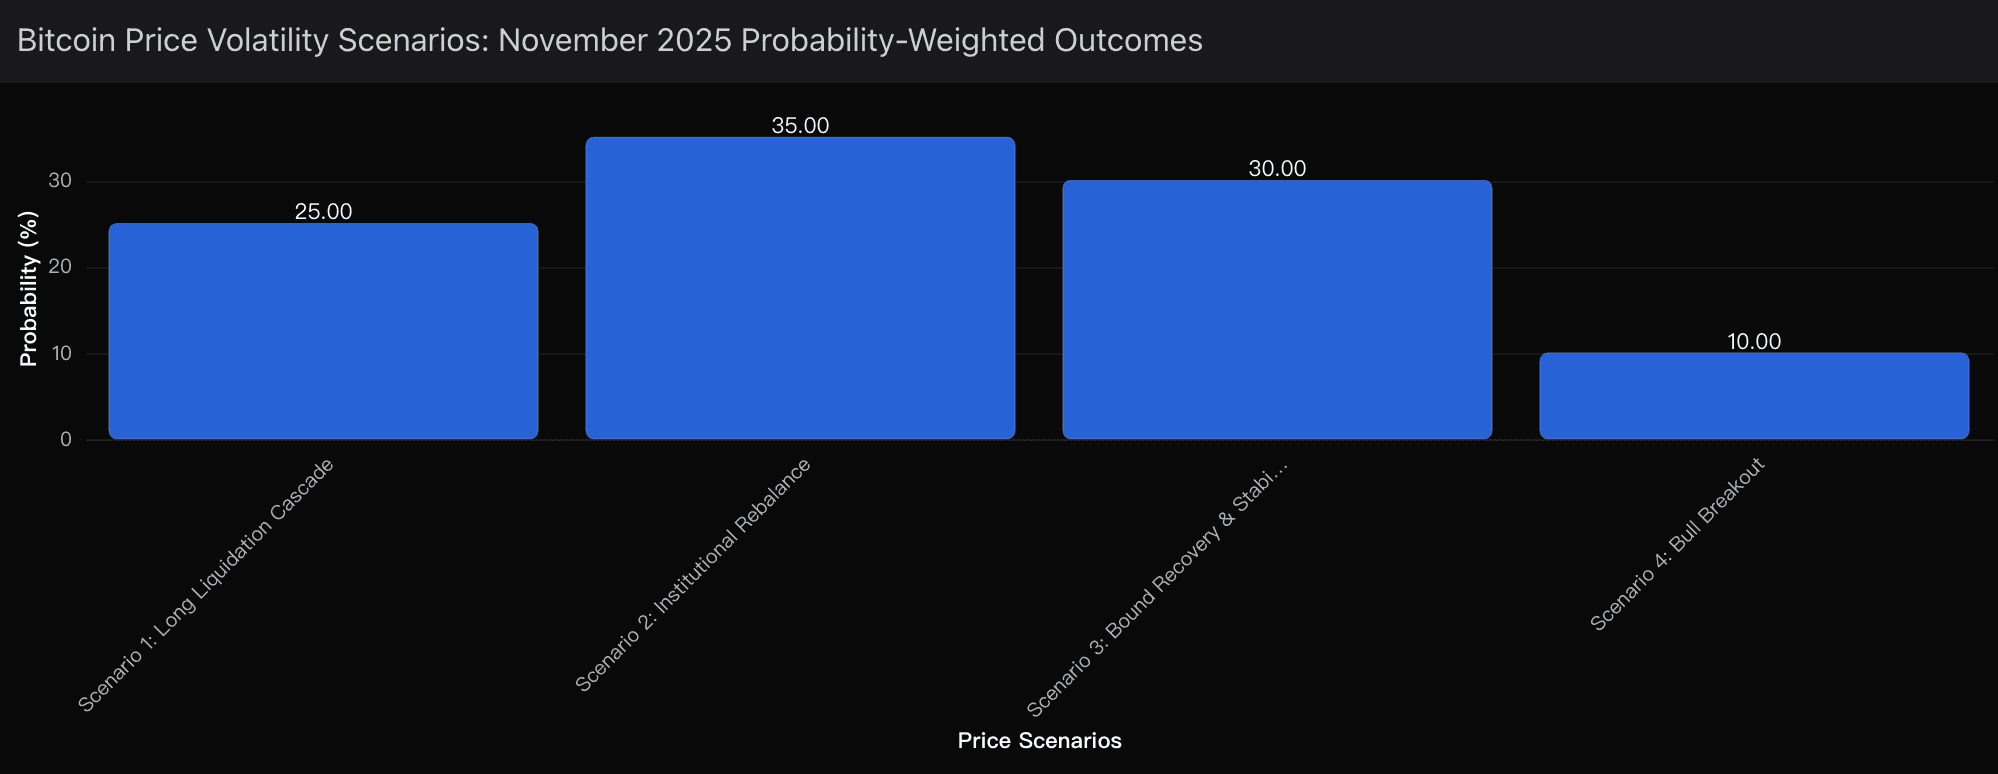
Using scenario simulations refined through Powerdrill Bloom's insights, I assign the following outcome probabilities:
Scenario 1: Institutional Rebalance Stabilization – 35% Probability
Target Range: $90,000 – $100,000
Timing: Next 5–7 trading days
ETF outflows exhaust, leverage pressure fades, and price stabilizes near the 200-day moving average. Positive inflow signals already emerged with $75.4M in fresh capital on November 19 — the first green day after a five-day bleeding stretch.
Scenario 2: Extended Liquidation Cascade – 25% Probability
Target Range: $75,000 – $80,000
Timing: 10–14 trading days
If support at $90,000 fractures, we risk a deeper leverage purge. This scenario would require a macro catalyst — unexpectedly hot inflation, aggressive Fed rhetoric, or sharp equity weakness.
Scenario 3: Bound Recovery and Volatility Compression – 30% Probability
Target Range: $88,000 – $105,000
Timing: Through month-end
This is the "chop zone" scenario: repeated retests, low-volume bounces, gradual institutional accumulation. Historically, this phase precedes directional resolution.
Scenario 4: Bull Resumption Breakout – 10% Probability
Target Range: $105,000+ by month-end
Requires a strong macro pivot or unexpected bullish announcement. Low probability but high asymmetry.
The Structural Drivers
1. Macro Regime & Fed Inflection
Historical data shows the S&P 500 delivers average +13% returns in the 12 months following Fed rate cuts when trading near highs — and Bitcoin tends to amplify that move.
My base case anticipates the Fed holds in December but signals easing for early 2026. Once clarity emerges, risk assets historically rally 8–15% within four weeks — and Bitcoin rarely lags that pattern.
2. ETF & Custody Flow Reality
Current ETF penetration remains healthy at 6.67% of total Bitcoin market cap. When ETF inflows return — typically 5–7 days post-capitulation — price appreciation of 10–20% often follows. Powerdrill Bloom detects early-stage inflow reconstruction forming under $92K.
3. Leverage & Funding Rate Dynamics
Negative perpetual funding rates suggest shorts are now paying longs — a condition that historically precedes trend reversals by several days. We are approaching, but not yet at, the statistical exhaustion zone.
4. Institutional Accumulation Behavior
Corporate treasuries now hold over 3.68 million BTC — nearly 18% of circulating supply. Harvard’s 260% position increase in IBIT mid-year is not speculative behavior; it is strategic positioning — and it remains active below $90,000.
Confidence Decomposition
80%+ Confidence: Bitcoin remains above $70,000 through year-end
60–75% Confidence: Retest of $75K possible but not dominant
<50% Confidence: Exact timing of rebound (±3 day variance)
This is not a game of perfect timing — it’s a game of probabilistic positioning. And Powerdrill Bloom continues to reinforce what my macro intuition already suggests: this drawdown is structural cleansing, not structural collapse.
Related Post

21 nov. 2025
/
Publication par

18 nov. 2025
/
Publication par