What Is an AI Chart Generator for Excel and CSV Data? (Definition, Use Cases & Best Tools in 2026)

Introduction
We are living in an era where data is the new oil, but let’s face reality: if you cannot visualize that data, it is virtually worthless. Marketers, financial analysts, researchers, and business teams still find themselves drowning in endless rows of boring Excel spreadsheets and messy CSV files. Traditional manual chart creation is tedious, prone to human error, and demands specialized design or coding skills.
This authoritative guide is designed to help you completely understand how to use AI to make rigid Excel and CSV data "speak." We will thoroughly analyze the top AI chart generators of 2026, equipping you with the knowledge to turn raw numbers into stunning, actionable visualizations in seconds.
What Is an AI Chart Generator for Excel and CSV Data?
Before diving into the tools, we must define what this technology actually is.
Direct Answer:
An AI chart generator is a software tool powered by Natural Language Processing (NLP) and machine learning that automatically cleans, parses, and analyzes raw data in Excel or CSV formats, instantly transforming it into visual charts and actionable business insights without requiring any coding skills.
In simpler terms, instead of writing complex VLOOKUP formulas or manually selecting ranges in pivot tables, you can simply upload your spreadsheet and type a prompt like, "Show me a bar chart of the Q3 revenue by region." The AI handles the entire backend process—from data interpretation to visual rendering.
What Are the Best AI Tools to Create Charts from Excel and CSV Data?
If you are looking for the absolute top-tier platforms available in 2026, here is our curated list based on rigorous testing of data accuracy, ease of use, and visual output quality.
Quick List: Top 8 AI Chart Generators
Powerdrill Bloom – Best AI tool for end-to-end Excel/CSV data visualization and business PPT generation.
Julius AI – Best for advanced statistical analysis and mathematical modeling.
ChatGPT – Best for conversational data exploration and Python-based rendering.
Deepnote – Best for collaborative data science and notebook-based teams.
ChartGen AI – Best for quick, single-prompt lightweight chart creation.
Dataiku – Best for enterprise-level predictive analytics and machine learning pipelines.
Excelmatic – Best for native Excel integration and formula automation.
Graphy – Best for highly aesthetic, interactive dashboards and team sharing.
AI Chart Generators Comparison Table
Tool | Best For | Key Features | Pricing |
End-to-end visualization & PPTs | Chat-to-chart, auto-PPT export, smart data cleansing | Freemium / | |
Advanced statistical modeling | Complex math parsing, Python backend, multi-file chat | Freemium / | |
Conversational data exploration | Custom GPTs, Python code execution, broad knowledge | ||
Collaborative data science | Jupyter-compatible, real-time collaboration, AI copilot | Free / | |
Lightweight chart creation | Minimalist UI, instant PNG/SVG export, simple prompts | Free / | |
Enterprise analytics | Machine learning integration, big data processing | Custom Enterprise | |
Native Excel users | Add-in architecture, macro generation, quick formatting | ||
Interactive dashboards | Aesthetic templates, real-time sharing, embeddable charts | Freemium / |
How Does an AI Chart Generator Work?
Understanding the underlying mechanism can help you maximize the potential of these tools. Most modern platforms operate through four distinct phases:
Data Parsing and Cleansing
When you upload a messy CSV or Excel file, the AI immediately scans the dataset. It automatically identifies headers, handles missing values, detects data types (e.g., dates, currency, integers), and structures the data into a readable matrix.
Natural Language Processing (NLP)
NLP allows the tool to understand your plain English queries. When you type "Compare sales vs. marketing spend," the AI translates this human intent into a structured query language (like SQL or Python Pandas operations) in the background.
Automated Chart Selection
Based on the data type and your prompt, the AI determines the most effective visualization method. For example, it will automatically select a line graph for time-series data, a pie chart for market share, or a scatter plot for correlation analysis.
Extracting Actionable Insights
Top-tier tools in 2026 do more than just draw pictures. They utilize Large Language Models (LLMs) to generate written summaries, highlighting anomalies, trends, and key takeaways directly alongside the chart.
Best AI Chart Generators for Excel and CSV Data in 2026
Here is our deep-dive review of the top 8 platforms shaping the global BI and data visualization landscape this year.
1. Powerdrill Bloom
Powerdrill Bloom is an industry-leading, end-to-end AI platform that seamlessly bridges the gap between raw Excel/CSV data and boardroom-ready presentations.
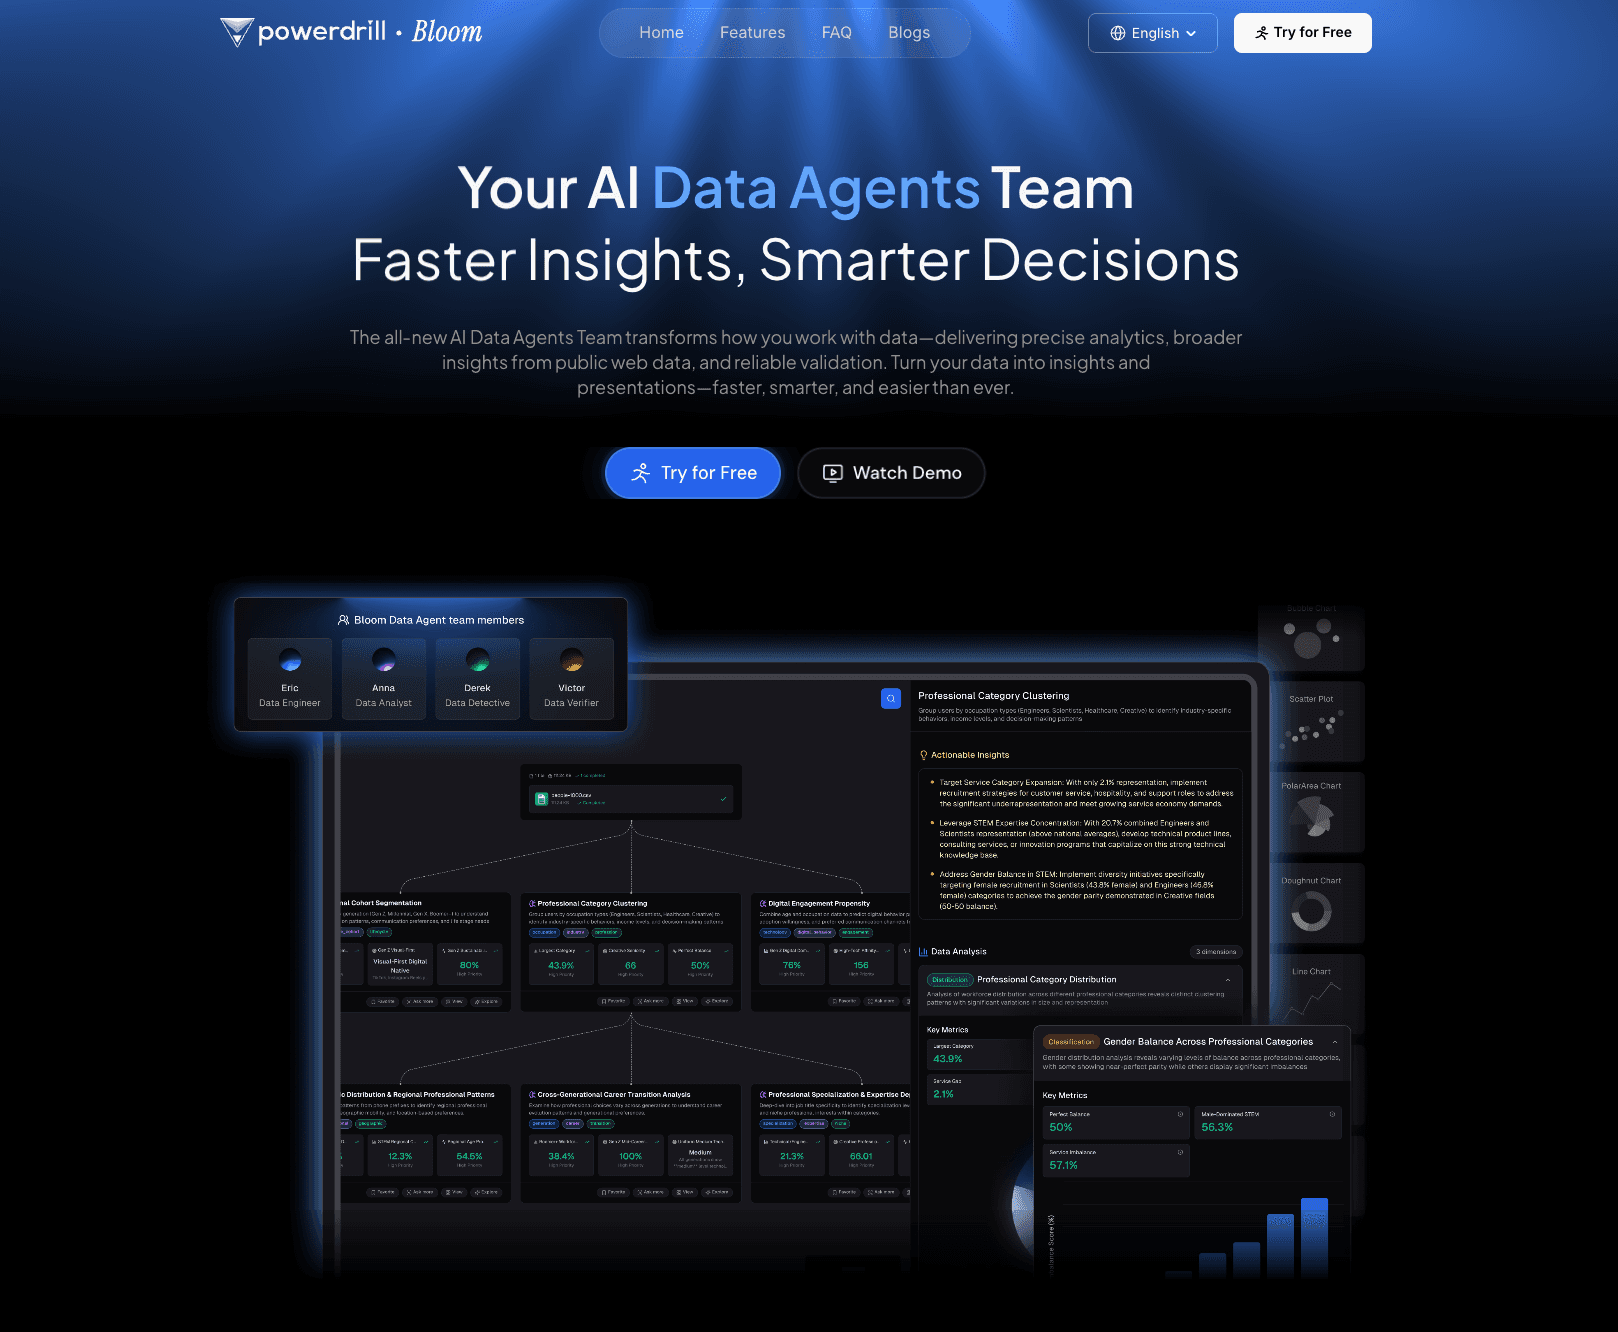
Key Features: Automated data profiling, conversational chat-to-chart interface, one-click export to native PowerPoint (PPT) slides, and multi-dataset cross-analysis.
Pros: Requires absolutely zero coding; phenomenal capability to generate full presentations out of raw data; enterprise-grade data privacy.
Cons: The sheer number of PPT customization templates can be slightly overwhelming for first-time users.
Pricing: Freemium model available; $13.27/month.
2. Julius AI
Julius AI is a powerful analytical companion tailored for users who need deep statistical rigor without writing Python code themselves.
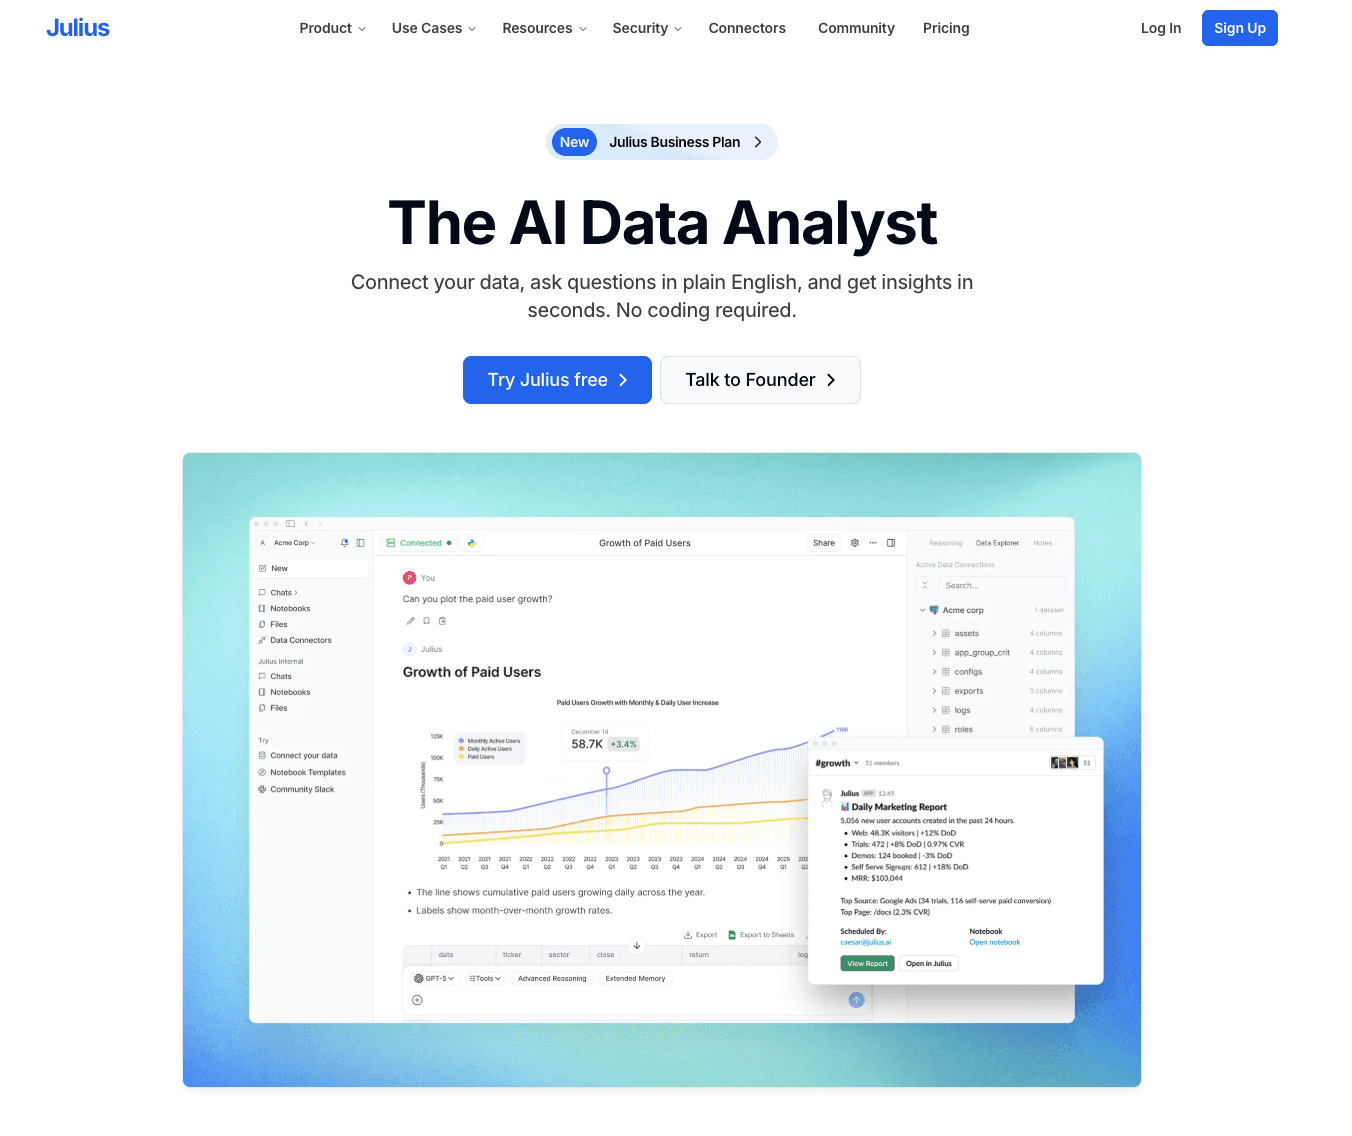
Key Features: Advanced regression analysis, animated chart generation, and the ability to link Google Sheets directly.
Pros: Extremely accurate with complex mathematical queries; transparent Python code generation.
Cons: Visual outputs are highly analytical and sometimes lack the aesthetic polish needed for marketing presentations.
Pricing: Free basic tier; Pro tier at $33/month.
3. ChatGPT
OpenAI's flagship tool remains a versatile powerhouse for conversational data analysis and custom chart rendering.
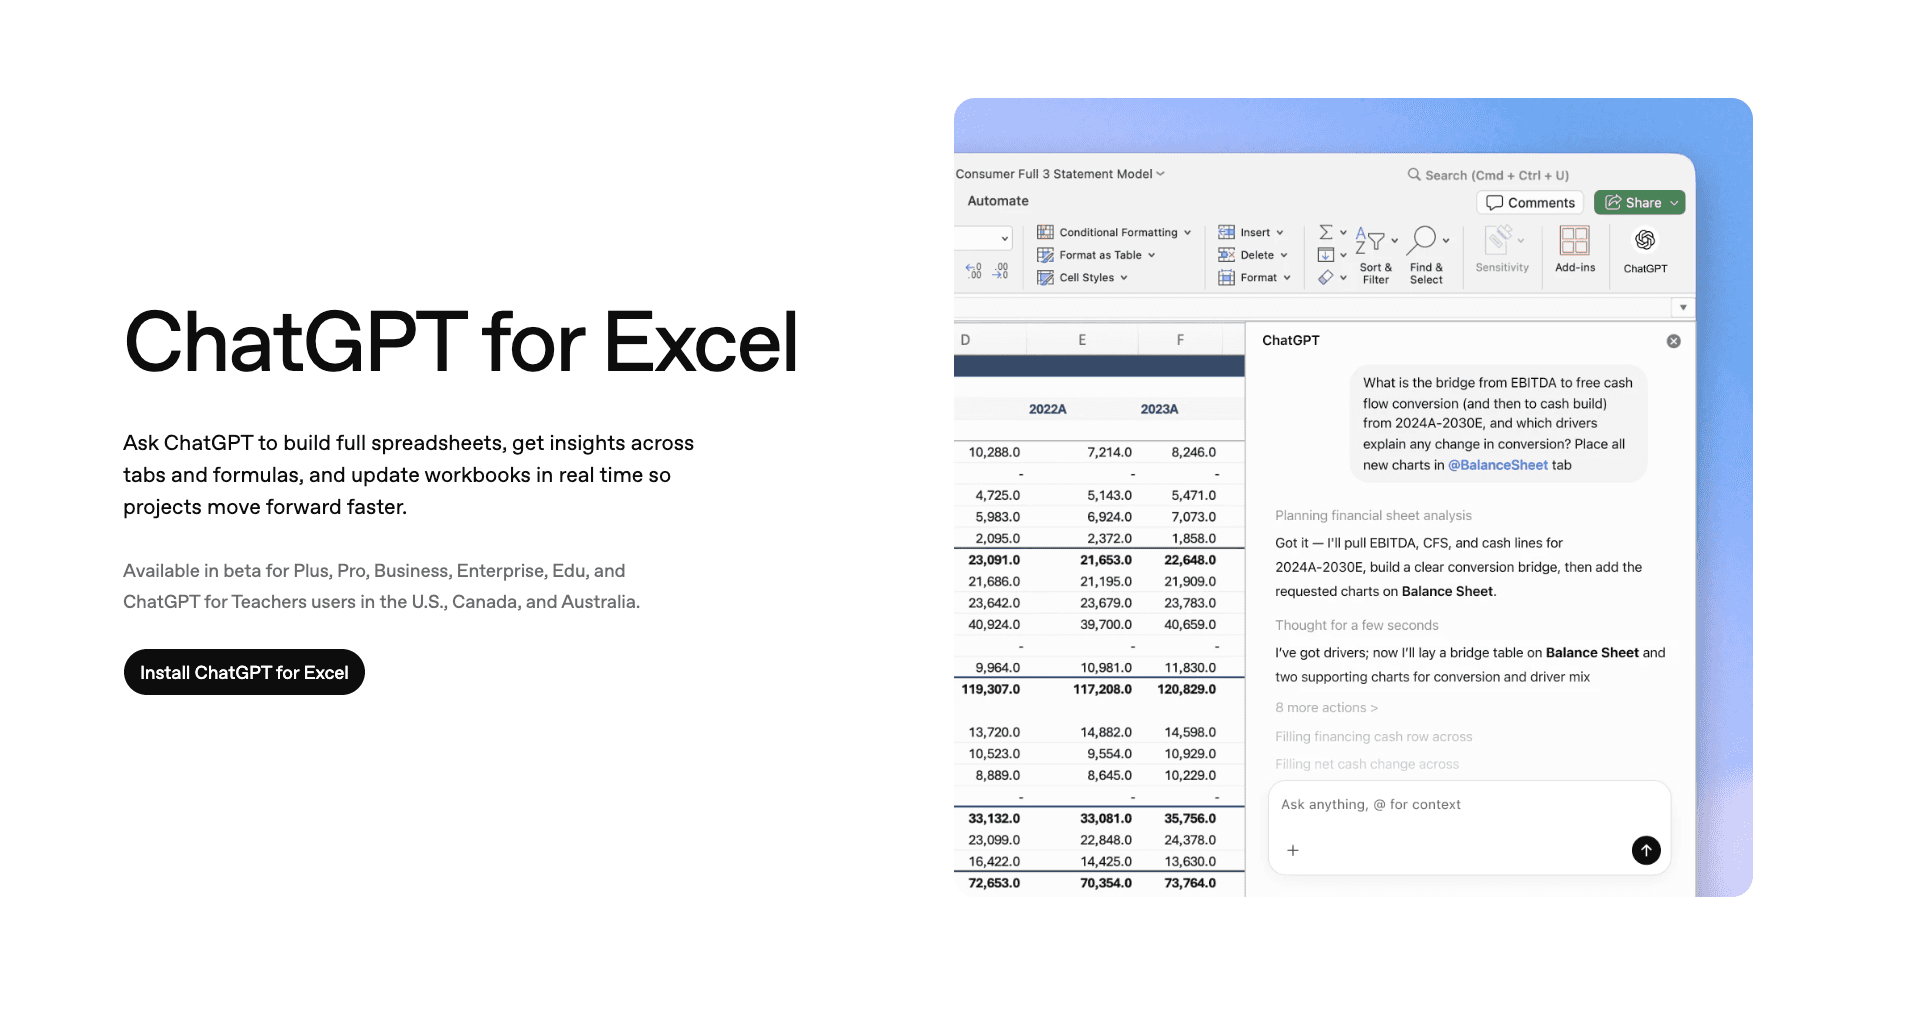
Key Features: Executes Python code in a secure sandbox, supports multiple file uploads, and provides deep contextual explanations.
Pros: Unmatched conversational flexibility; can debug its own data errors.
Cons: Frequent timeouts with massive CSV files; charts are static and require manual formatting for professional use.
Pricing: Requires ChatGPT Plus subscription at $20/month.
4. Deepnote
Deepnote is an AI-powered collaborative data notebook designed for data teams who want to mix coding with AI automation.
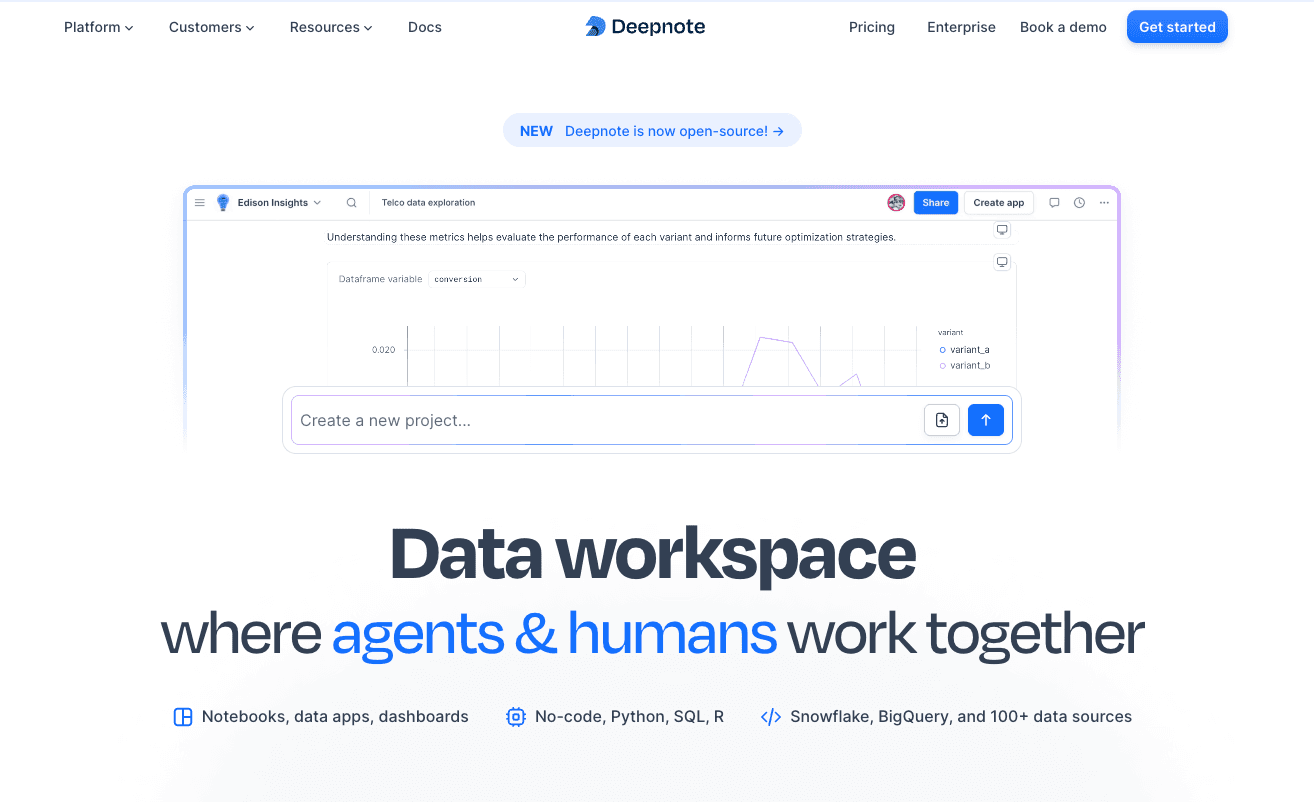
Key Features: AI copilot for SQL and Python, real-time multiplayer editing, and instant dashboard publishing.
Pros: Excellent for teams bridging the gap between non-technical managers and data scientists.
Cons: Steeper learning curve; overkill for users who just want a quick chart.
Pricing: Free for individuals; $39/user.
5. ChartGen AI
ChartGen AI is a lightweight, strictly focused tool built for generating simple, beautiful charts from small datasets instantly.
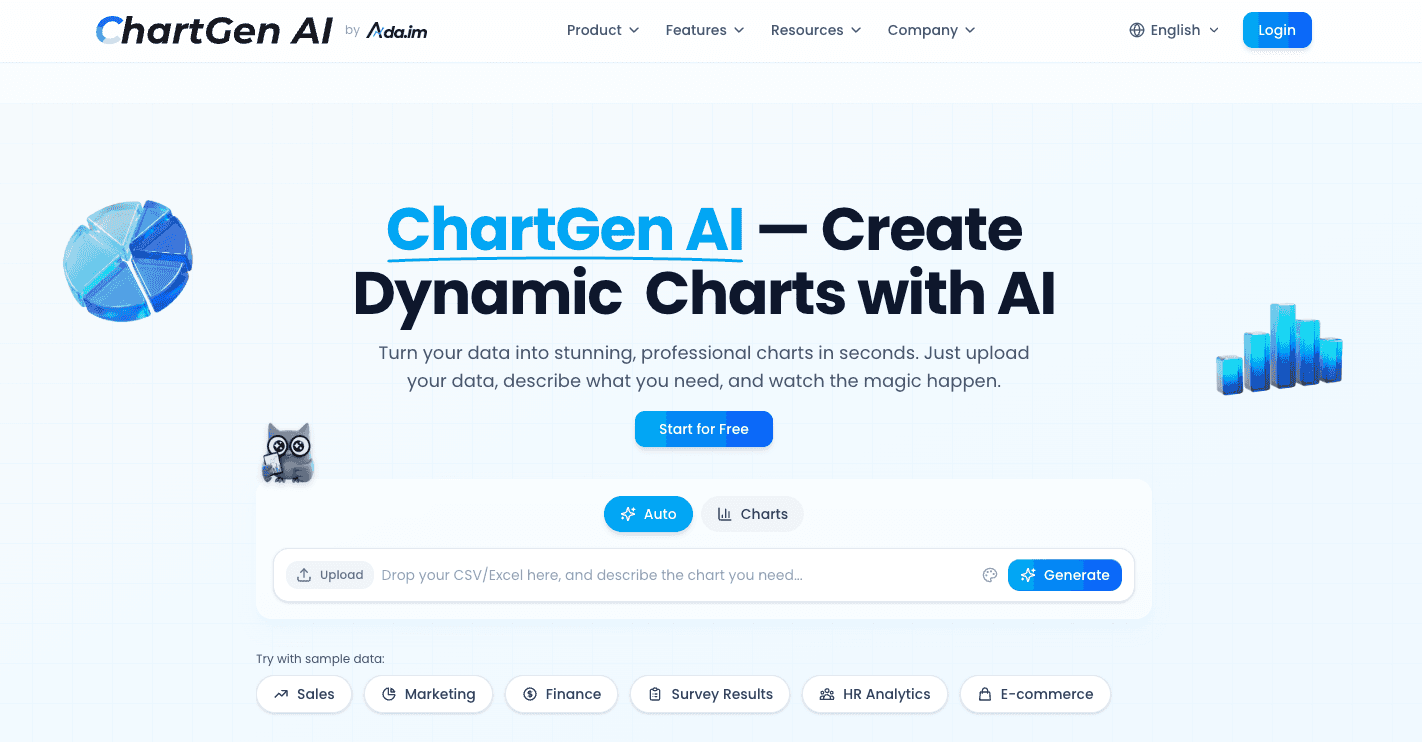
Key Features: Drag-and-drop CSV upload, minimalist prompt bar, fast SVG/PNG exports.
Pros: Lightning-fast processing; highly intuitive UI for absolute beginners.
Cons: Lacks deep data cleansing capabilities; struggles with multi-tab Excel files.
Pricing: Free tier with watermarks; Pro version is $20/month.
6. Dataiku
Dataiku is a heavyweight enterprise AI platform that integrates advanced machine learning with large-scale data visualization.

Key Features: Visual data pipelines, predictive modeling, MLOps, and robust governance features.
Pros: Built for massive, complex enterprise datasets; highly secure.
Cons: Very expensive; requires onboarding and is not suitable for solo marketers or small business owners.
Pricing: Custom enterprise pricing only.
7. Excelmatic
Excelmatic acts as a powerful AI add-in directly within Microsoft Excel, targeting users who refuse to leave the native spreadsheet environment.

Key Features: AI formula generation, automated pivot chart creation, and native spreadsheet formatting.
Pros: Zero context switching since it lives inside Excel; great for legacy data workflows.
Cons: Limited to Excel's native charting engine capabilities; cannot handle external big data well.
Pricing: 14-day free trial; $8.3/month.
8. Graphy
Graphy focuses heavily on the design and aesthetic aspect of data, turning dry statistics into interactive, highly visual dashboards.

Key Features: Stunning pre-built aesthetics, interactive chart embeds, and real-time data syncing.
Pros: Best-in-class visual design; perfect for client-facing reports and digital marketing.
Cons: Data manipulation features are somewhat limited compared to pure analytical tools.
Pricing: Free basic version; Pro plans start at $16/month.
Common Use Cases of AI Chart Generators
How are different industries leveraging this technology in 2026? Here are the highest-ROI scenarios.
Business Reporting and Dashboards
Operations managers use AI to ingest weekly sales CSVs and instantly generate comprehensive dashboards. Instead of spending hours compiling QBRs (Quarterly Business Reviews), AI tools automate the visualization of KPIs like revenue growth and operational efficiency.
Marketing Data Analysis
Marketers constantly deal with fragmented data from Google Ads, social media, and CRM platforms. An AI chart generator can merge these CSV exports to visualize customer acquisition costs (CAC), campaign ROI, and funnel drop-offs with a simple text prompt.
Financial Data Visualization
For finance teams, accuracy is non-negotiable. AI tools parse dense Excel balance sheets and cash flow statements to generate precise waterfall charts, variance analyses, and expense breakdown pie charts, helping CFOs spot financial anomalies instantly.
Academic Research and Data Presentation
Researchers dealing with large survey datasets or experimental results use AI to clean messy demographic data and generate statistically accurate box plots, scatter plots, and distribution curves for their peer-reviewed papers.
Startup and Product Analytics
Founders and product managers upload user telemetry data (CSVs of active users, feature usage, churn rates) to AI generators. The AI quickly visualizes user retention curves and cohort analyses, allowing startups to pivot faster without needing a full-time data analyst.
How to Create Charts from Excel or CSV Using AI: Step-by-Step Guide
Creating a chart using modern AI is incredibly straightforward. Let's use our top-rated tool, Powerdrill Bloom, as a practical example.
Step 1: Upload Your CSV/Excel File
Log into the platform and simply drag and drop your raw file into the interface. Powerdrill Bloom will automatically scan the document, detect the schema, and clean up any formatting errors or missing fields within seconds.
Step 2: Ask Questions
Instead of navigating complex menus, use the chat box. Type something like: "Generate a trendline chart showing our monthly recurring revenue (MRR) over the last 12 months, and highlight the top 3 performing months." The AI will instantly process the request and display the visualization.
Step 3: Customize and Export to PPT
Review the generated chart and the accompanying AI-written business insights. With one click, use Powerdrill Bloom's standout feature to export the entire analysis directly into a beautifully formatted PowerPoint presentation, ready for your next meeting.
How to Choose the Best AI Chart Generator
With so many options, what should you look for? Evaluate these three core criteria:
Does It Support Large or Messy CSV Files?
Check the tool's data processing limits. Tools like ChartGen AI are great for small files, but if you have a CSV with a million rows, you need robust platforms like ChatGPT or Powerdrill Bloom that can handle heavy lifting without crashing.
Do You Need Direct PPT Export Capabilities?
If your end goal is presenting to stakeholders, pure analytical tools like Julius AI might require tedious copy-pasting. Opt for tools that prioritize presentation-ready exports, specifically those that auto-generate PowerPoint slides.
Data Privacy and Security Standards
If you are uploading sensitive financial or customer data, ensure the platform complies with SOC2 and GDPR. Enterprise-grade tools will not use your private data to train public AI models.
Conclusion
The era of manual data manipulation is officially over. In 2026, leveraging an AI chart generator is no longer a luxury—it is a baseline necessity for any professional dealing with Excel and CSV files. By adopting these tools, you bypass hours of tedious work and jump straight to the most valuable part of data analysis: strategic decision-making.
Ready to ditch tedious formulas and instantly turn your raw Excel and CSV data into compelling visual charts with the power of AI? Try Powerdrill Bloom for free today!
Frequently Asked Questions - FAQs
Can AI generate charts from messy CSV files?
Yes. Modern AI chart generators have built-in data cleansing capabilities. They can automatically identify missing values, fix inconsistent date formats, and structure messy CSV files before generating accurate charts.
Do I need coding skills to use an AI chart generator?
Not at all. The primary advantage of these tools in 2026 is their "zero-code" interface. You interact with the data strictly using natural language prompts (plain English).
What is the best AI chart generator for PowerPoint presentations?
Powerdrill Bloom is currently the best tool for this specific use case. It analyzes your Excel/CSV data, generates the appropriate charts, creates written insights, and exports everything into a fully editable PowerPoint presentation in one click.
Can AI automatically analyze data and suggest the best chart type?
Yes. Advanced NLP algorithms analyze the data structure (e.g., time-series vs. categorical) and automatically select the most effective visualization, such as assigning line charts for timelines or scatter plots for correlations.
Are there free AI chart generators?
Yes, many top-tier tools offer freemium models. Platforms like Powerdrill Bloom, Julius AI, and ChartGen AI provide free tiers that allow users to upload basic CSV files and generate charts at no cost, with premium features available for larger datasets.